. 2024 Sep 20;14(9):509.
doi: 10.3390/metabo14090509.

Investigating the Mechanisms of 15-PGDH Inhibitor SW033291 in Improving Type 2 Diabetes Mellitus: Insights from Metabolomics and Transcriptomics

Affiliations

Investigating the Mechanisms of 15-PGDH Inhibitor SW033291 in Improving Type 2 Diabetes Mellitus: Insights from Metabolomics and Transcriptomics

Yuanfeng Huang et al. Metabolites. .

Abstract

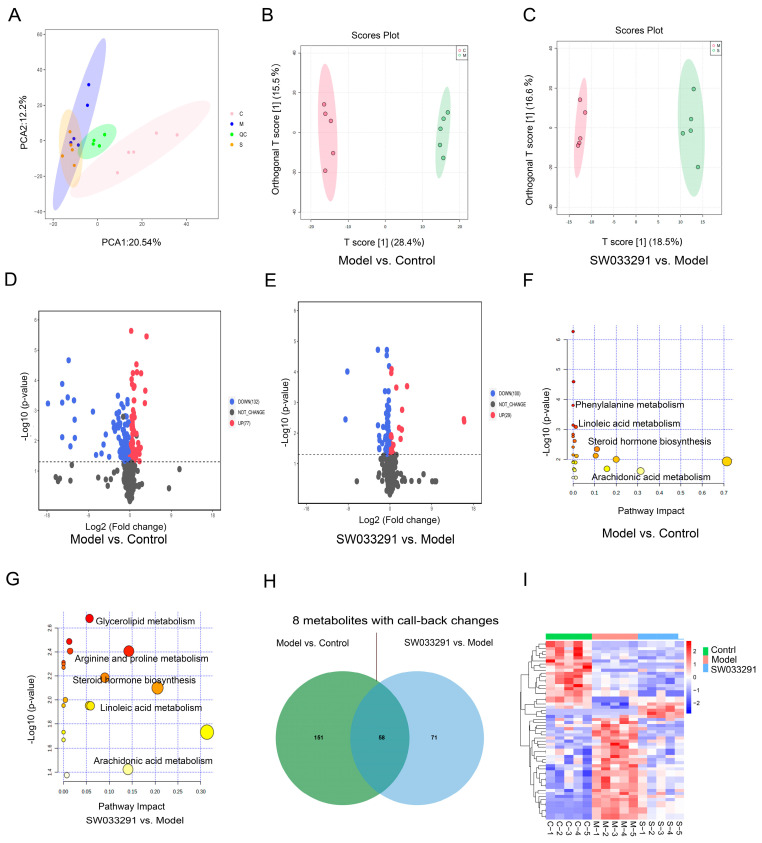
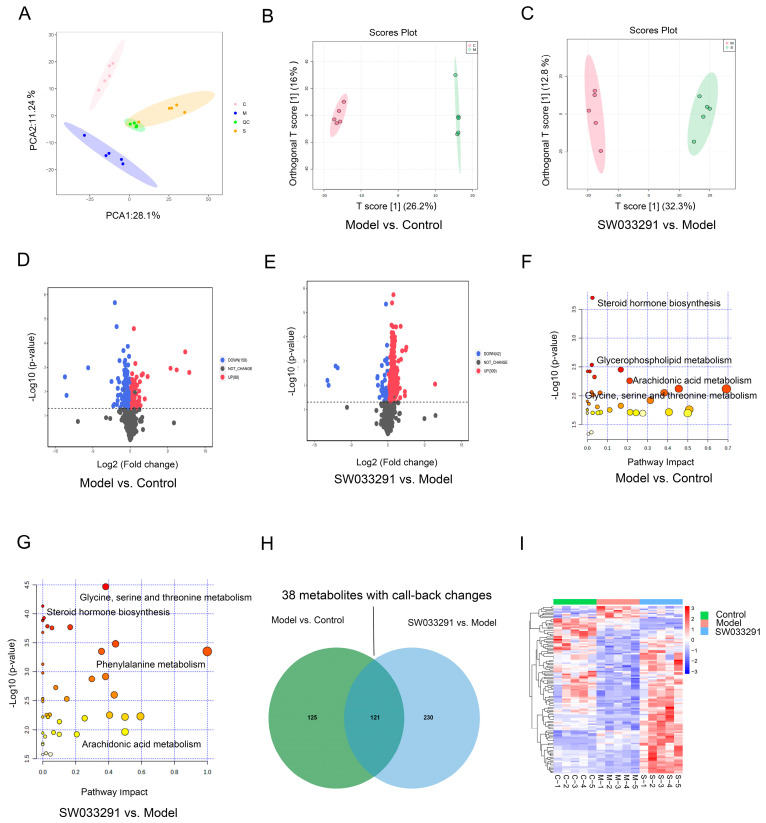
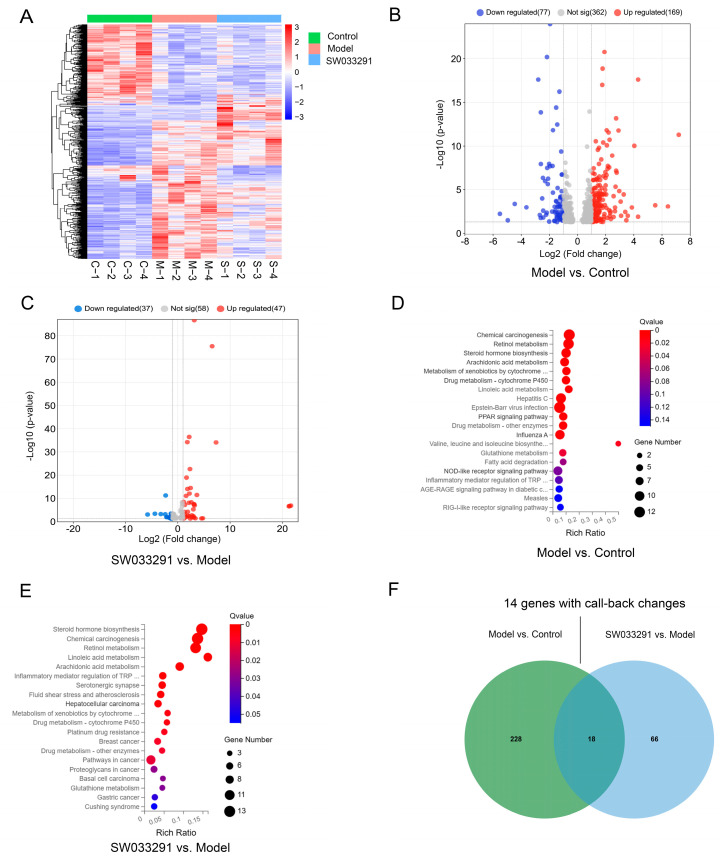
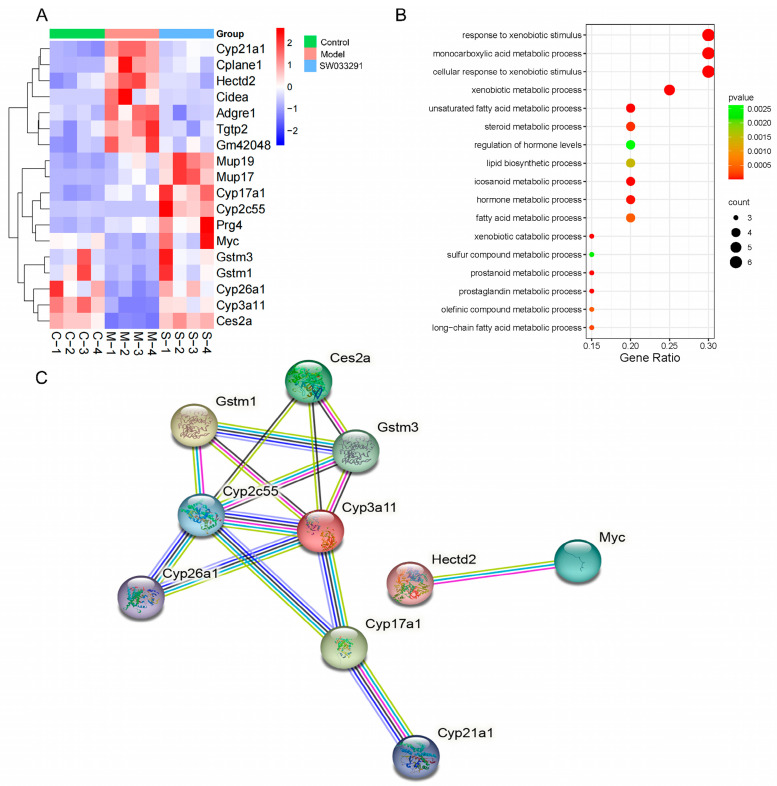
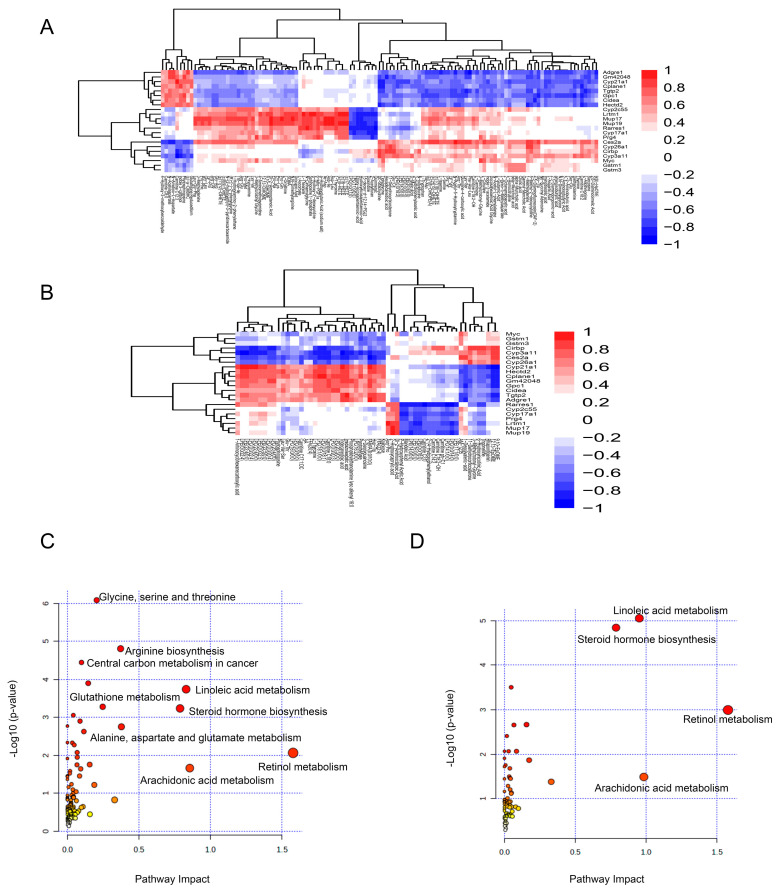
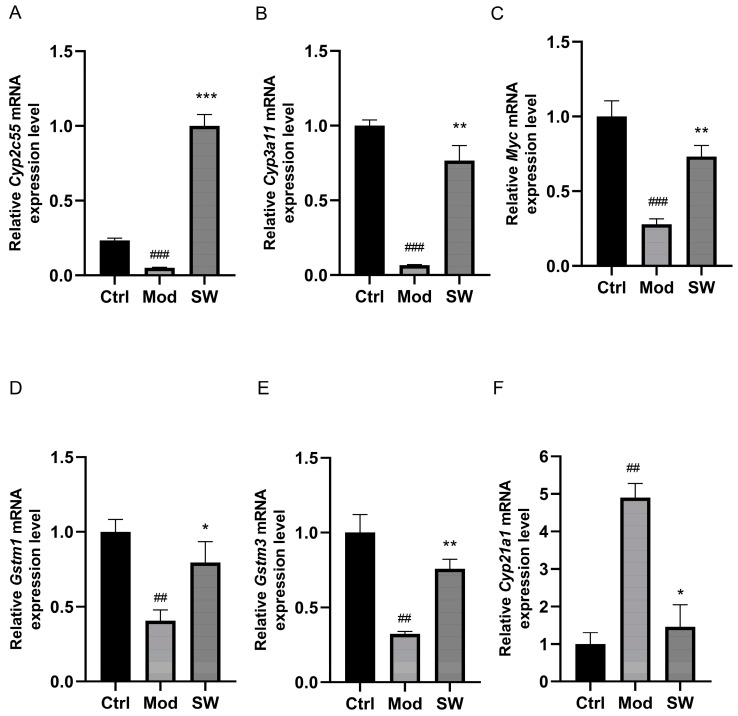
This study focused on exploring the effects of SW033291, an inhibitor of 15-hydroxyprostaglandin dehydrogenase, on type 2 diabetes mellitus (T2DM) mice from a comprehensive perspective. Studies have demonstrated that SW033291 benefits tissue repair, organ function, and muscle mass in elderly mice. Our recent investigation initially reported the beneficial effect of SW033291 on T2DM progression. Herein, we used a T2DM mouse model induced by a high-fat diet and streptozotocin injection. Then, serum and liver metabolomics, as well as liver transcriptomic analyses, were performed to provide a systematic perspective of the SW033291-ameliorated T2DM. The results indicate SW033291 improved T2DM by regulating steroid hormone biosynthesis and linoleic/arachidonic acid metabolism. Furthermore, integrated transcriptomic and metabolomic analyses suggested that key genes and metabolites such as Cyp2c55, Cyp3a11, Cyp21a1, Myc, Gstm1, Gstm3, 9,10-dihydroxyoctadecenoic acid, 11-dehydrocorticosterone, and 12,13-dihydroxy-9Z-octadecenoic acid played crucial roles in these pathways. qPCR analysis validated the significant decreases in the hepatic gene expressions of Cyp2c55, Cyp3a11, Myc, Gstm1, and Gstm3 in the T2DM mice, which were reversed following SW033291 treatment. Meanwhile, the elevated mRNA level of Cyp21a1 in T2DM mice was decreased after SW033291 administration. Taken together, our findings suggest that SW033291 has promising potential in alleviating T2DM and could be a novel therapeutic candidate.

Keywords: 15-hydroxyprostaglandin dehydrogenase; SW033291; metabolomics; transcriptomics; type 2 diabetes mellitus.


Conflict of interest statement

There are no conflicts of interest to declare.

Figures

Figure 1
Figure 1
Comprehensive serum metabolomic analysis in control, model, and SW033291−treated mice, revealing distinct metabolic profiles. (A) The principal component analysis (PCA) score plot illustrates the metabolic variance among control, model, and SW033291−treated groups, highlighting the separability of metabolic profiles. Orthogonal partial least squares−discriminant analysis (OPLS−DA) plots comparing (B) “Model vs. Control” and (C) “SW033291 vs. Model” groups, showcasing the group discrimination. (D,E) Volcano maps for “Model vs. Control” and “SW033291 vs. Model” comparisons, depicting the fold change and statistical significance of individual serum metabolites, where up−regulated and down−regulated metabolites are indicated by red and blue, respectively. Metabolites above the dashed line in the volcano plot indicate a p-value of less than 0.05. (F,G) KEGG pathway enrichment analysis of significantly changed serum metabolites in “Model vs. Control” and “SW033291 vs. Model” comparisons, identifying dysregulated metabolic pathways. The deeper the color of the circle, and the closer it is to red, the smaller the p-value. (H) Venn diagram representing the number of unique and shared serum metabolites with significant changes in “Model vs. Control” and “SW033291 vs. Model” comparisons. (I) Clustered heatmap of the 58 overlapping and differentially changed serum metabolites, with color intensity reflecting the magnitude of up−regulation (red) or down−regulation (blue).
Figure 2
Figure 2
Hepatic metabolomic profiling in control, model, and SW033291−treated mice, uncovering treatment−specific metabolic alterations. (A) PCA score plot reveals the distinct metabolic fingerprints among the three groups. OPLS−DA plots comparing (B) “Model vs. Control” and (C) “SW033291 vs. Model” groups, presenting the group discrimination. (D,E) Volcano maps for “Model vs. Control” and “SW033291 vs. Model” comparisons, depicting the fold change and statistical significance of hepatic metabolites, where up−regulated and down−regulated metabolites are shown in red and blue, respectively. Metabolites above the dashed line in the volcano plot indicate a p-value of less than 0.05. (F,G) KEGG pathway enrichment analysis of significantly changed hepatic metabolites in the “Model vs. Control” and “SW033291 vs. Model” comparisons, providing insights into the metabolic pathways affected by SW033291 treatment. The deeper the color of the circle, and the closer it is to red, the smaller the p-value. (H) Venn diagram illustrating the number of unique and overlapping hepatic metabolites with significant changes in “Model vs. Control” and “SW033291 vs. Model” comparisons. (I) Clustered heatmap of 121 overlapping and differentially changed hepatic metabolites, with color intensity reflecting the magnitude of up−regulation (red) or down−regulation (blue).
Figure 3
Figure 3
Comparative hepatic transcriptomics profiling in Control, Model, and SW033291−treated mice. (A) Cluster heatmap analysis depicting the expression patterns of hepatic genes across the three groups, with color gradients indicating the magnitude of up−regulation (red) or down−regulation (blue). (B,C) Volcano maps for “Model vs. Control” and “SW033291 vs. Model” comparisons, visualizing the statistical significance of and fold change in gene expression. (D,E) KEGG pathway enrichment analysis for the “Model vs. Control” and “SW033291 vs. Model” comparisons, pinpointing the biological processes and pathways influenced by the treatment. (F) Venn diagram displaying the number of distinct and shared significantly altered hepatic genes.
Figure 4
Figure 4
Detailed transcriptomic analysis of liver tissue identifying key genes and pathways in control, model, and SW033291−treated mice. (A) Cluster heatmap analysis highlighting the expression of 18 key genes that are differentially expressed across three groups. Gene expression changes are represented by red (up−regulated) and blue (down−regulated) colors. (B) Gene Ontology analysis enriches biological processes associated with the 18 overlapping and differentially expressed genes, offering insights into the affected cellular processes and molecular mechanisms. (C) Protein−protein interaction network analysis based on the 18 overlapping and significantly altered genes, revealing potential functional associations and regulatory networks. Disconnected nodes are not shown in the network.
Figure 5
Figure 5
Integrative analysis of metabolomics and transcriptomics reveals complex interactions between gene expression and metabolite profiles. (A) Heat map depicting the associations between differentially changed genes and metabolites in the combined analyses of liver transcriptomics and liver metabolomics. (B) Combined analyses of liver transcriptomics and serum metabolomics. In these heat maps, correlations are color−coded: −1 < r < 0 indicates a negative correlation, visualized in blue; 0 < r < 1 indicates a positive correlation, visualized in red; and r = 0 indicates no correlation, visualized in white. The intensity of the color reflects the strength of the correlation, providing a quantitative measure of the association between gene expression and metabolite levels. Joint-pathway analysis of (C) liver transcriptomics and liver metabolomics and (D) liver transcriptomics and serum metabolomics identifying convergent pathways affected by SW033291 treatment.
Figure 6
Figure 6
Quantitative mRNA expression analysis of select genes in liver tissue from control, model, and SW033291−treated mice. The livers from the control (Ctrl), model (Mod), and SW033291−treated (SW) group were analyzed for hepatic mRNA levels of (AF) Cyp2c55, Cyp3a11, Myc, Gstm1, Gstm3, and Cyp21a1, respectively. n = 6. Data are presented as mean ± SEM. ## p < 0.01, ### p < 0.001 vs. the Ctrl group; * p < 0.05, ** p < 0.01, *** p < 0.001 vs. the Mod group.

References

    1. Sun H., Saeedi P., Karuranga S., Pinkepank M., Ogurtsova K., Duncan B.B., Stein C., Basit A., Chan J.C.N., Mbanya J.C., et al. IDF Diabetes Atlas: Global, regional and country-level diabetes prevalence estimates for 2021 and projections for 2045. Diabetes Res. Clin. Pract. 2022;183:109119. doi: 10.1016/j.diabres.2021.109119. - DOI - PMC - PubMed
    1. Chatterjee S., Khunti K., Davies M.J. Type 2 diabetes. Lancet. 2017;389:2239–2251. doi: 10.1016/S0140-6736(17)30058-2. - DOI - PubMed
    1. DeFronzo R.A., Ferrannini E., Groop L., Henry R.R., Herman W.H., Holst J.J., Hu F.B., Kahn C.R., Raz I., Shulman G.I., et al. Type 2 diabetes mellitus. Nat. Rev. Dis. Primers. 2015;1:15019. doi: 10.1038/nrdp.2015.19. - DOI - PubMed
    1. Zhou P., Xie W., He S., Sun Y., Meng X., Sun G., Sun X. Ginsenoside Rb1 as an Anti-Diabetic Agent and Its Underlying Mechanism Analysis. Cells. 2019;8:204. doi: 10.3390/cells8030204. - DOI - PMC - PubMed
    1. Cheng H., Huang H., Guo Z., Chang Y., Li Z. Role of prostaglandin E2 in tissue repair and regeneration. Theranostics. 2021;18:8836–8854. doi: 10.7150/thno.63396. - DOI - PMC - PubMed

LinkOut - more resources