. 2024 Sep 2;12(9):646.
doi: 10.3390/toxics12090646.

Multi-Walled Carbon Nanotubes Accelerate Leukaemia Development in a Mouse Model

Affiliations

Multi-Walled Carbon Nanotubes Accelerate Leukaemia Development in a Mouse Model

Qingqing Wang et al. Toxics. .

Erratum in

Abstract

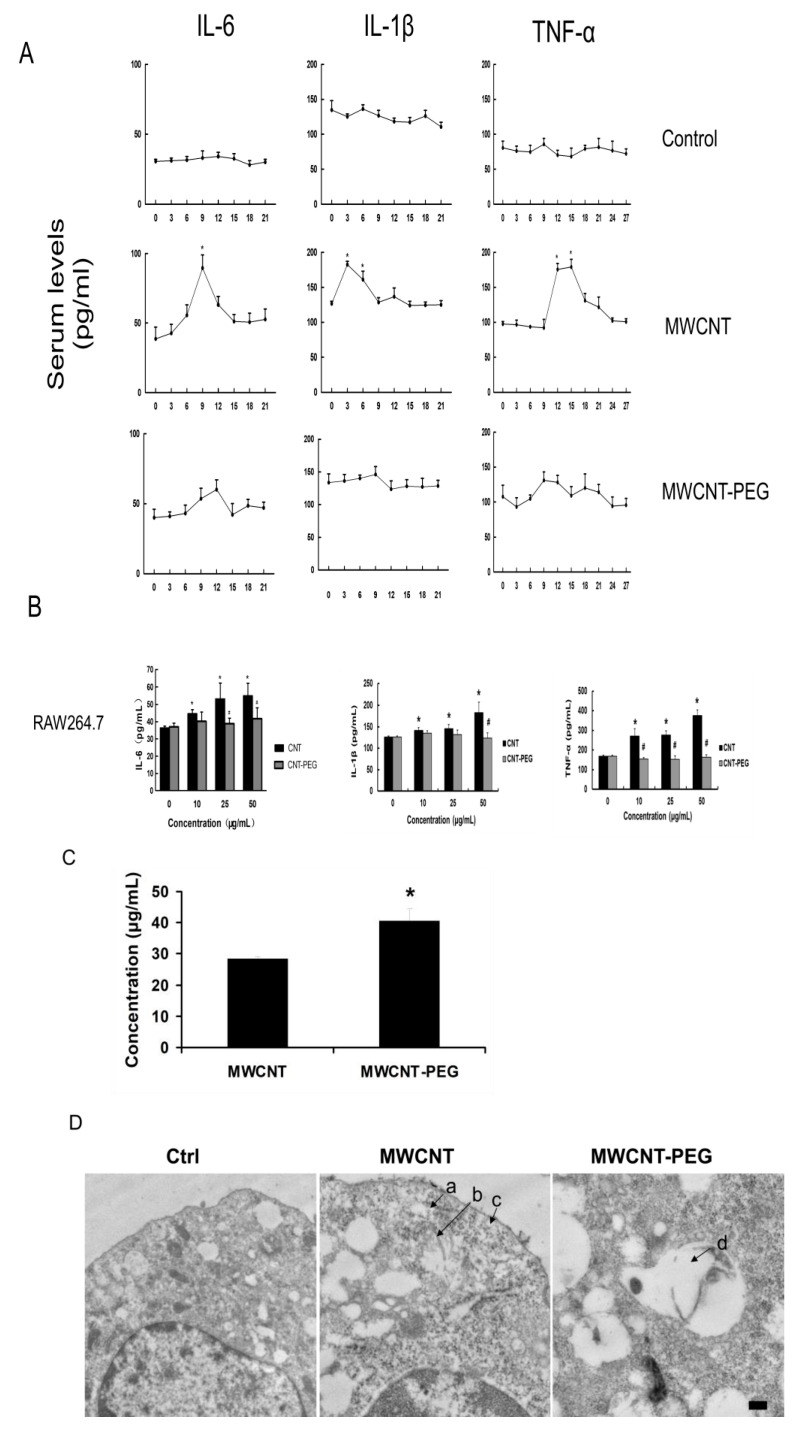
Inflammation is associated with an increased risk of developing various cancers in both animals and humans, primarily solid tumors but also myeloproliferative neoplasms (MPNs), myelodysplastic syndromes (MDS), and acute myeloid leukemia (AML). Multi-walled carbon nanotubes (MWCNTs), a type of carbon nanotubes (CNTs) increasingly used in medical research and other fields, are leading to a rising human exposure. Our study demonstrated that exposing mice to MWCNTs accelerated the progression of spontaneous MOL4070LTR virus-induced leukemia. Additionally, similar exposures elevated pro-inflammatory cytokines such as interleukin (IL)-1β, IL-6, and tumor necrosis factor (TNF)-α and induced reactive oxygen species (ROS) in a murine macrophage cell line. These effects were significantly reduced in immunodeficient mice and when mice were treated with methoxypolyethylene glycol amine (PEG)-modified MWCNTs. These findings underscore the necessity of evaluating the safety of MWCNTs, particularly for those with hematologic cancers.

Keywords: MOL4070LTR; PEG; inflammation; leukemia; multi-walled carbon nanotubes.


Conflict of interest statement

The authors declare no conflicts of interest.

Figures

Figure 1
Figure 1
Schematic illustration depicting the procedure for establishing the MuLV-induced mouse model of leukemia.
Figure 2
Figure 2
Tubular structure of oxidized MWCNTs. (SEM image showing MWCNTs used in the study, scale bar: 200 nm).
Figure 3
Figure 3
Gross anatomy of MuLV-induced leukemia in mice. (Ctrl is the control; CNT: MWCNTs; RV: MuLV; SCID and FVB/n are both mouse strains. RV + CNT is the combination of MuLV and MWCNTs).
Figure 4
Figure 4
Survival probability of mice injected with MuLV alone or in combination with MWCNTs. (A). Cumulative incidence of leukemia in mice injected with PBS (Control; n = 15), MuLV (n = 15), 8 injections of MWCNTs (n = 15), or MuLV + 8 injections of MWCNTs (n = 15) (* MuLV vs. MuLV + MWCNTs; p = 0.01); (B). Cumulative incidence of leukemia in mice injected with PBS (Control; n = 10), MuLV (n = 10), MWCNTs (n = 10), MuLV + 3 injections of MWCNTs (n = 10), or 8 injections of MWCNTs (n = 10). (* MuLV + MWCNTs 8 vs. MuLV + MWCNTs 3: p = 0.03).
Figure 5
Figure 5
Effect of MWCNTs on MOL4070LTR-induced leukemia. (A). H&E-stained sections of (a) blood; (b) liver; (c) lung; (d) lymph node; (e) kidney; and (f) spleen from normal (upper panel) and leukemic (lower panel) mice. (B) Immunostaining of BM and LN cells from normal (left panel) or leukemic (right panel) mice with fluorescence-conjugated antibodies recognizing TCR-β+/B220+ (upper panel) or CD11b+/Gr-1+ (lower panel). Numbers in quadrants indicate percentage of each subpopulation. LN, lymph node; BM, bone marrow; H&E, hematoxylin and eosin).
Figure 6
Figure 6
Weight map of spleen and liver of mice; the organ/body weight ratio after the test (spleen and liver weights; the organ/body weight ratio for mice receiving MWCNTs, MuLV, and MWCNTs + MuLV (* p < 0.05), (*** p < 0.001)).
Figure 7
Figure 7
Effect of MWCNTs-PEG on MOL4070LTR-induced leukemia. (A) SEM image of MWCNTs-PEG (scale bar: 200 nm); (B). Cumulative incidence of leukemia in mice receiving PBS (Control; n = 12), MuLV only (MuLV; n = 12), MWCNTs alone (n = 12), MuLV + MWCNTs (n = 12), or MuLV + MWCNTs-PEG (n = 12). (* MuLV + MWCNTs vs. MuLV or MuLV + MWCNTs-PEG; both p = 0.01). MWCNTs, multi-walled carbon nanotubes; PEG, methoxypolyethylene glycol amine; PBS; phosphate-buffered saline.
Figure 8
Figure 8
Effect of MWCNTs on leukemia development in immune deficient mice. (A) Cumulative incidence of leukemia in SCID mice receiving PBS (Control; n = 20), MuLV only (n = 22), MWCNTs only (n = 20), or MuLV + MWCNTs (n = 17); (B) Wright-Giemsa staining, representative blood smears of healthy (left panel) and immune deficient mice (right panel).
Figure 9
Figure 9
Pro-inflammatory cytokines in mice injected with MWCNTs or MWCNTs-PEG. (A) Serum levels of IL-6, IL-1β, and TNF-α. Mean ± SD of 8 mice per time point (p = 0.01); (B) concentrations of IL-6, TNF-α, and IL-1β in supernatants of mouse macrophage cell line RAW264.7 co-incubated with MWCNTs or MWCNTs-PEG at indicated concentrations for 48 h (p < 0.05; MWCNTs vs. Control; # p < 0.05; MWCNTs-PEG vs. MWCNTs at same concentration). (C) Supernatant concentrations of MWCNTs and MWCNTs-PEG measured by UV absorbance, as described in Methods. (* p = 0.01; MWCNTs vs. MWCNTs-PEG.) (D) Transmission electron microscopy (TEM) images showing the uptake of MWCNTs or MWCNTs-PEG by RAW264.7 cells. Scale bar: 200 nm. MWCNTs, multi-walled carbon nanotubes; PEG, methoxypolyethylene glycol amine; TEM, transmission electron microscopy.
Figure 10
Figure 10
Effect of MWCNTs on intra-cellular ROS levels. (ROS levels in RAW264.7 cells following co-incubation with MWCNTs or MWCNTs-PEG at indicated concentrations for 16 h, prior to DCFH staining.) (A) Flow cytometry detection results of cellular ROS levels. (B) Quantitative analysis of cellular ROS levels in each group. * p = 0.001, # p < 0.05. *: MWCNTs vs. Control; #: MWCNTs-PEG vs. MWCNTs. MWCNTs, multi-walled carbon nanotubes; PEG, methoxypolyethylene glycol amine; ROS, reactive oxygen species; DCFH, 2’,7’-Dichlorofluorescin).
Figure 10
Figure 10
Effect of MWCNTs on intra-cellular ROS levels. (ROS levels in RAW264.7 cells following co-incubation with MWCNTs or MWCNTs-PEG at indicated concentrations for 16 h, prior to DCFH staining.) (A) Flow cytometry detection results of cellular ROS levels. (B) Quantitative analysis of cellular ROS levels in each group. * p = 0.001, # p < 0.05. *: MWCNTs vs. Control; #: MWCNTs-PEG vs. MWCNTs. MWCNTs, multi-walled carbon nanotubes; PEG, methoxypolyethylene glycol amine; ROS, reactive oxygen species; DCFH, 2’,7’-Dichlorofluorescin).
Figure 11
Figure 11
Model of potential mechanism of how MWCNTs accelerated leukemia development. MOL4070LTR induced leukemia in all susceptible mice. Injection of MWCNTs but not MWCNTs-PEG accelerated development by increasing ROS in macrophages and blood levels of pro-inflammatory cytokines. ROS, reactive oxygen species; MWCNTs, multi-walled carbon nanotubes; PEG, methoxypolyethylene glycol amine.

Similar articles

Cited by

References

    1. Yang M.M., Alexe M. Sunlight harvested by nanotubes. Nature. 2019;570:310–311. doi: 10.1038/d41586-019-01767-6. - DOI - PubMed
    1. Tunuguntla R.H., Henley R.Y., Yao Y.C., Pham T.A., Wanunu M., Noy A. Enhanced water permeability and tunable ion selectivity in subnanometer carbon nanotube porins. Science. 2017;357:792–796. doi: 10.1126/science.aan2438. - DOI - PubMed
    1. Shi H.K., Carter S., Haines N.L. Harvesting electrical energy from carbon nanotube yarn twist. Science. 2017;357:773–778. - PubMed
    1. De Volder M.F., Tawfick S.H., Baughman R.H., Hart A.J. Carbon Nanotubes: Present and Future Commercial Applications. Science. 2013;339:535–539. doi: 10.1126/science.1222453. - DOI - PubMed
    1. Lima M.D., Li N., Jung de Andrade M., Fang S., Oh J., Spinks G.M., Kozlov M.E., Haines C.S., Suh D., Foroughi J., et al. Electrically, Chemically, and Photonically Powered Torsional and Tensile Actuation of Hybrid Carbon Nanotube Yarn Muscles. Science. 2012;338:928–932. doi: 10.1126/science.1226762. - DOI - PubMed

LinkOut - more resources