. 2024 Sep 9;12(9):658.
doi: 10.3390/toxics12090658.

A High-Throughput Method for Quantifying Drosophila Fecundity

Affiliations

A High-Throughput Method for Quantifying Drosophila Fecundity

Andreana Gomez et al. Toxics. .

Abstract

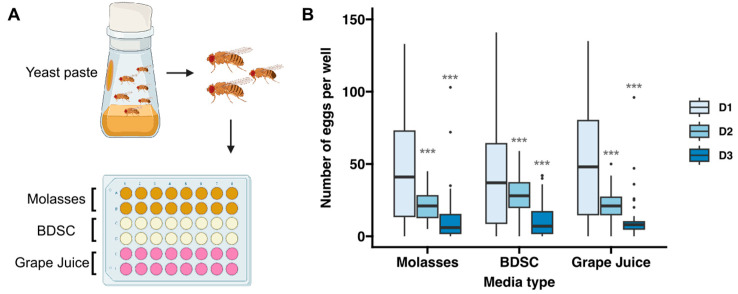
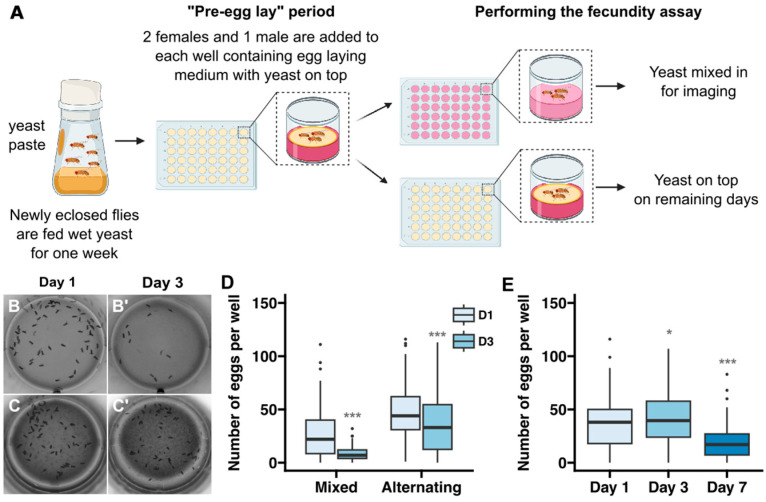
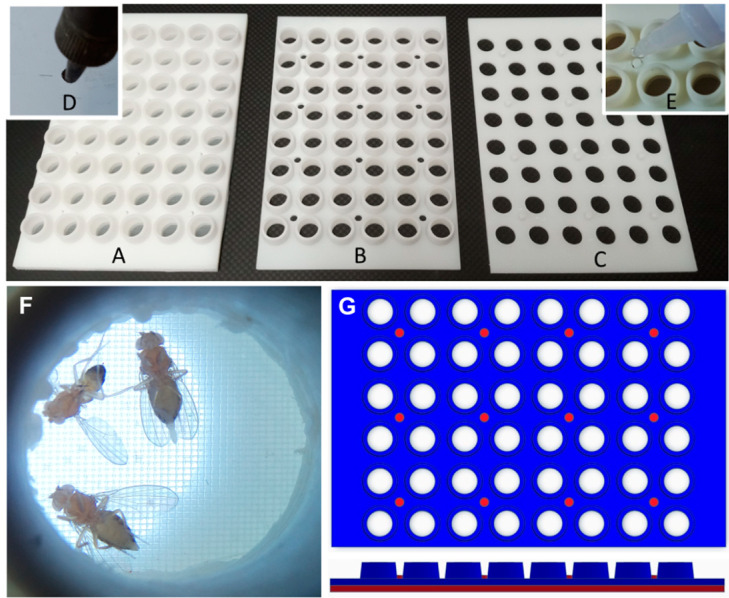
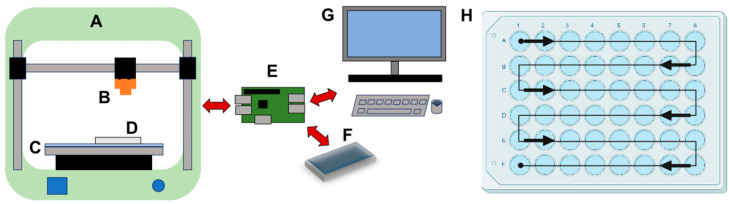
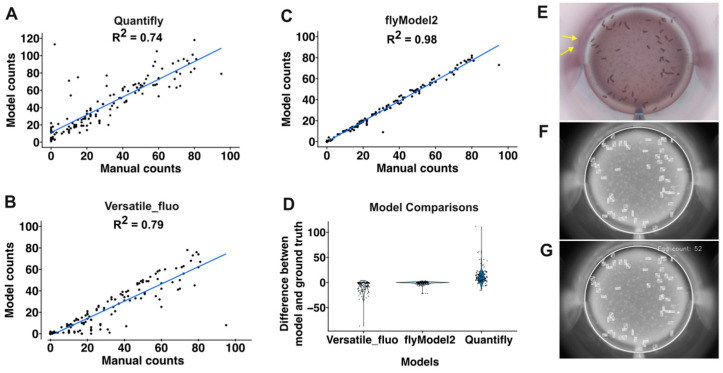
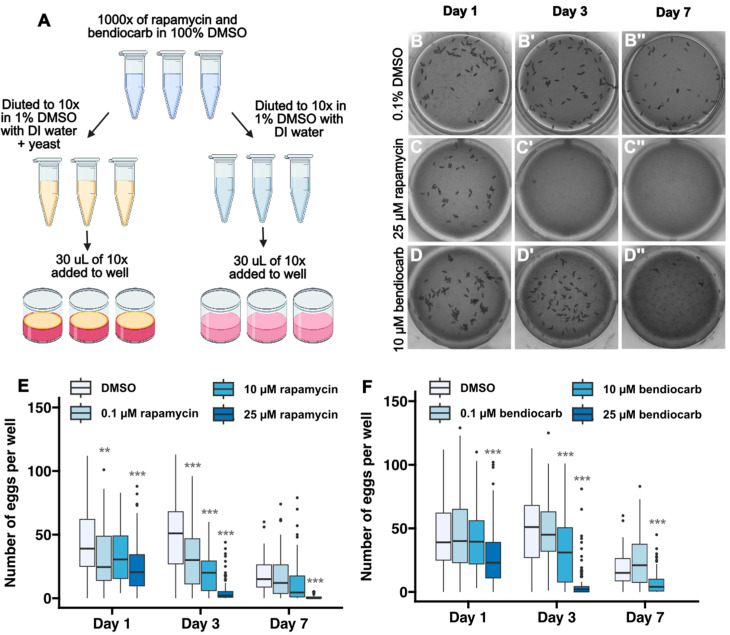
The fruit fly, Drosophila melanogaster, is an experimentally tractable model system that has recently emerged as a powerful "new approach methodology" (NAM) for chemical safety testing. As oogenesis is well conserved at the molecular and cellular level, measurements of Drosophila fecundity can be useful for identifying chemicals that affect reproductive health across species. However, standard Drosophila fecundity assays have been difficult to perform in a high-throughput manner because experimental factors such as the physiological state of the flies and environmental cues must be carefully controlled to achieve consistent results. In addition, exposing flies to a large number of different experimental conditions (such as chemical additives in the diet) and manually counting the number of eggs laid to determine the impact on fecundity is time-consuming. We have overcome these challenges by combining a new multiwell fly culture strategy with a novel 3D-printed fly transfer device to rapidly and accurately transfer flies from one plate to another, the RoboCam, a low-cost, custom-built robotic camera to capture images of the wells automatically, and an image segmentation pipeline to automatically identify and quantify eggs. We show that this method is compatible with robust and consistent egg laying throughout the assay period and demonstrate that the automated pipeline for quantifying fecundity is very accurate (r2 = 0.98 for the correlation between the automated egg counts and the ground truth). In addition, we show that this method can be used to efficiently detect the effects on fecundity induced by dietary exposure to chemicals. Taken together, this strategy substantially increases the efficiency and reproducibility of high-throughput egg-laying assays that require exposing flies to multiple different media conditions.

Keywords: Drosophila; oogenesis; reproductive toxicology.


Conflict of interest statement

The authors declare no conflict of interest.

Figures

Figure 1
Figure 1
Quantification of fecundity over three days on different types of media. (A) Diagram showing the workflow for this assay. Flies were fed wet yeast paste for two consecutive days and then 2 females and 1 male were transferred into each well of a 48-well plate with molasses-based, BDSC-based (tan), grape juiceagarose-based media (16 wells for each condition, as indicated in gold, tan, and pink colors, respectively) and allowed to lay eggs for 23 h. (B) Graph showing the number of eggs laid in each condition, as determined by manual counts. Sample sizes per condition range from 29 to 61 wells and the data were collected from 2–4 independent replicates. Asterisks indicate statistical significance using Bonferroni-corrected pairwise t-tests between D1 and D2 or D3 for each condition. *** p < 0.001.
Figure 2
Figure 2
Development of protocol for assaying fecundity over 7 days. (A) Diagram showing a workflow in which flies are maintained on media with yeast mixed in on the days in which images will be acquired to assess fecundity and on media with yeast on top during the remaining days. In the “alternating” conditions shown in panels (CE), flies were put on media with yeast mixed in on days 1, 3, and 7 and on media with yeast on top on days 2, 4, 5, and 6. (BD) Representative examples of wells from a 3 day time course in which flies were maintained in wells with the yeast mixed into the media at all time points (B) or alternating between wells with yeast mixed into the media on days 1 and 3 and yeast on top on day 2 (C) and a graph showing the number of eggs laid in each regime (D). (E) Graph showing the number of eggs laid in the alternating regime over a 7-day time course. Sample sizes in (D,E) per condition range from 78 to 144 wells and the data were collected from 3–7 independent replicates. Asterisks indicate statistical significance using Bonferroni-corrected pairwise t-tests between D1 and D3 for each condition in (D) and D1 and D3 or D7 in (E). * p < 0.05, *** p < 0.001.
Figure 3
Figure 3
Fly transfer device. (AG) A fly transfer lid (A) is constructed from a layer of nylon mesh bonded between an array of cups (B) and holes (C). Studs in the hole layer (C) pass through corresponding holes in the cup (B) and nylon layers, creating individual gas exchange tops for each well. A hot soldering iron, guided by holes in a metal template, creates holes in the nylon mesh (D). The final assembly (E) studs are bonded with cyanoacrylate glue. (F) When placed on a CO2 plate, anesthetized flies fall into their corresponding cup, enabling the plate to be replaced and flipped, simultaneously transferring all flies into new wells. (G) Top and side view of the fly transfer device. The cup layer is shown in blue and the hole layer is shown in red.
Figure 4
Figure 4
RoboCam device for automated image capture. A 3D printer (A) is modified by adding a camera (B) and light plate (C), where the 48-well plate (D) is located. The light ensures good contrast between the eggs and the media while minimizing shadows and reflections. A single-board computer (E) controls the x, y, and z movement of the camera (B) and saves captured images on a hard drive (F). The user programs the RoboCam using a graphical user interface with a keyboard, mouse, and monitor (G). (H) Camera system moves in a snake path, centering over individual wells.
Figure 5
Figure 5
Automated image analysis pipeline. (AC) Graphs showing comparisons of manual egg counts to automated egg counts using Quantifly (A), Stardist with the Versatile_fluo model (B), or Stardist using a custom-build model, flyModel2 (C). Each dot shows the manual and automated counts from a single well. (D) Graph showing the error between manual and automated egg counts. Each dot is the difference between the automated count and the manual count (ground truth). (EG) Images showing individual steps in the automated image analysis pipeline. Starting from the raw image (E), the Stardist model identifies the eggs and the elipse detection tool identifies the well edge (boxed regions and white circle, respectively in Panel F). Then, the number of boxed regions (eggs) within the well are counted (G). Eggs reflected in the well walls are indicated with yellow arrows.
Figure 6
Figure 6
Detection of the impact of dietary exposure to rapamycin and bendiocarb. (A) Diagram showing workflow for fecundity assays in which chemicals are added to the diet. Chemicals are dissolved in 100% DMSO to a 1000× concentration. Then, they are diluted to 10× concentration in 1% DMSO with either water or water plus yeast. Finally, 30 µL of the 10× solution is pipetted into each well, which contains 300 µL of media, producing a final concentration of 1x chemical in 0.1% DMSO. Using this protocol, flies were exposed to 0.1% DMSO or indicated concentrations of rapamycin or bendiocarb in 0.1% DMSO for 7 days. Egg counts were quantified on days 1, 3, and 7. (BD) Images of wells at 1, 3 or 7 days after exposure to 0.1% DMSO (B), 25 µM rapamycin (C), or 10 µM bendiocarb (D). (E,F) Graphs showing the number of eggs laid in the indicated conditions over the 7-day time course. Flies did not survive for 7 days on 25 µM bendiocarb. Asterisks indicate a statistically significant difference compared to the DMSO condition on the same day ** p < 0.01, *** p < 0.001 using pairwise t-tests with a Bonferroni multiple hypothesis test correction.
Figure 7
Figure 7
Downsampling of data from dietary exposure to rapamycin and bendiocarb. The p-values from 100 iterations of downsampling the data by randomly selecting 4, 8, 16, or 24 wells from the day 1, day 3, and day 7 datasets are displayed on the graphs. p-values to the left of the red dotted line are below the conventional 0.05 threshold for statistical significance.

Update of

Similar articles

Cited by

References

    1. Naidu R., Biswas B., Willett I.R., Cribb J., Kumar Singh B., Paul Nathanail C., Coulon F., Semple K.T., Jones K.C., Barclay A., et al. Chemical Pollution: A Growing Peril and Potential Catastrophic Risk to Humanity. Environ. Int. 2021;156:106616. doi: 10.1016/j.envint.2021.106616. - DOI - PubMed
    1. Stucki A.O., Barton-Maclaren T.S., Bhuller Y., Henriquez J.E., Henry T.R., Hirn C., Miller-Holt J., Nagy E.G., Perron M.M., Ratzlaff D.E., et al. Use of New Approach Methodologies (NAMs) to Meet Regulatory Requirements for the Assessment of Industrial Chemicals and Pesticides for Effects on Human Health. Front. Toxicol. 2022;4:964553. doi: 10.3389/ftox.2022.964553. - DOI - PMC - PubMed
    1. Holsopple J.M., Smoot S.R., Popodi E.M., Colbourne J.K., Shaw J.R., Oliver B., Kaufman T.C., Tennessen J.M. Assessment of Chemical Toxicity in Adult Drosophila Melanogaster. J. Vis. Exp. 2023;193:e65029. doi: 10.3791/65029. - DOI - PMC - PubMed
    1. Wambaugh J.F., Bare J.C., Carignan C.C., Dionisio K.L., Dodson R.E., Jolliet O., Liu X., Meyer D.E., Newton S.R., Phillips K.A., et al. New Approach Methodologies for Exposure Science. Curr. Opin. Toxicol. 2019;15:76–92. doi: 10.1016/j.cotox.2019.07.001. - DOI
    1. Peterson E.K., Long H.E. Experimental Protocol for Using Drosophila as an Invertebrate Model System for Toxicity Testing in the Laboratory. J. Vis. Exp. 2018:57450. doi: 10.3791/57450. - DOI - PMC - PubMed

LinkOut - more resources