

Multidimensional Analysis of Physiological Entropy during Self-Paced Marathon Running
- PMID: 39330729
- PMCID: PMC11435500
- DOI: 10.3390/sports12090252
Multidimensional Analysis of Physiological Entropy during Self-Paced Marathon Running
Abstract
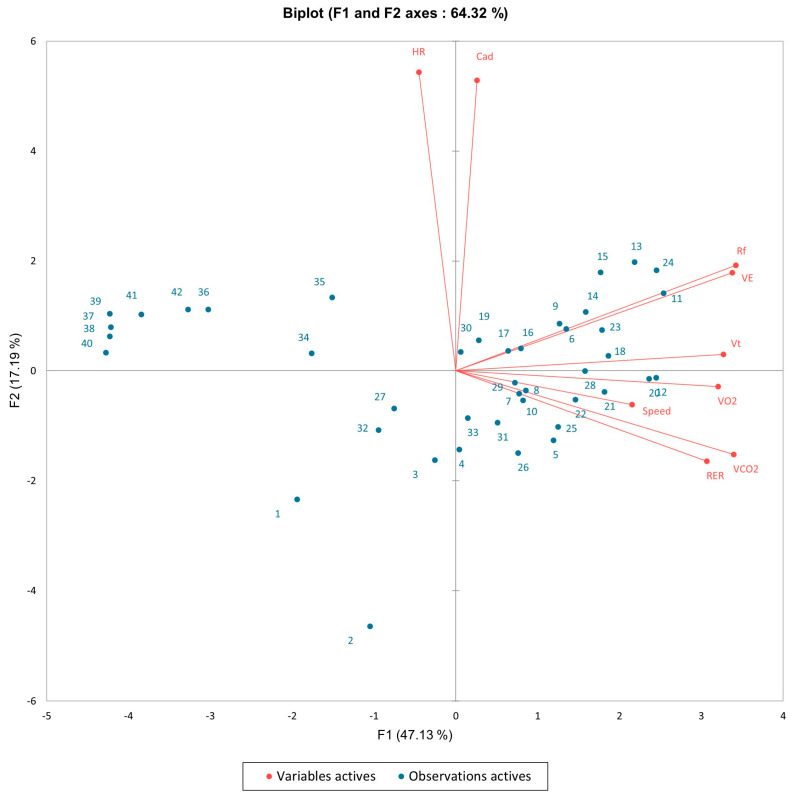
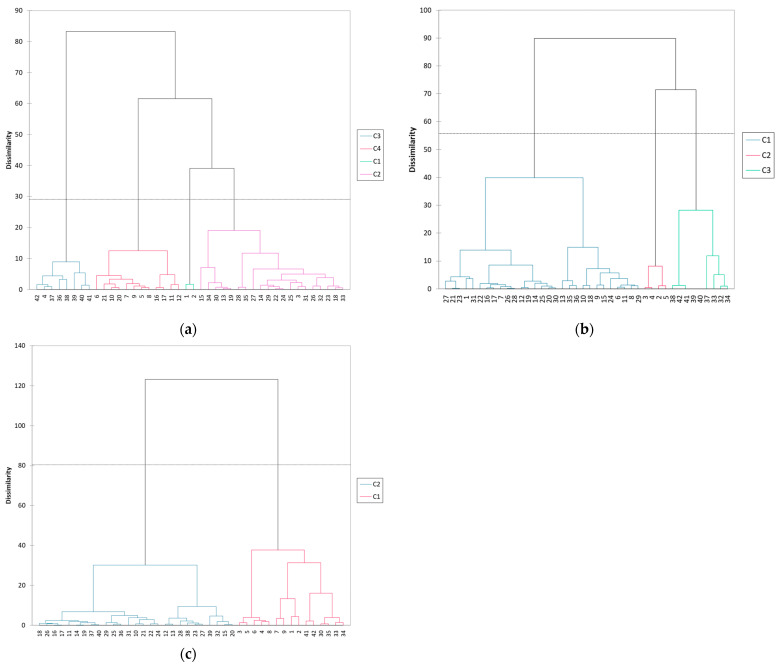
The pacing of a marathon is arguably the most challenging aspect for runners, particularly in avoiding a sudden decline in speed, or what is colloquially termed a "wall", occurring at approximately the 30 km mark. To gain further insight into the potential for optimizing self-paced marathon performance through the coding of comprehensive physiological data, this study investigates the complex physiological responses and pacing strategies during a marathon, with a focus on the application of Shannon entropy and principal component analysis (PCA) to quantify the variability and unpredictability of key cardiorespiratory measures. Nine recreational marathon runners were monitored throughout the marathon race, with continuous measurements of oxygen uptake (V˙O2), carbon dioxide output (V˙CO2), tidal volume (Vt), heart rate, respiratory frequency (Rf), and running speed. The PCA revealed that the entropy variance of V˙O2, V˙CO2, and Vt were captured along the F1 axis, while cadence and heart rate variances were primarily captured along the F2 axis. Notably, when distance and physiological responses were projected simultaneously on the PCA correlation circle, the first 26 km of the race were positioned on the same side of the F1 axis as the metabolic responses, whereas the final kilometers were distributed on the opposite side, indicating a shift in physiological state as fatigue set in. The separation of heart rate and cadence entropy variances from the metabolic parameters suggests that these responses are independent of distance, contrasting with the linear increase in heart rate and decrease in cadence typically observed. Additionally, Agglomerative Hierarchical Clustering further categorized runners' physiological responses, revealing distinct clusters of entropy profiles. The analysis identified two to four classes of responses, representing different phases of the marathon for individual runners, with some clusters clearly distinguishing the beginning, middle, and end of the race. This variability emphasizes the personalized nature of physiological responses and pacing strategies, reinforcing the need for individualized approaches. These findings offer practical applications for optimizing pacing strategies, suggesting that real-time monitoring of entropy could enhance marathon performance by providing insights into a runner's physiological state and helping to prevent the onset of hitting the wall.
Keywords: entropy; fatigue; hitting the wall; marathon running; pacing; performance; physiological responses.
Conflict of interest statement
The authors declare no conflicts of interest.
Figures
Similar articles
-
A Pilot Study Using Entropy for Optimizing Self-Pacing during a Marathon.Entropy (Basel). 2023 Jul 26;25(8):1119. doi: 10.3390/e25081119. Entropy (Basel). 2023. PMID: 37628149 Free PMC article.
-
Oxygen Uptake Measurements and Rate of Perceived Exertion during a Marathon.Int J Environ Res Public Health. 2022 May 9;19(9):5760. doi: 10.3390/ijerph19095760. Int J Environ Res Public Health. 2022. PMID: 35565153 Free PMC article.
-
How recreational marathon runners hit the wall: A large-scale data analysis of late-race pacing collapse in the marathon.PLoS One. 2021 May 19;16(5):e0251513. doi: 10.1371/journal.pone.0251513. eCollection 2021. PLoS One. 2021. PMID: 34010308 Free PMC article.
-
Pacing profiles and tactical behaviors of elite runners.J Sport Health Sci. 2021 Sep;10(5):537-549. doi: 10.1016/j.jshs.2020.06.011. Epub 2020 Jun 26. J Sport Health Sci. 2021. PMID: 32599344 Free PMC article. Review.
-
Applied physiology of marathon running.Sports Med. 1985 Mar-Apr;2(2):83-99. doi: 10.2165/00007256-198502020-00002. Sports Med. 1985. PMID: 3890068 Review.
References
-
- Marathon Statistics Every Runner Should Know. [(accessed on 3 September 2024)]. Available online: https://www.livestrong.com/article/13763749-marathon-statistics/
LinkOut - more resources
Full Text Sources
Miscellaneous
