. 2024 Nov 1;327(5):H1230-H1243.
doi: 10.1152/ajpheart.00392.2024. Epub 2024 Sep 27.

Hypoxia-inducible factor-2α enhances neutrophil survival to promote cardiac injury following myocardial infarction

Affiliations

Hypoxia-inducible factor-2α enhances neutrophil survival to promote cardiac injury following myocardial infarction

Enzo B Piccolo et al. Am J Physiol Heart Circ Physiol. .

Abstract

Heart failure is a major cause of mortality following myocardial infarction. Neutrophils are among the first immune cells to accumulate in the infarcted region. Although beneficial functions of neutrophils in heart injury are now appreciated, neutrophils are also well known for their ability to exacerbate inflammation and promote tissue damage. Myocardial infarction induces hypoxia, where hypoxia-inducible factors (HIFs) are activated and play critical roles in cellular functions. In this context, the role of Hif2α in neutrophils during myocardial infarction is unknown. Here, we demonstrate that neutrophil Hif2α deletion markedly attenuates myocardial infarct size, improves cardiac function, reduces neutrophil survival and tissue accumulation, and correlates with increased macrophage engulfment rates. Mechanistic studies revealed that Hif2α promotes neutrophil survival through binding to hypoxia response element (HRE) in the promoter region of Birc2 to regulate expression of the prosurvival factor, cellular inhibitor of apoptosis protein-1 (cIAP1). Inhibition of cIAP1 in neutrophils using the pharmacological agent, Birinapant resulted in increased cell death, establishing a critical role of cIAP1 downstream of Hif2α in neutrophil survival. Taken together, our data demonstrate a protective effect of Hif2α deletion in neutrophils on cardiac injury outcomes through modulation of neutrophil cell survival.NEW & NOTEWORTHY Hif2α in neutrophils increases infarct size, cardiac dysfunction, and ventricular scar after myocardial infarction. Hif2α in neutrophils supports neutrophil survival via cIAP-1 signaling and delays macrophage engulfment.

Keywords: Hif2α; apoptosis; inflammation; myocardial infarction; neutrophil.


Conflict of interest statement

No conflicts of interest, financial or otherwise, are declared by the authors.

Figures

None
Graphical abstract
Figure 1.
Figure 1.
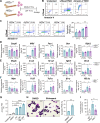
Hif2α expression in polymorphonuclear neutrophils (PMNs) exacerbates infarct size after myocardial infarction (MI). A: schematic representation of the experimental timeline: MI was induced in Hif2α+/+ and Hif2α−/− mice, and hearts were harvested 7 days later. B: representative images of infarct size assessed by triphenyl tetrazolium chloride (TTC) staining in Hif2α+/+ and Hif2α−/− mice. C: quantification of infarct size as a percentage of the left ventricle (LV) area in Hif2α+/+ and Hif2α−/− mice. D: representative images showing the area at risk (AAR) in Hif2α+/+ and Hif2α−/− mice. E: quantification of AAR as a percentage of LV area. F: quantification of infarct size as a percentage of AAR in Hif2α+/+ and Hif2α−/− mice. Data represent means ± SE, and statistical significance for difference between sexes [males (black) and females (gray)] was determined using a t test. *P < 0.05 and **P < 0.01; sample sizes, n = 9 animals per group. Images were created with a licensed version of BioRender.com.
Figure 2.
Figure 2.
Hif2α promotes polymorphonuclear neutrophils (PMNs) accumulation in the heart post-myocardial infarction (MI). A: experimental timeline outlining Hif2α+/+ and Hif2α−/− mice subjected to MI, and hearts were collected at baseline (no MI), 1 day post-MI (1DpMI), 3 days post-MI (3DpMI), and 5 days post-MI (5DpMI) for flow cytometry or microscopy analyses (IF). B: gating strategy for identifying infiltrating PMNs in the myocardium post-MI. PMNs were classified as CD45+ CD11b+ Ly6G-Reporter+ cells. C: flow chart and quantification of infiltrated PMNs in the myocardium at baseline and 1, 3, and 5 days post-MI in Hif2α+/+ and Hif2α−/− mice. D: schematic representation of heart sections used for immunofluorescence (IF) microscopy analysis. Hearts sections were taken at the ligation site (“Ligation”), 1× below the ligation (“1× Below”), and 2× below the ligation (“2× Below”). E–H: representative IF microscopy images and quantification showing PMN infiltration in the myocardium at baseline (E), 1DpMI (F), 3DpMI (G), and 5DpMI (H) in Hif2α+/+ and Hif2α−/− mice. White bar = 700 µm. Sample sizes for flow cytometry analysis: no MI (n = 3 animals per group), 1DpMI (n = 4 animals per group), 3DpMI (Hif2α+/+, n = 10 animals; Hif2α−/−, n = 7 animals ), and 5DpMI (Hif2α+/+, n = 5 animals; Hif2α−/−, n = 3 animals). Sample sizes for microscopy analysis: 1DpMI (n = 4 animals per group), 3DpMI (n = 4 animals per group), and 5DpMI (Hif2α+/+, n = 3 animals; Hif2α−/−, n = 5 animals). Data represent means ± SE. Statistical significance was determined using a two-way ANOVA with Bonferroni’s multiple comparison posttest. Images were created with a licensed version of BioRender.com.
Figure 3.
Figure 3.
Hif2α extends the lifespan of heart infiltrated polymorphonuclear neutrophils (PMNs) postmyocardial infarction (MI). A: schematic representation of the experimental timeline: Hif2α+/+ and Hif2α−/− mice were injected with saline or 5-ethynyl-2′-deoxyuridine (EdU). After 4 days, left anterior descending (LAD) coronary artery ligation was performed, 3 days later, hearts were collected for flow cytometric analysis. B, D, and F: gating strategy to identify and quantify PMNs (CD45+ CD11b+ Ly6G+) in the bone marrow (BM; B), blood (D), and heart (F) at baseline (no MI) and 3 days post-MI. C, E, and G: gating strategy to assess the proportion of EdU+ PMNs (CD45+ CD11b+ Ly6G+ EdU+) in the BM (C), blood (E), and heart (G) at baseline and 3 days post-MI. Data represent means ± SE. Statistical significance was determined using a t test. *P < 0.05 and **P < 0.01; sample size: n = 5 animals per group. Images were created with a licensed version of BioRender.com.
Figure 4.
Figure 4.
Hif2α suppresses apoptosis of cardiac polymorphonuclear neutrophils (PMNs) post myocardial infarction (MI). A: experimental timeline showing that Hif2α+/+ and Hif2α−/− mice were subjected to MI, and hearts were collected at baseline (no MI), 1 day post-MI (1DpMI), 3 days post-MI (3DpMI), and 5 days post-MI (5DpMI) for flow cytometry. B: gating strategy for identifying apoptotic infiltrating neutrophils post-MI. Apoptotic PMNs were defined as (CD45+/CD11b+/Ly6G-Reporter+/L/Dead/annexin-V+) cells. C–F: flow cytometry analysis of apoptotic PMNs as a percentage of total PMNs from Hif2α+/+ and Hif2α−/− mice. Data shown are from no MI (C), 1 day post-MI (1DpMI; D), 3 days post-MI (3DpMI; E), and 5 days post-MI (5DpMI; F). Sample sizes no MI (n = 3 animals per group), 1DpMI (n = 4 animals per group), 3DpMI (n = 10 animals for Hif2α+/+, n = 7 animals for Hif2α−/−), and 5DpMI (n = 5 animals for Hif2α+/+, n = 3 animals for Hif2α−/−). Data represent means ± SE. Statistical significance was determined by using a t test. *P < 0.05. Images were created with a licensed version of BioRender.com.
Figure 5.
Figure 5.
Hif2α in PMNs regulates cIAP1 expression in a hypoxia-dependent manner. A: schematic representation of the experimental timeline. Bone marrow-derived polymorphonuclear neutrophils (PMNs) from Hif2α+/+ and Hif2α−/− mice were cultured for 24 h under normoxic conditions (21% oxygen) or in a proapoptotic condition (1% oxygen, 20 ng/mL LPS). B: gating strategy identifying apoptotic PMNs in vitro after 24 h, including unstained controls and fluorescence minus one (FMO) control. C: flow cytometry analysis and quantification of apoptotic PMNs (CD45+/CD11b+/Ly6G-Reporter+/L/Dead/annexin-V+) in vitro after 24 h. Sample size: n = 5 animals per group. D–F: quantification of transcript levels in PMNs cultured for 24 h in normoxia or in a proapoptotic condition: proapoptotic transcripts, Casp8, Mlkl, Fas-L, Bax, and Ripk1 (D); prosurvival transcripts, Mapk, G-csf, M-csf, Tgf-β, and Birc2 (E); and proinflammatory transcripts, Mpo, Il-1ß, Tnfα, Ifnγ, and Hif1-α (F), sample size, n = 5 animals per group. G: quantification of neutrophil apoptosis (CD45+ CD11b+ Ly6G-Reporter+ L/Dead annexin-V+) induced by the pharmacological inhibitor of cIAP1, Birinapant, after 24 h under normoxic conditions; sample size, n = 3 animals. H: morphological quantification of apoptotic PMNs 24 h after treatment with DMSO or Birinapant (600 nM) under normoxic condition; sample size: n = 3 animals. I: Hif2α chromatin immunoprecipitation and Birc2 qPCR performed on PMNs from bone marrow, with fold change calculated between cells exposed to normoxia versus hypoxia; sample size, n = 6 animals per groups. Data represent means ± SE. Statistical significance is indicated by *P < 0.05 and **P < 0.01; ns, not significant. Images were created with a licensed version of BioRender.com.
Figure 6.
Figure 6.
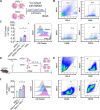
Hif2α in polymorphonuclear neutrophils (PMNs) regulates macrophages engulfed rate. A: schematic representation of the in vitro efferocytosis assay using macrophages derived from bone marrow coculture with apoptotic PMN (previously labeled with CellTracker) isolated from Hif2α+/+ or Hif2α mice. B: gating strategy to identify macrophages derived from bone marrow (CD45+ F4/80+ CD11b+). C: quantification and histogram of the CellTracker median fluorescence intensity (MFI) detected in the macrophage’s population after 4 h of coculture; sample size, n = 5 animals per group. D: schematic representation of the ex vivo efferocytosis assay using thioglycollate elicited peritoneal macrophages exposed with apoptotic PMN (previously labeled with CellTracker) isolated from Hif2α+/+ or Hif2α mice for 4 h. E: gating strategy to identify thioglycollate elicited peritoneal macrophages (CD45+ F4/80+ CD115b+ CD64+). F: quantification and histogram of the CellTracker MFI detected in the macrophage population after 4 h of coculture; sample size, n = 5 animals per group. Data represent means ± SE. Statistical significance is indicated by *P < 0.05; ns, not significant. Images were created with a licensed version of BioRender.com.
Figure 7.
Figure 7.
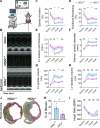
Hif2α in polymorphonuclear neutrophils (PMNs) worsens cardiac function and scar formation postmyocardial infarction (MI). A: schematic representation of the echocardiography procedure. B: representative M-mode echocardiographic images taken 4 wk post-MI from sham, Hif2α+/+, and Hif2α−/− animals. Vertical red line indicates diastole, vertical green line indicates systole, and horizontal blue lines delineate the anterior and posterior wall of the left ventricle (LV). C–H: echocardiographic analysis of left ventricular function and structure: ejection fraction (%; C), fractional shortening (%; D), LV anterior wall thickness (mm; E), LV internal systolic diameter (mm; F), LV systolic volume (μL; G), LV diastolic volume (μL; H), and heart rate (beats/min; I). Solid lines represent average, and intervals between dotted lines represent means ± SE. Statistical significance is indicated by *P < 0.05 and **P < 0.01, as determined by a multiple t test; sample sizes, n = 10 animals per group. J: representative images of LV sections stained with Sirius red to assess collagen deposition post-MI in Hif2α+/+ and Hif2α−/− animals. K: quantification of the percentage of fibrosis in the LV. Data are presented as means ± SE. Statistical significance is indicated by *P < 0.05, as determined by a t test; sample sizes, n = 6 animals for Hif2α+/+ and n = 5 animals for Hif2α−/−. Images were created with a licensed version of BioRender.com.

Comment in

  • Hypoxic neutrophils enflame the infarcted heart.
    Stafford P, Vagnozzi RJ. Stafford P, et al. Am J Physiol Heart Circ Physiol. 2024 Nov 1;327(5):H1303-H1305. doi: 10.1152/ajpheart.00701.2024. Epub 2024 Oct 25. Am J Physiol Heart Circ Physiol. 2024. PMID: 39453434 Free PMC article. No abstract available.

References

    1. Jhund PS, McMurray JJ. Heart failure after acute myocardial infarction: a lost battle in the war on heart failure? Circulation 118: 2019–2021, 2008. doi: 10.1161/CIRCULATIONAHA.108.813493. - DOI - PubMed
    1. Ahmad FB, Cisewski JA, Xu J, Anderson RN. Provisional mortality data - United States, 2022. MMWR Morb Mortal Wkly Rep 72: 488–492, 2023. doi: 10.15585/mmwr.mm7218a3. - DOI - PMC - PubMed
    1. Jung SH, Hwang BH, Shin S, Park EH, Park SH, Kim CW, Kim E, Choo E, Choi IJ, Swirski FK, Chang K, Chung YJ. Spatiotemporal dynamics of macrophage heterogeneity and a potential function of Trem2hi macrophages in infarcted hearts. Nat Commun 13: 4580, 2022. doi: 10.1038/s41467-022-32284-2. - DOI - PMC - PubMed
    1. Mouton AJ, DeLeon-Pennell KY, Rivera Gonzalez OJ, Flynn ER, Freeman TC, Saucerman JJ, Garrett MR, Ma Y, Harmancey R, Lindsey ML. Mapping macrophage polarization over the myocardial infarction time continuum. Basic Res Cardiol 113: 26, 2018. doi: 10.1007/s00395-018-0686-x. - DOI - PMC - PubMed
    1. McDonald B, Pittman K, Menezes GB, Hirota SA, Slaba I, Waterhouse CC, Beck PL, Muruve DA, Kubes P. Intravascular danger signals guide neutrophils to sites of sterile inflammation. Science 330: 362–366, 2010. [Erratum in Science 331: 1517, 2011]. doi: 10.1126/science.1195491. - DOI - PubMed

MeSH terms

Substances