

Risk and Protective Factors for Preterm Birth Among Racial, Ethnic, and Socioeconomic Groups in California
- PMID: 39331393
- PMCID: PMC11437386
- DOI: 10.1001/jamanetworkopen.2024.35887
Risk and Protective Factors for Preterm Birth Among Racial, Ethnic, and Socioeconomic Groups in California
Abstract
Importance: Preterm birth (PTB) (gestational age <37 weeks) is a major cause of infant mortality and morbidity in the US and is marked by racial and ethnic and socioeconomic inequities. Further research is needed to elucidate the association of risk and protective factors with trends in PTB rates and with related inequities.
Objective: To describe the association of PTB rates with inequities as well as related risk and protective factors over the past decade in a US population-based cohort.
Design, setting, and participants: This retrospective cohort study of singleton live births in California from January 1, 2011, to December 31, 2022, was conducted using vital statistics records and hospital records. The cohort included births with a gestational age of 22 to 44 weeks.
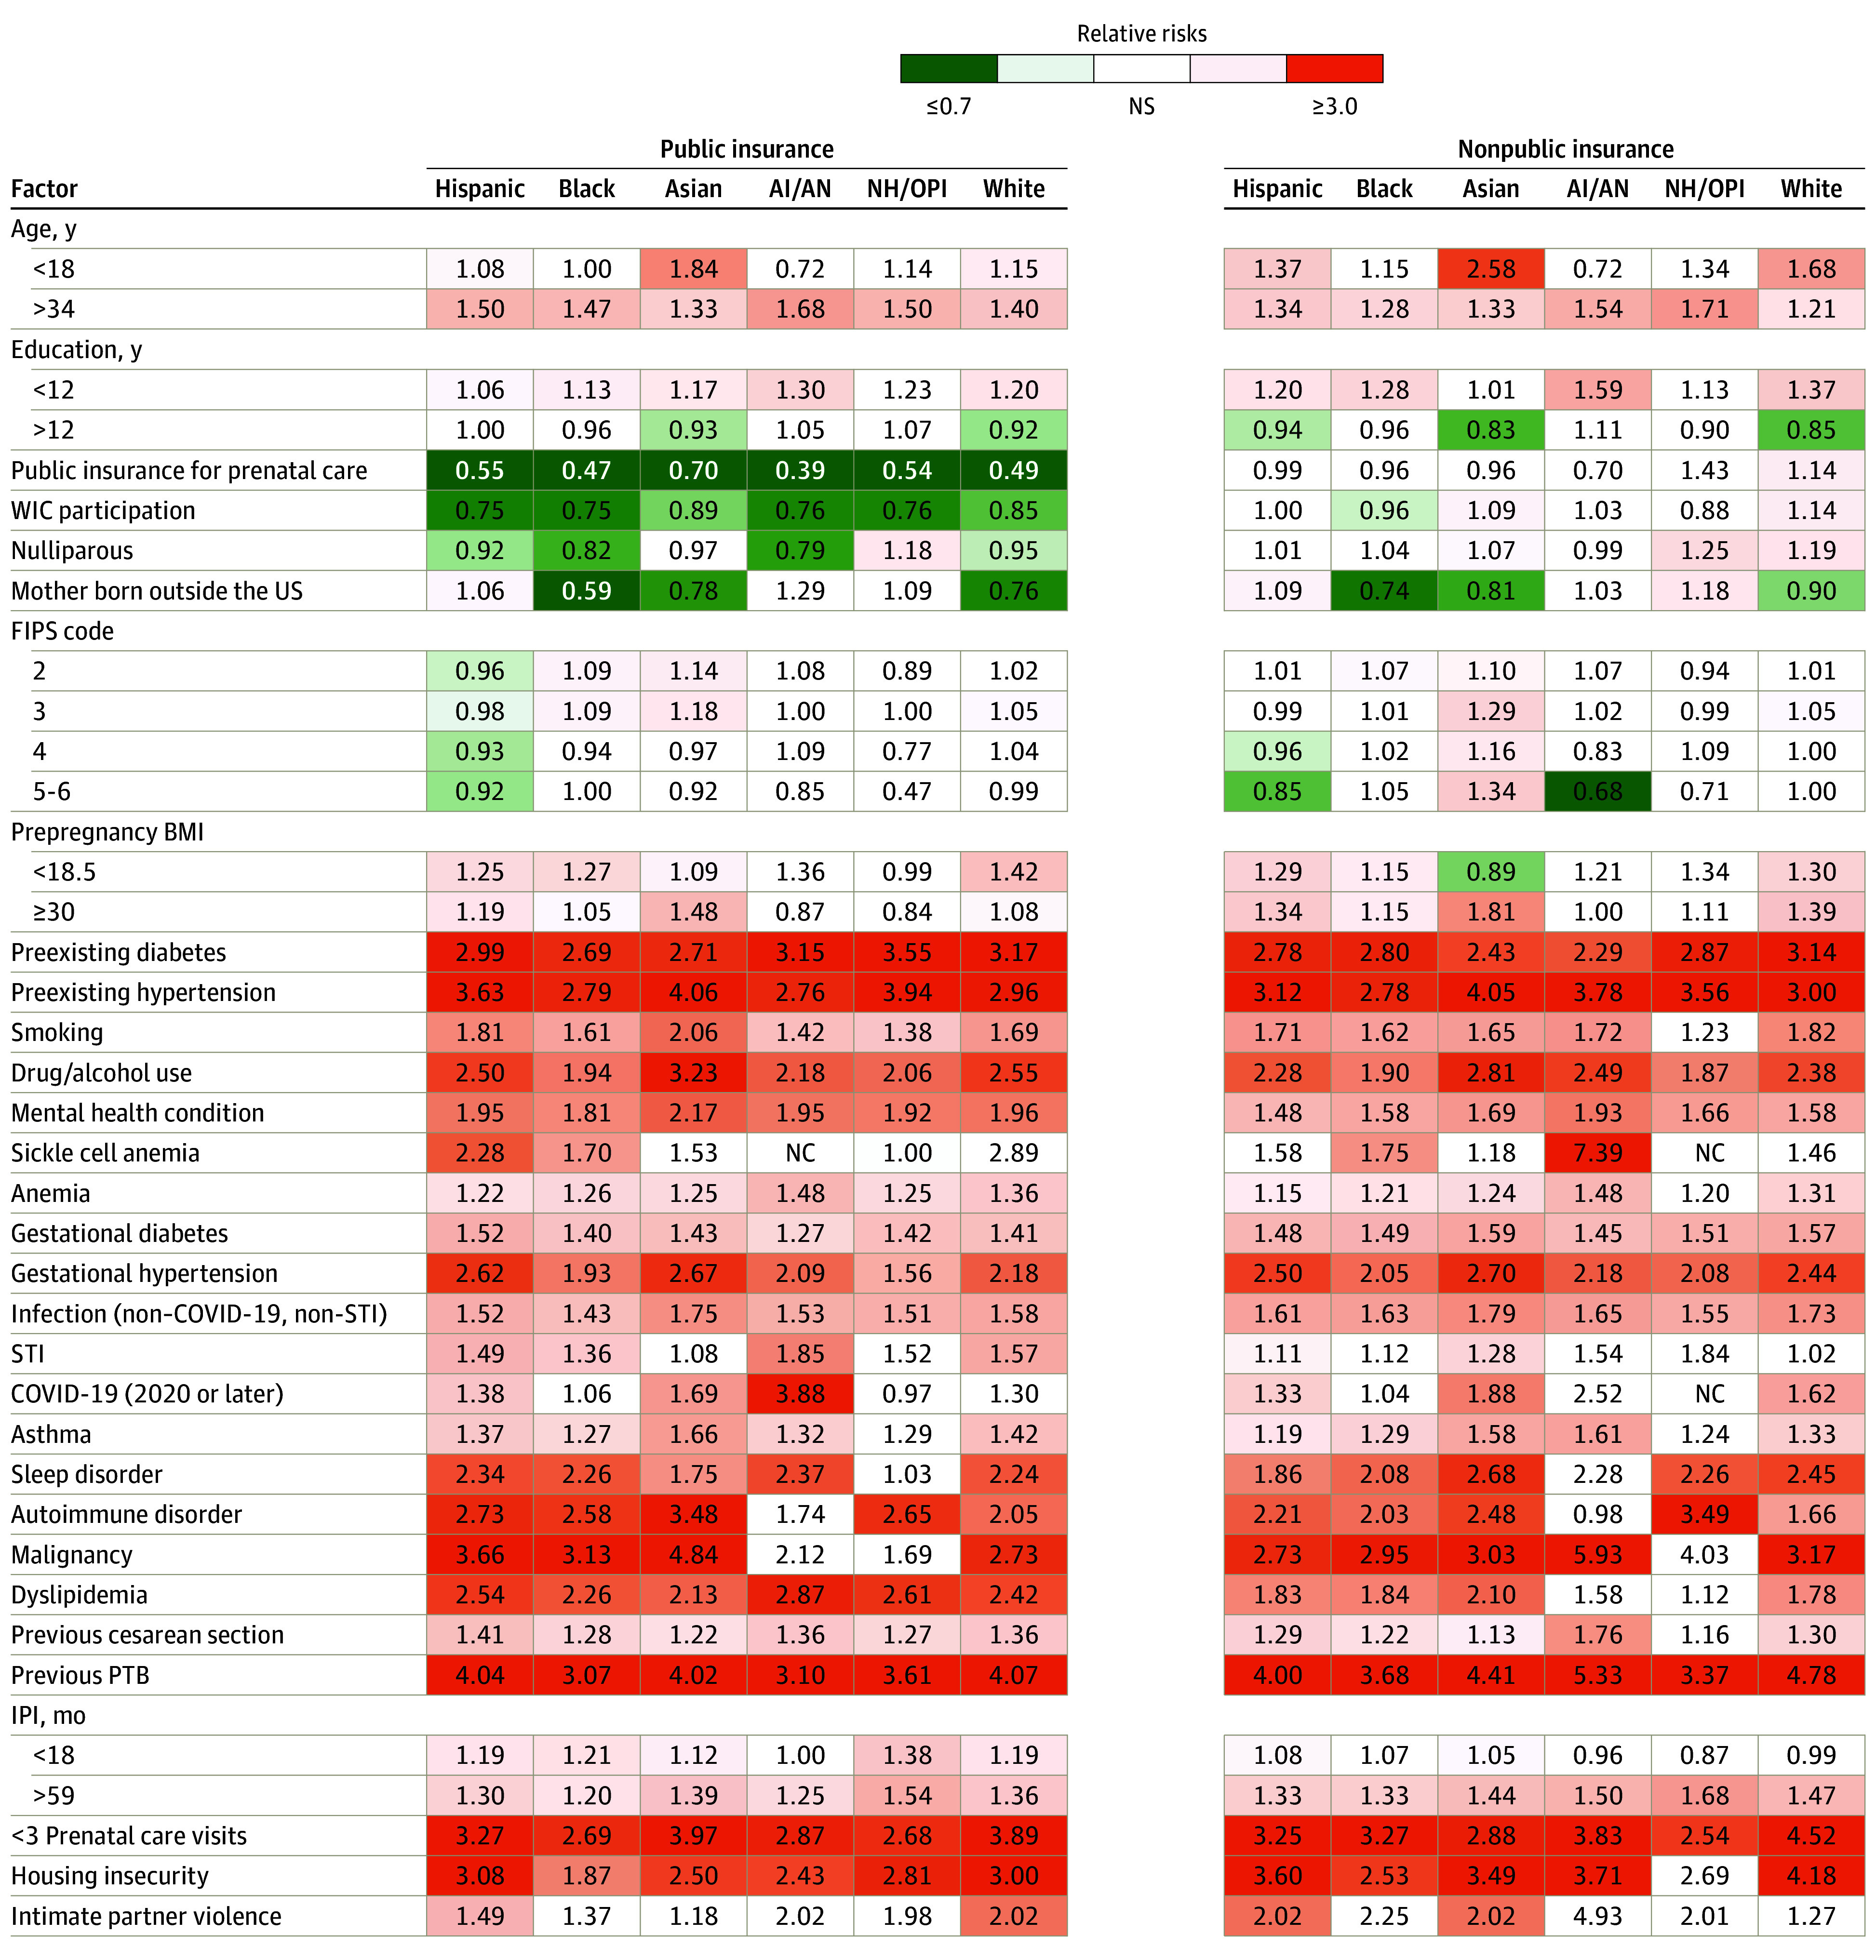
Main outcomes and measures: Preterm birth rates by racial and ethnic group and by public and nonpublic insurance (considered as a proxy for socioeconomic status) were studied across years. Log-linear regression (relative risks with 95% CIs) was used to evaluate risk and protective factors within groups. Associations of PTB rates with risk and protective factors were assessed.
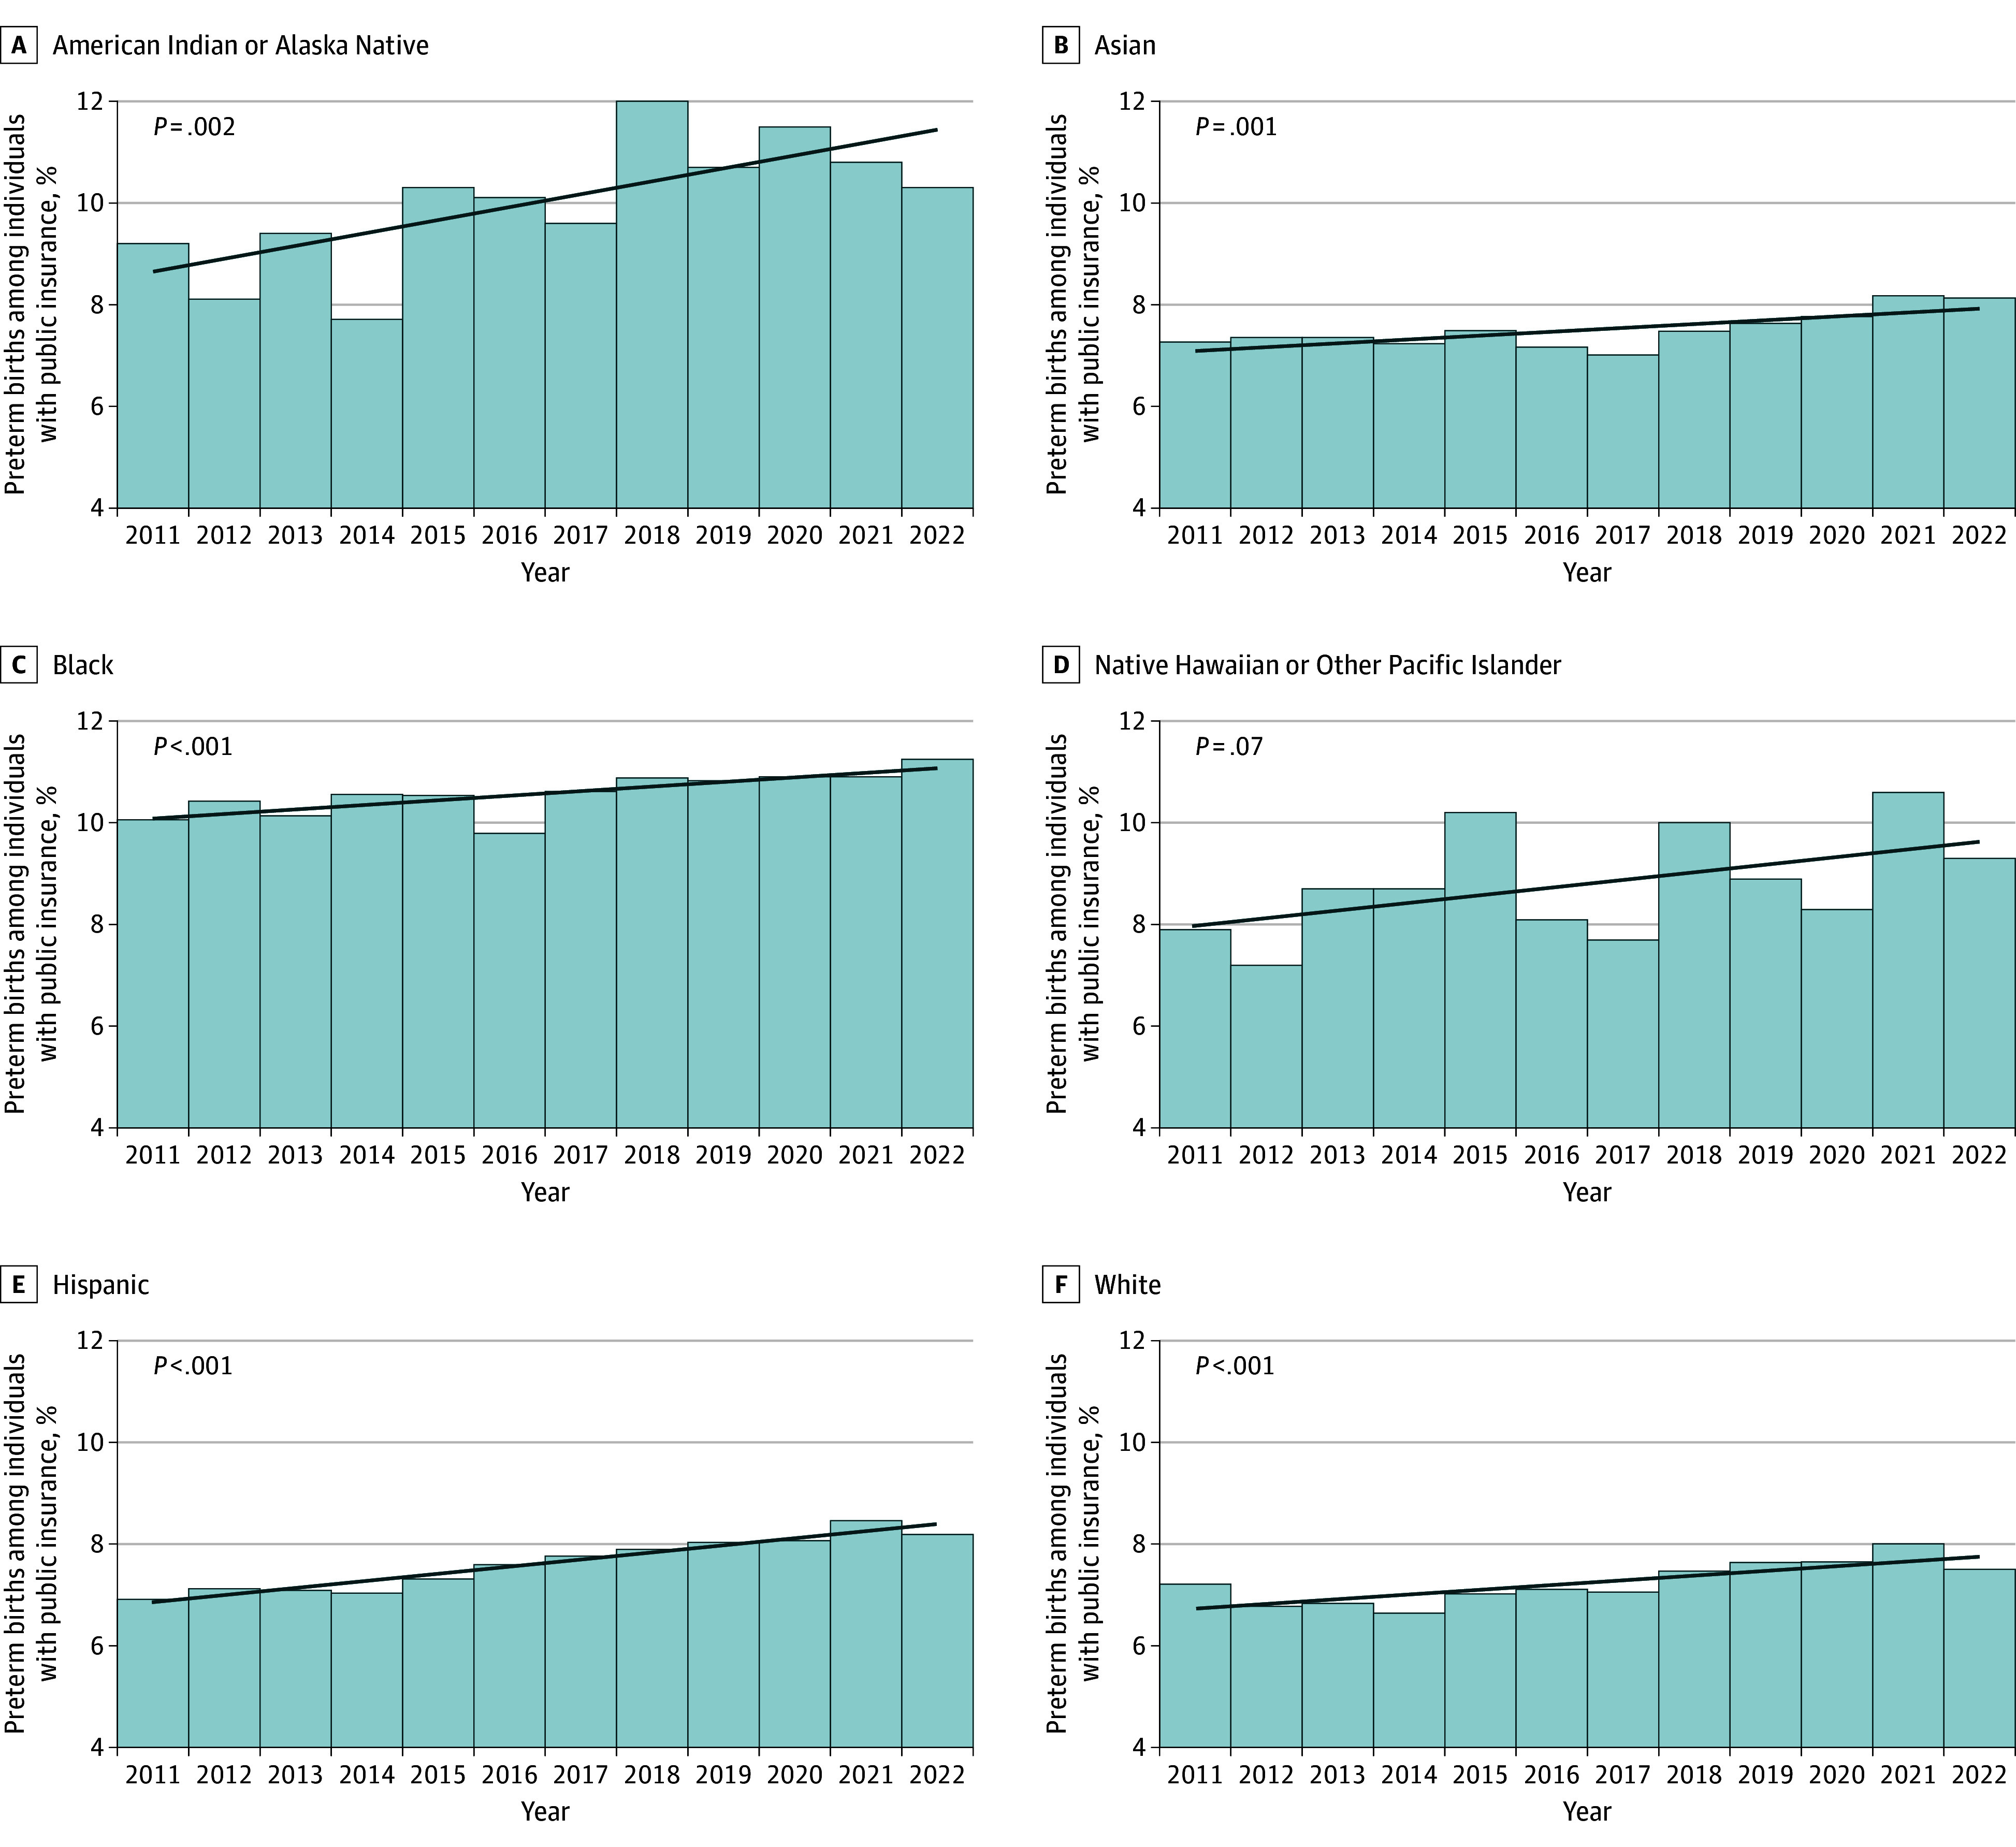
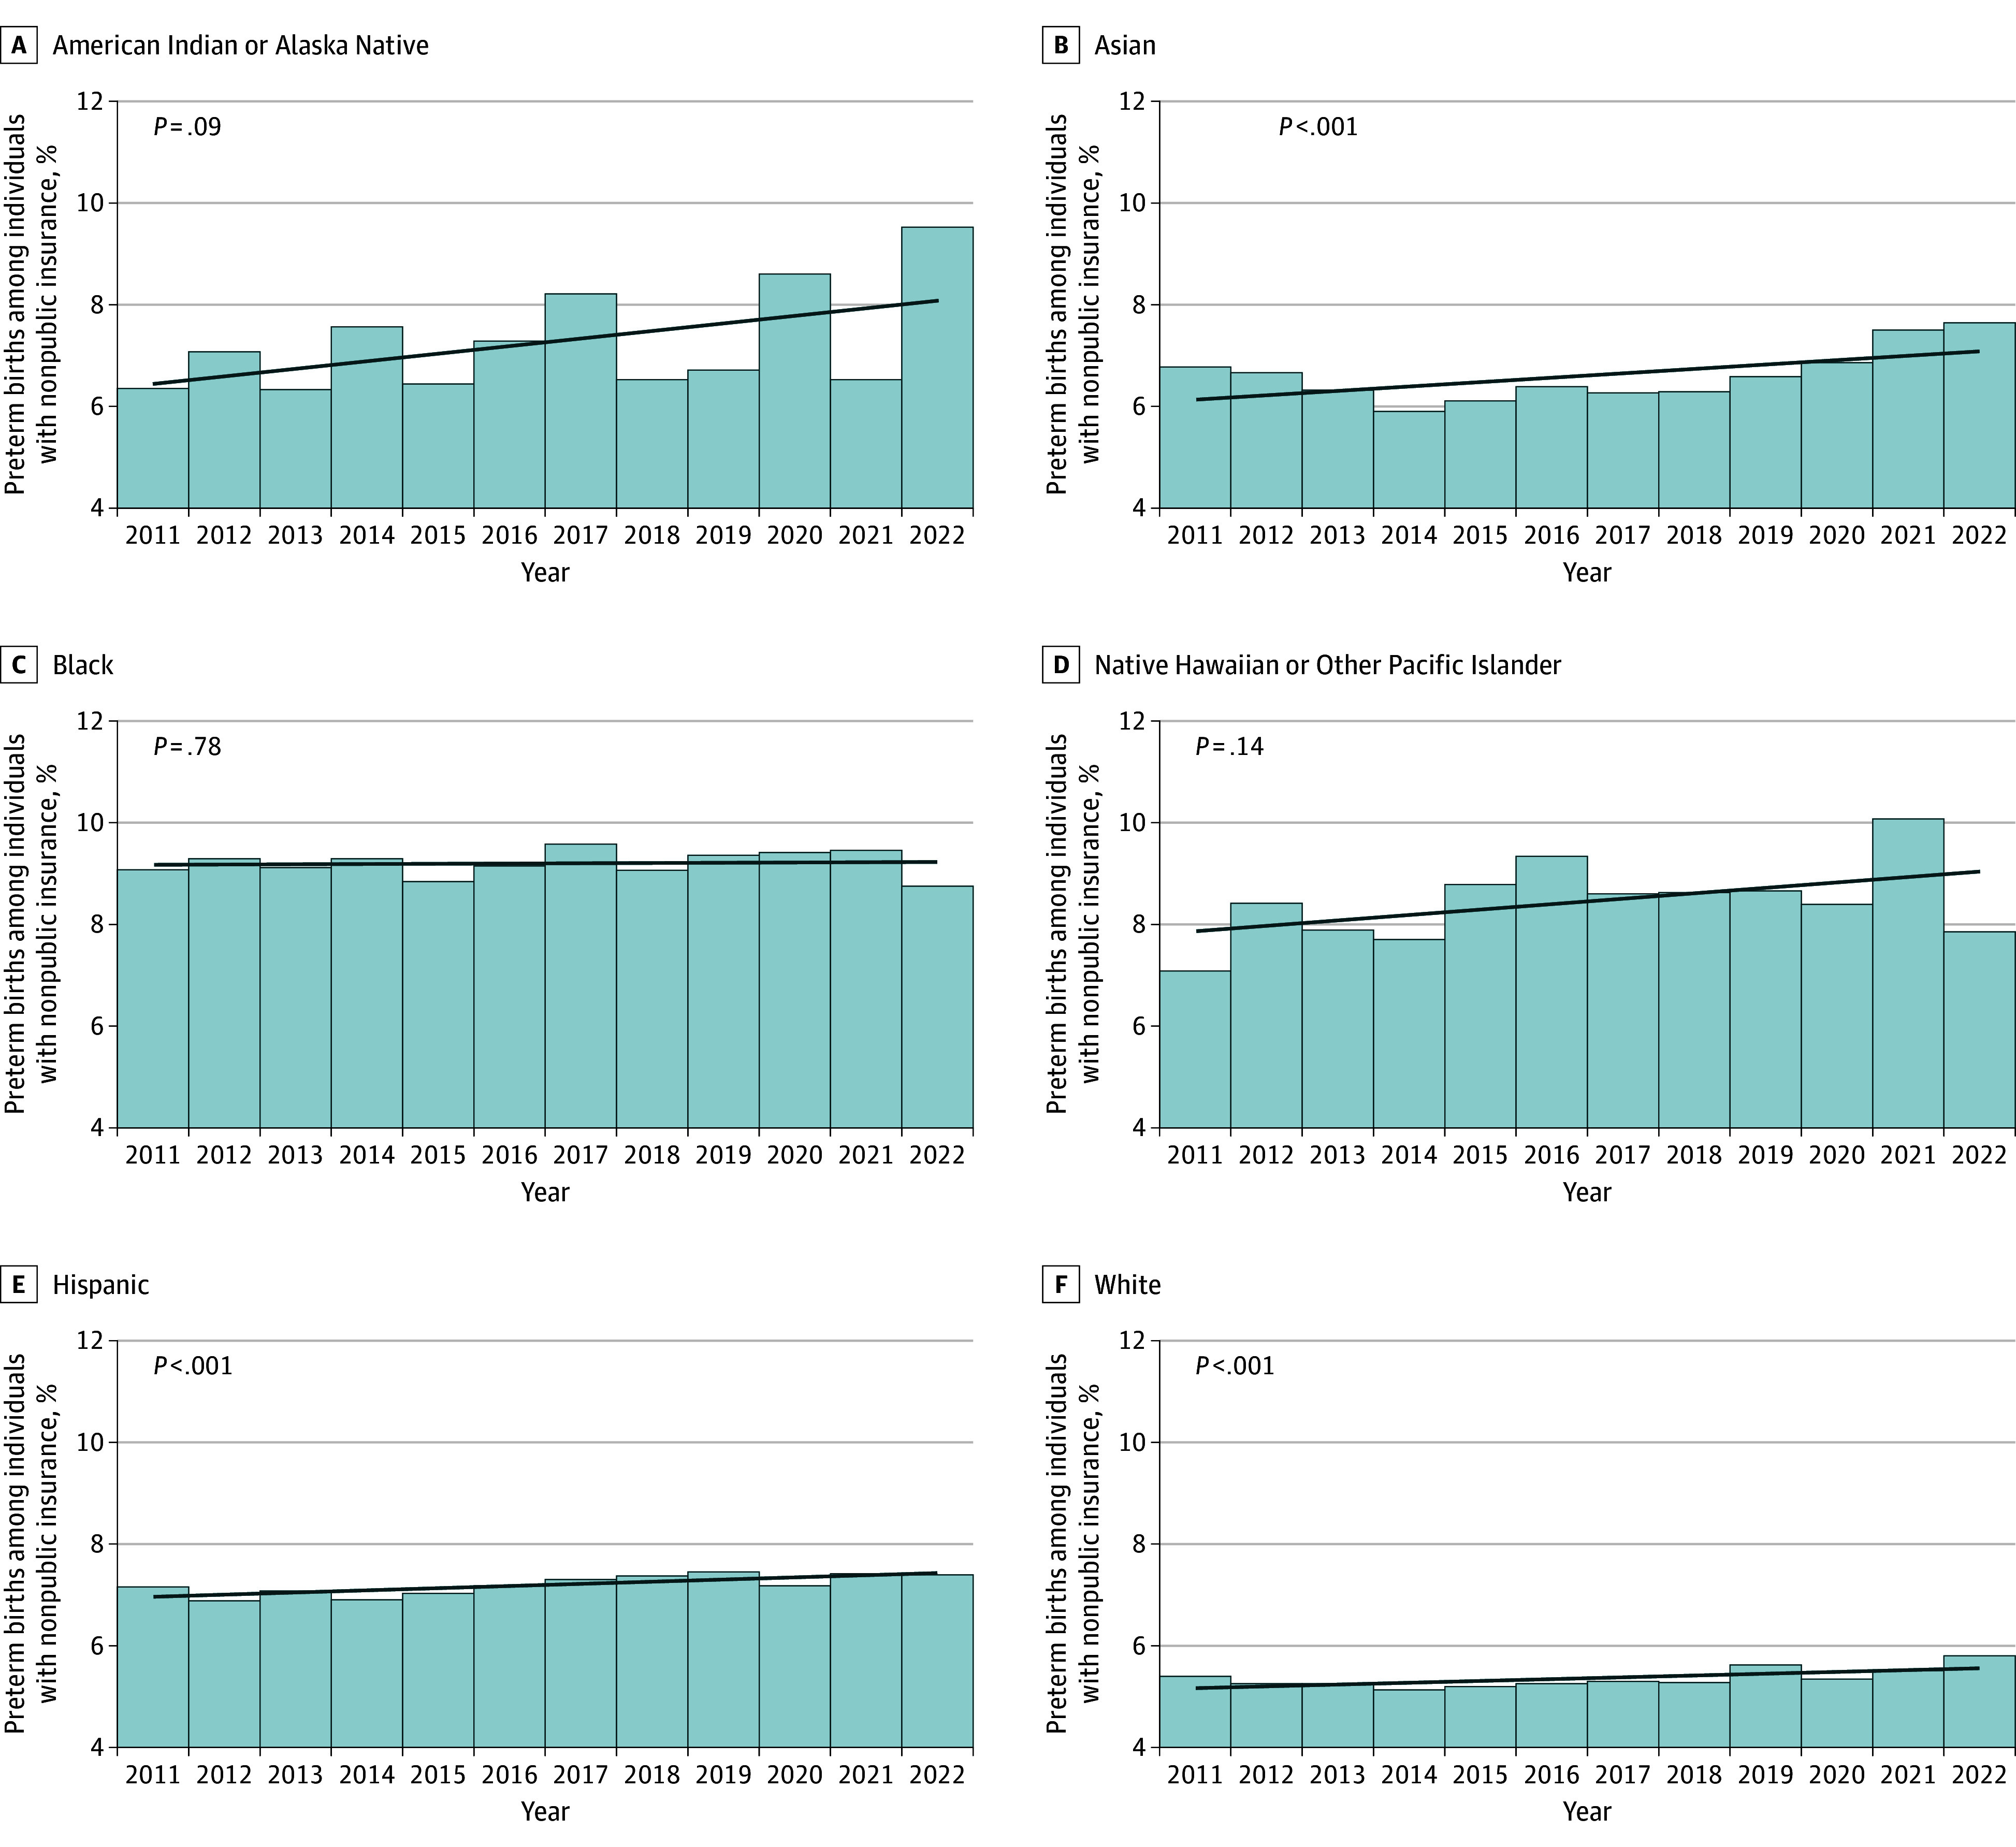
Results: This study included 5 431 018 singleton live births to individuals who identified as American Indian or Alaska Native (0.3%), Asian (14.2%), Black (4.9%), Hispanic (47.8%), or White (27.0%). A total of 43.1% of births were to individuals with public health insurance. From 2011 to 2022, the overall PTB rate increased from 6.8% to 7.5% (change [SE], 10.6% [0.6%]; z score of 18.5; P < .001). Differences in PTB rates and associated changes were observed for racial and ethnic groups and insurance groups. For example, 2022 PTB rates ranged from 5.8% among White individuals with nonpublic insurance to 11.3% among Black individuals with public health insurance. From 2011 to 2022, PTB rates decreased from 9.1% to 8.8% (change [SE], -3.5% [4.2]; z score of -0.8; P = .42) among Black individuals with nonpublic insurance, whereas they increased from 6.4% to 9.5% (change [SE], 49.8% [16.0%]; z score of 3.1; P = .002) among American Indian or Alaska Native individuals with nonpublic insurance. Increases in some risk factors (eg, preexisting diabetes, sexually transmitted infections, mental health conditions) were observed in most groups, and decreases in some protective factors (eg, participation in the California Women, Infants, and Children program) (P for trend < .001 from 2011 to 2021) were observed mostly in low-income groups.
Conclusions and relevance: In this cohort study of singleton live births in California, PTB rates increased in many groups. Persistent racial and ethnic and socioeconomic inequities were also observed. Changes in risk and protective factors provided clues to patterns of PTB. These data point to an urgent need to address factors associated with PTB at both the individual and population levels.
Conflict of interest statement
Figures
Comment in
-
Preterm Birth Inequity-A Call for a Societal Movement.JAMA Netw Open. 2024 Sep 3;7(9):e2435855. doi: 10.1001/jamanetworkopen.2024.35855. JAMA Netw Open. 2024. PMID: 39331400 Free PMC article. No abstract available.
References
-
- Percentage of births born preterm by state. Centers for Disease Control and Prevention National Center for Health Statistics . Accessed May 22, 2024. https://www.cdc.gov/nchs/pressroom/sosmap/preterm_births/preterm.htm
-
- Martin JA, Osterman MJK. Shifts in the distribution of births by gestational age: United States, 2014-2022. Natl Vital Stat Rep. 2024;73(1):1-11. - PubMed
-
- Martin JA, Hamilton BE, Osterman MJK. Births in the United States, 2022. NCHS Data Brief. 2023;(477):1-8. - PubMed
Publication types
MeSH terms
Grants and funding
LinkOut - more resources
Full Text Sources
Miscellaneous
