. 2024 Sep 27:13:RP97604.
doi: 10.7554/eLife.97604.

Local volume concentration, packing domains, and scaling properties of chromatin

Affiliations

Local volume concentration, packing domains, and scaling properties of chromatin

Marcelo A Carignano et al. Elife. .

Abstract

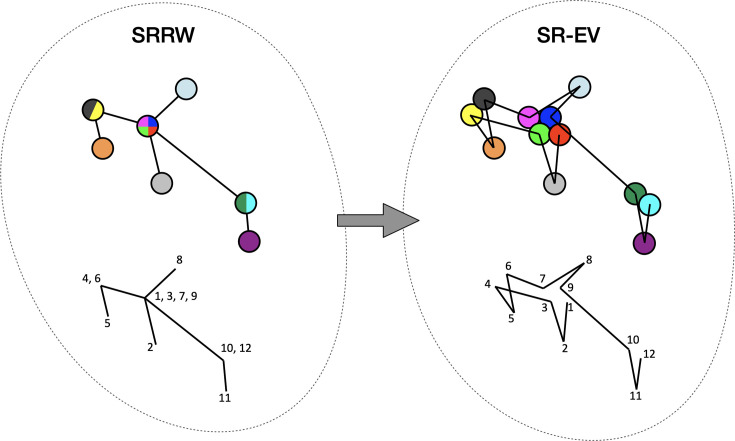
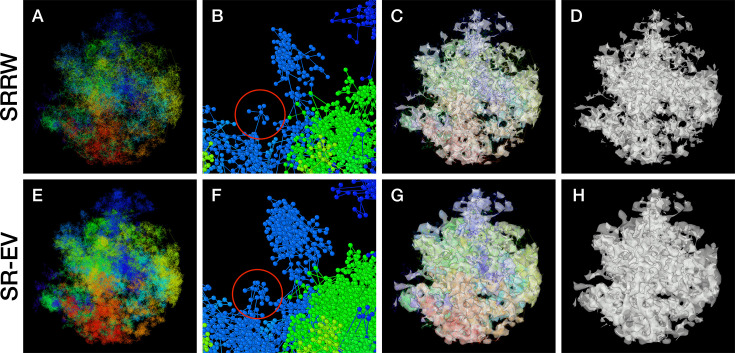
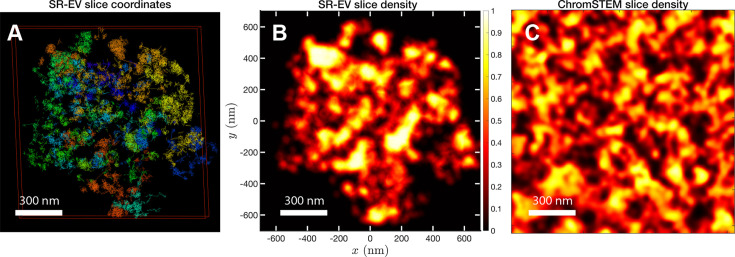
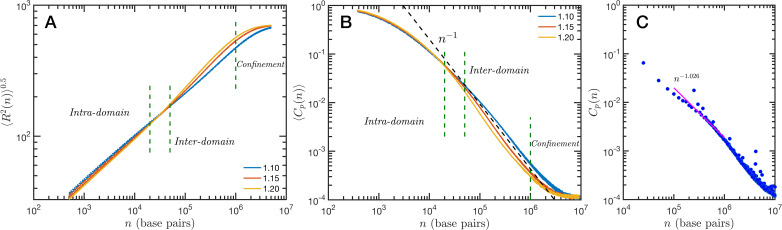
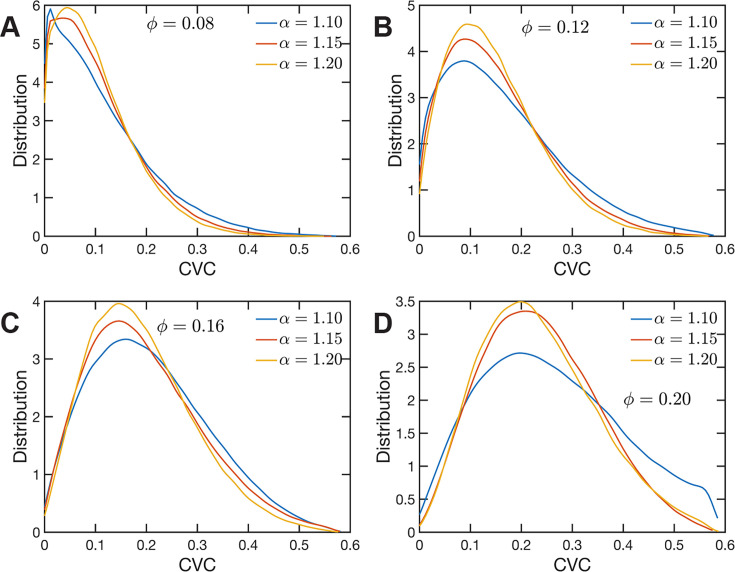
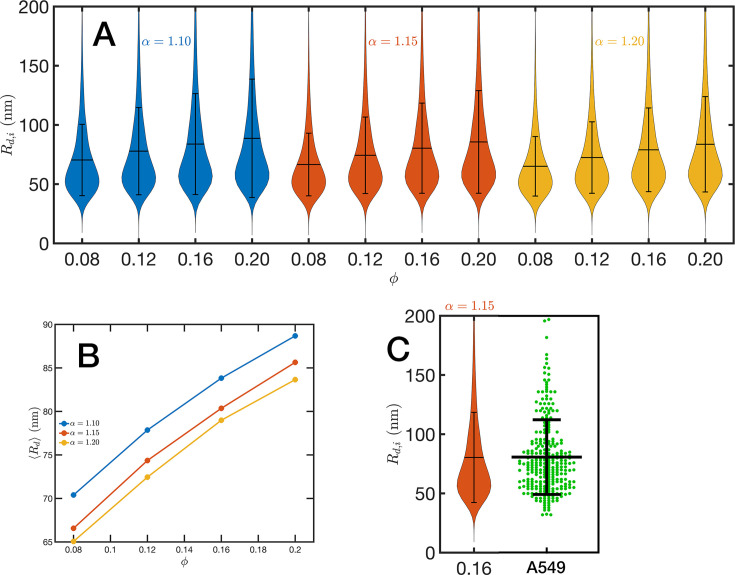
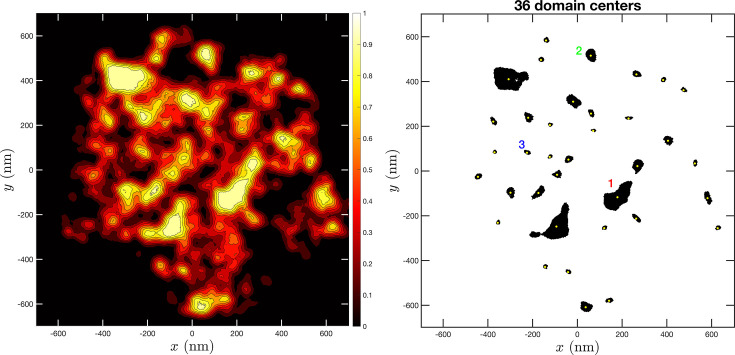
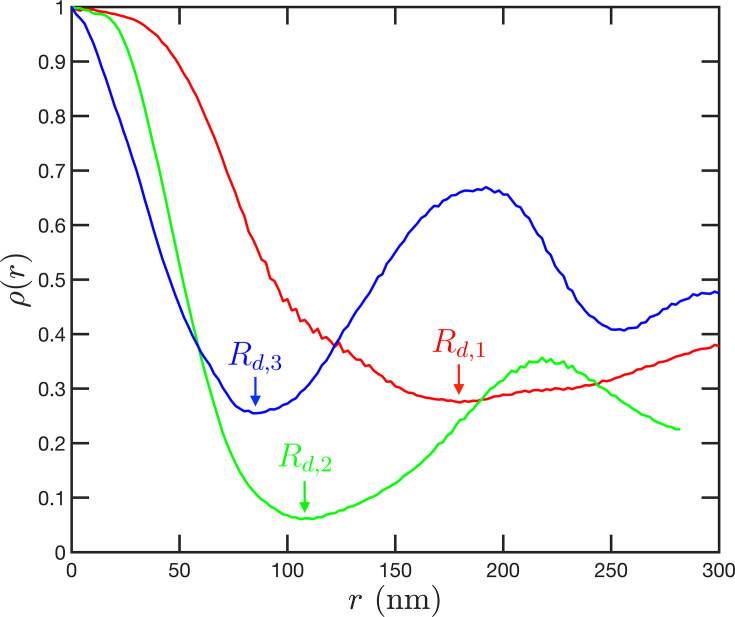
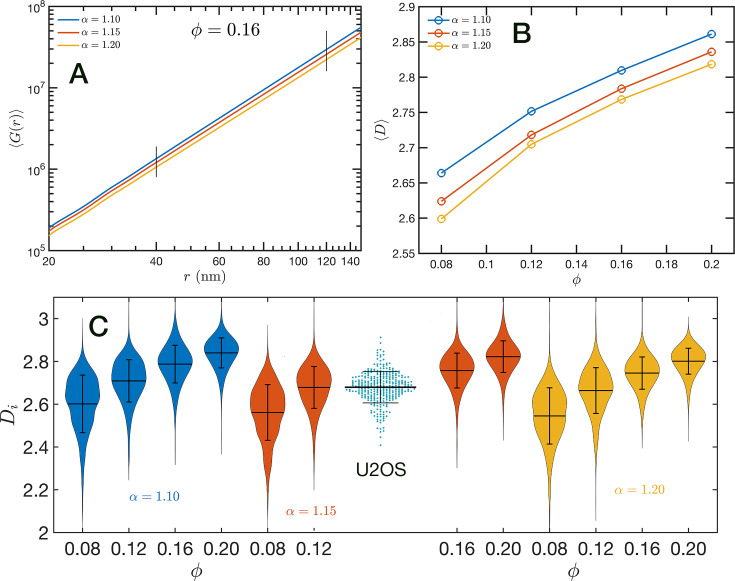
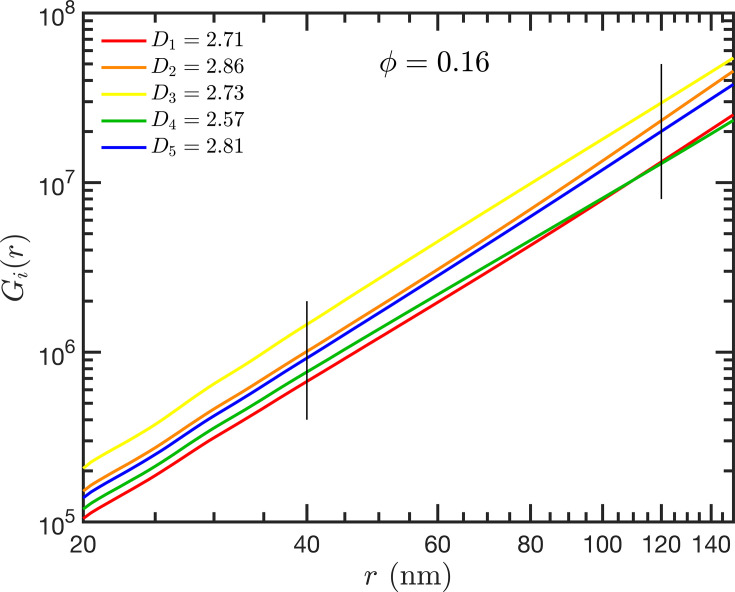
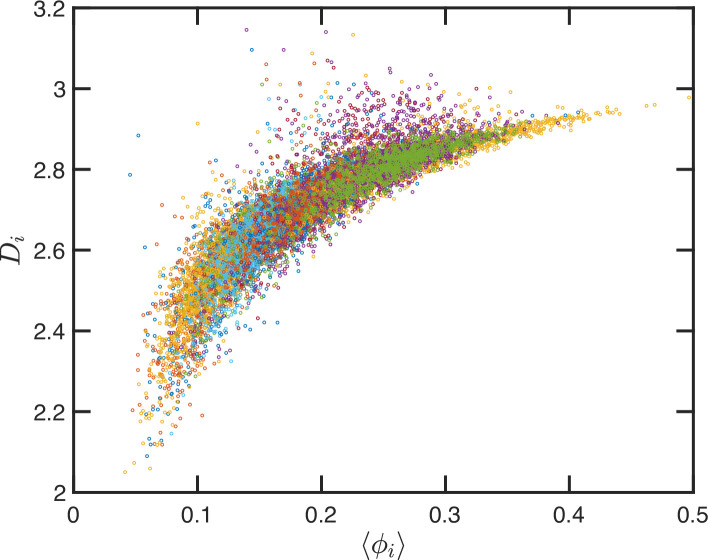
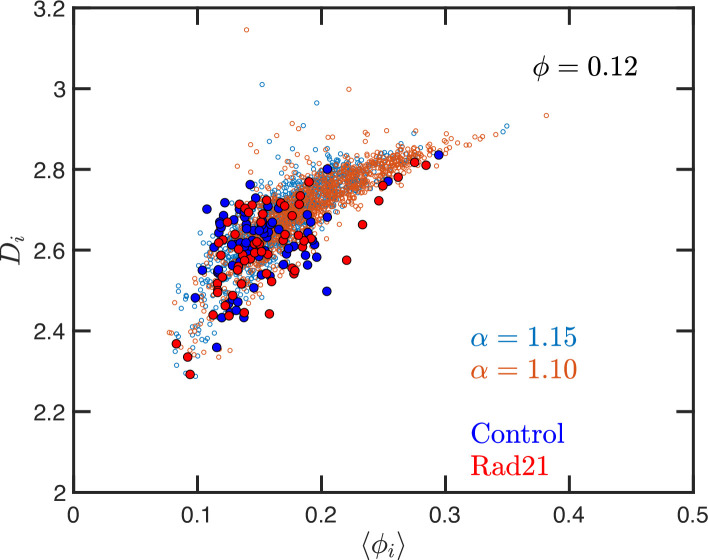
We propose the Self Returning Excluded Volume (SR-EV) model for the structure of chromatin based on stochastic rules and physical interactions. The SR-EV rules of return generate conformationally defined domains observed by single-cell imaging techniques. From nucleosome to chromosome scales, the model captures the overall chromatin organization as a corrugated system, with dense and dilute regions alternating in a manner that resembles the mixing of two disordered bi-continuous phases. This particular organizational topology is a consequence of the multiplicity of interactions and processes occurring in the nuclei, and mimicked by the proposed return rules. Single configuration properties and ensemble averages show a robust agreement between theoretical and experimental results including chromatin volume concentration, contact probability, packing domain identification and size characterization, and packing scaling behavior. Model and experimental results suggest that there is an inherent chromatin organization regardless of the cell character and resistant to an external forcing such as RAD21 degradation.

Keywords: SR-EV; chromatin; none; physics of living systems; theory.


Conflict of interest statement

MC, MK, LA, VA, WL, EP, RN, VB, IS No competing interests declared

Figures

Figure 1.
Figure 1.. Schematic representation of the conversion process from Self Returning Random Walk (SRRW) to Self Returning Excluded Volume (SR-EV).
The SRRW configurational motif hides the overlap of several beads in a molecule that has the structure of a branching polymer. By the introduction of excluded volume in SR-EV, the overlapping beads separate to form a cluster and a linear molecule.
Figure 2.
Figure 2.. Example Self Returning Random Walk (SRRW) and Self Returning Excluded Volume (SR-EV) configurations.
The top rows are for the SRRW case, and bottom row corresponds to the associated SR-EV configuration. (A) and (E) represent the bonds of the full configurations and show that while SR-EV looks denser than the SRRW case the overall structure is preserved upon removal of the original overlaps. (B) and (F) correspond to the same small portion of the conformation and shows SR-EV having many more beads than SRRW due to the excluded volume between beads. The red circles explicitly highlight a structural motif that in SRRW is a central bead with 7 bonds branching out (a sequence of seven consecutive jump and returns steps) that transform to 15 linearly connecting beads forming a cluster. (C) and (G) display the chromatin conformations wrapped by a tight mesh suggesting the separation between a chromatin-rich and a chromatin-depleted regions, the latter being the space that free crowders could easily occupy. (D) and (H) show the bare interface between the two regions that resembles the interface dividing two bi-continuous phases and also clearly expose the difference between SRRW and SR-EV.
Figure 3.
Figure 3.. Packing domains and nucleosome accessibility.
Same Self Returning Excluded Volume (SR-EV) configuration displayed in Figure 2, but colored by the coordination number of each nucleosome. (A) Full configuration reveals the spacial dispersity of packing domains in red, consistent with heterochromatic region, intercalated with low coordinated, accesible regions. (B) 50 nm slab cut at the center of the configuration displaying details of the system heterogeneity and transition from packing domains to the intermediate, low coordinated, region. Note the white nucleosomes (coordinations number [CN] ∼ 6) at the periphery of the packing domains.
Figure 4.
Figure 4.. SR-EV and experimental slab images.
(A) representation of a 100-nm slab cut at the center of an SR-VE conformation obtained with ϕ=0.16 and . (B) 2D chromatin density corresponding to coordinates of panel (A). (C) Chromatin scanning transmission electron microscopy (ChromSTEM) 2D chromatin density obtained from a 100-nm slab of a A549 cell. The 2D density color scale is the same for (B, C), and the density is normalized to its highest value in each image.
Figure 5.
Figure 5.. Theoretical and experimental polymeric properties of chromatin.
Self Returning Excluded Volume (SR-EV) ensemble average of (A) end-to-end distance and (B) contact probability a as a function of the genomic distance for all simulated conditions, as described in Table 1. The crossover between short distance intra-domain and long distance inter-domain regimes is explicitly indicated, as well as the confinement effect at longer distances. Notice that on these two panels there are four lines per α value, while α{1.10,1.15,1.20}. (C) Experimental (Hi-C) contact probability for chromosome 1 of HCT-116 cells showing quantitative agreement with the theoretical results.
Figure 6.
Figure 6.. Chromatin volume concentration (CVC) for (A) ϕ=0.08, (B) ϕ=0.12, (C) ϕ=0.16 and (D) ϕ=0.20 and α{1.10,1.15,1.20}.
The results for ϕ=0.20, α=1.15 are the closest to the experimental findings of Ou et al., 2017. ϕ=0.08 produce CVC distributions with a much larger contribution of low-density regions, and ϕ=0.20, α=1.10 over enhance the high-density regions.
Figure 7.
Figure 7.. Chromatin packing domains.
(A) Distributions of domain radii Rd,i for all combinations of Self Returning Excluded Volume (SR-EV) parameters α and ϕ, as labeled in the figure. (B) Mean value Rd of the domain radii distributions. (C) In green, experimental distribution of domain radii obtained with chromatin scanning transmission electron microscopy (ChromSTEM) on A549 cell line, and the closest approximation from SR-EV that corresponds to α=1.15 and ϕ=0.16.
Figure 7—figure supplement 1.
Figure 7—figure supplement 1.. Example of domain and domain’s center determination from Self Returning Excluded Volume (SR-EV) slabs.
The left image shows the collapse SR-EV density from a 100-nm slab. The right image shows the identified domains cores in black and their geometric centers in yellow. Three different domains are identified with the numbers.
Figure 7—figure supplement 2.
Figure 7—figure supplement 2.. Example of the determination of the density profiles of domains and their effective radii.
The three cases correspond to the large, medium, and small domains denoted by 1, 2, and 3 in Figure 7—figure supplement 1. The profiles are calculated from the domain center using the coordinates from the configurations and assuming cylindrical symmetry. The radius of a domain corresponds to the first minimum in the density profile.
Figure 8.
Figure 8.. Packing coefficient D.
(A) Ensemble average cumulative pair correlation function G(r) for ϕ=0.16 and the three studied values of α. The vertical black lines mark the boundaries used to perform a power-law regression to calculate D. (B) Packing coefficient D as a function of ϕ and α. (C) Distribution of packing coefficient Di for all the individual configurations for the 12 simulated conditions and, for comparison, we inserted the experimental partial wave spectroscopic (PWS) D results for U2OS cells that agree very well with the SR-EV results for ϕ=0.12 and α=1.15.
Figure 8—figure supplement 1.
Figure 8—figure supplement 1.. Example of cumulative distribution functions, Gi(r), for five different Self Returning Excluded Volume (SR-EV) configurations.
Each Gi(r) is fitted with a power law between 40 and 120 nm to determine the packing coefficient Di corresponding to that configuration.
Figure 9.
Figure 9.. Local correlation between packing parameter and chromatin volume concentration.
Relation between the calculated Di with the average local volume fraction ϕi. Both quantities are calculated for the same configuration and in the same spherical region of 240 nm in radius. The figure includes one point for each one of the 12,000 configurations of the 12 simulated ensembles.
Figure 10.
Figure 10.. Effect of degrading RAD21 on the relation between packing parameter and chromatin volume concentration.
The small open symbols are the Self Returning Excluded Volume (SR-EV) results for ϕ=0.12, α=1.10 and 1.15. The filled symbols represent the experimental values obtained with chromatin scanning transmission electron microscopy (ChromSTEM) (Li, 2024) for the control sample (blue) and the RAD21 degrade sample (red).

Update of

Similar articles

Cited by

References

    1. Adame-Arana O, Bajpai G, Lorber D, Volk T, Safran S. Regulation of chromatin microphase separation by binding of protein complexes. eLife. 2023;12:e82983. doi: 10.7554/eLife.82983. - DOI - PMC - PubMed
    1. Almassalha LM, Bauer GM, Chandler JE, Gladstein S, Cherkezyan L, Stypula-Cyrus Y, Weinberg S, Zhang D, Thusgaard Ruhoff P, Roy HK, Subramanian H, Chandel NS, Szleifer I, Backman V. Label-free imaging of the native, living cellular nanoarchitecture using partial-wave spectroscopic microscopy. PNAS. 2016;113:E6372–E6381. doi: 10.1073/pnas.1608198113. - DOI - PMC - PubMed
    1. Annunziato A. DNA packaging: Nucleosomes and chromatin. Nature Education. 2008;1:26
    1. Arya G, Zhang Q, Schlick T. Flexible histone tails in a new mesoscopic oligonucleosome model. Biophysical Journal. 2006;91:133–150. doi: 10.1529/biophysj.106.083006. - DOI - PMC - PubMed
    1. Arya G, Schlick T. A tale of tails: How histone tails mediate chromatin compaction in different salt and linker histone environments. The Journal of Physical Chemistry A. 2009;113:4045–4059. doi: 10.1021/jp810375d. - DOI - PMC - PubMed