. 2024 Sep 27;10(39):eadp6285.
doi: 10.1126/sciadv.adp6285. Epub 2024 Sep 27.

Combined assembloid modeling and 3D whole-organ mapping captures the microanatomy and function of the human fallopian tube

Affiliations

Combined assembloid modeling and 3D whole-organ mapping captures the microanatomy and function of the human fallopian tube

Ashleigh J Crawford et al. Sci Adv. .

Abstract

The fallopian tubes play key roles in processes from pregnancy to ovarian cancer where three-dimensional (3D) cellular and extracellular interactions are important to their pathophysiology. Here, we develop a 3D multicompartment assembloid model of the fallopian tube that molecularly, functionally, and architecturally resembles the organ. Global label-free proteomics, innovative assays capturing physiological functions of the fallopian tube (i.e., oocyte transport), and whole-organ single-cell resolution mapping are used to validate these assembloids through a multifaceted platform with direct comparisons to fallopian tube tissue. These techniques converge at a unique combination of assembloid parameters with the highest similarity to the reference fallopian tube. This work establishes (i) an optimized model of the human fallopian tubes for in vitro studies of their pathophysiology and (ii) an iterative platform for customized 3D in vitro models of human organs that are molecularly, functionally, and microanatomically accurate by combining tunable assembloid and tissue mapping methods.


Figures
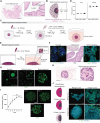
Fig. 1.
Fig. 1.. Human fallopian tube assembloids.
(A) A healthy human fallopian tube tissue section. Hematoxylin and eosin (H&E): nuclei (purple), ECM and cytoplasm (pink). Scale bar, 5 mm. Inset, 75 μm. Cartoons depicting (B) a multicompartment fallopian tube assembloid and (C) the protocol to generate assembloids where stromal cells can be incorporated into the corona. (D) The radius of fallopian tube assembloid cores and whole assembloids (corona) was measured from phase-contrast images taken on day 1 of assembloid culture. Data are means ± SD. (E) Cartoon depicting the standard organoid protocol and a mature standard organoid. (F) Side-by-side comparison of standard organoids (left), human fallopian tube tissue (middle), and multicompartment assembloids (right). Inset is a whole organoid, fallopian tube, or assembloid. F-actin (green) and nuclear DNA (blue). Fallopian tube tissue is an H&E-stained tissue section. Scale bars, 50 μm. (G) EGFP-tagged FTECs (green) on day 6 grown in the standard organoid model (left), a technical control (middle), and the multicompartment assembloid model (right). Scale bar, 250 μm. Inset, 50 μm. (H) H&E image of a fallopian tube multicompartment assembloid. Scale bar, 300 μm. Inset is the epithelial region of the assembloid. Inset scale bar, 100 μm. (I) PrestoBlue net proliferation in multicompartment assembloids with time point images. Scale bar, 250 μm. N = 3, n = 4+. Statistical test: one-way analysis of variance (ANOVA), ns P > 0.05. Data are means ± SEM. (J) Representative images of all permutations to the assembloid ECM. F-actin (green) and nuclear DNA (blue). Scale bar, 100 μm. All organoid/assembloid images are maximum intensity projections of confocal microscopy stacks.
Fig. 2.
Fig. 2.. Fallopian tube assembloids maintain tissue expression patterns.
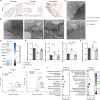
(A) H&E image of a fallopian tube tissue section. Nuclei (purple), ECM and cytoplasm (pink). Scale bar, 5 mm. Top inset is the fallopian tube fimbriae and bottom inset is the fallopian tube ampulla. Inset scale bars, 100 μm. (B) E-cadherin IHC of FFPE tissue sections of the fallopian tube fimbriae (top), fallopian tube ampulla (middle), and fallopian tube assembloid (bottom). Scale bar, 50 μm. Inset scale bar, 25 μm. The fallopian tube tissue sections in Fig. 1F, (A) and (B) of this figure, Fig. 3A, and the corresponding supplementary figures (figs. S2A and S3A) are sequential tissue sections from the same fallopian tube. The assembloid sections in Fig. 1H, (B) of this figure, Fig. 3A, and the corresponding supplementary figures (figs. S2A and S3A) are sequential tissue sections from the same assembloid. Immunofluorescence staining for (C) Ki-67 and (D) MUC16 in multicompartment fallopian tube assembloids. Images of assembloids are maximum intensity projections of stacks of confocal microscopy images. Scale bars, 100 μm. Inset scale bars, 20 μm. F-actin (green), nuclear DNA (blue), and protein of interest (red). (E) Venn diagram performed on all quantifiable protein groups (with ≥2 unique peptides) in the FTEC cell line (purple) and primary FTEC (green) multicompartment organoids and standard (light gray) organoids. (F) Some proteins identified in the proteomes are categorized in the human matrisome (50) for all tissues (left) and fallopian tube specific (right). (E and F) N = 4.
Fig. 3.
Fig. 3.. Epithelial composition of multicompartment assembloids.
(A) PAX8 IHC of FFPE tissue sections of the fallopian tube fimbriae (left), fallopian tube ampulla (middle), and fallopian tube assembloid (right). Scale bar, 50 μm. TEM of the (B) cell-Matrigel (lumen-like) interface and (C) cell–collagen I (stroma-like) interface of a multicompartment assembloid. Scale bars, 2 μm. Inset scale bars, (B) 500 nm (both) and (C) 300 nm. Asterisk, junction complex; filled arrow, cilia/microvilli; open arrow, secretion. (D) RT-qPCR of β-estradiol (β)– or progesterone (P)–treated multicompartment assembloids. Data are log10(relative expression:untreated control). Relative expression of genes related to (E) ciliated differentiation and (F) proliferation. (D to F) N = 3, n = 3. Statistical tests: one-way ANOVA with multiple comparisons, ***P ≤ 0.001, **P ≤ 0.01, *P ≤ 0.05. All data are means ± SEM. Volcano plot of up-regulated (red)/down-regulated (blue) protein groups when (G) FTEC cell line multicompartment assembloids and (H) primary FTEC multicompartment assembloids were treated with β-estradiol [statistical significance: q value ≤0.05 and absolute log2(fold change) ≥ 0.2]. (I) Gene Ontology (52, 53) biological processes that were up-regulated in the β-estradiol–treated FTEC cell line (left) and primary FTEC (right) multicompartment assembloids. Relative protein quantification assessed by DIA-MS (47) and subsequent enrichment analysis performed using ConsensusPathDB (75, 76). N = 4.
Fig. 4.
Fig. 4.. Multicompartment assembloids demonstrate functional similarity to the fallopian tube.
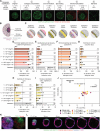
(A) Cartoon depicting the bead displacement assay protocol in assembloids. Arrows indicate microbead movement. (B) A multicompartment assembloid used in the bead displacement assay with microbeads at the assembloid’s epithelial–lumen-like interface. EGFP-tagged FTECs (green) and microbeads (red). Scale bar, 100 μm. (C) Representative microbead trajectories from assembloid cores with microbeads only (noise, black), microbeads with FTECs (teal), and microbeads with FTECs treated with β-estradiol (purple). Scale bar, 10 μm. (D) Microbead MSDs over 8 hours. Center line, median; box limits, upper and lower quartiles; whiskers, minimum to maximum. (E) Relative frequency of microbead velocities. (C to E) N = 3, n = 4 to 46. (F) Cartoon depicting cilia motility assay with assembloid digestion. Arrows indicate cell movement in DPBS. (G) Phase-contrast images from the cilia-driven motility assay. Cell trajectory (red). Scale bar, 50 μm. (H) Cell MSDs in DPBS after assembloid digestion. N = 3, n > 100. Statistical tests: (D) one-way ANOVA with multiple comparisons, (H) unpaired t test, ****P ≤ 0.0001, **P ≤ 0.01. All data are means ± SEM.
Fig. 5.
Fig. 5.. Combined CODA and assembloid modeling in tandem produce a tissue-validated assembloid model.
(A) An iterative platform compared a tissue reference map (top left) and assembloid maps (top right). (Bottom left) Architectural quantifications were compared from these maps. (Bottom right) Assembloid parameters were adjusted and CODA imaging was repeated until an assembloid generation closely matched the tissue architecture. The CODA workflow: (B) Fallopian tube tissue and assembloids were formalin fixed, paraffin embedded (FFPE), and the entire tissue was serial sectioned. One in every two tissue sections was stained with hematoxylin and eosin (H&E) and scanned at 20× magnification. (C) (a) All scanned tissue sections were computationally aligned by an elastic registration process in sequential order. (b) Tissue components such as the epithelium (gold), stroma (pink), vasculature (red), and nerves (green) were manually annotated in a small fraction of the images to train the deep learning algorithm to automatically segment all tissue sections. (c) Individual cell nuclei were detected from the H&E images. Noise from image scans was adjusted in the cell count. (D) Z-projection of fallopian tube epithelium (gold) and vasculature (red) from a reference map. Scale bar, 5 mm. A 3D reconstruction of a cross section of the fallopian tube is shown (right). Scale bar, 0.5 mm. (E) Z-projection of the assembloid epithelium (purple) and stroma-like region (pink) from an assembloid map. Multicompartment assembloid parameters: 1 × 10⁴ FTECs in a GFR Matrigel core and collagen I (2 mg/ml) corona. Scale bar, 0.5 mm. A 3D reconstruction of the assembloid epithelium is shown (right). Scale bar, 0.25 mm.
Fig. 6.
Fig. 6.. Iterative changes to assembloid parameters produce a model that mimics the fallopian tube.
(A) Cell seeding numbers (1 × 10⁴ or 5 × 10³ cells per core), cell types (E = FTECs, S = stromal cells), Matrigel type (GFR, growth factor reduced; +GF, formulation with growth factors), and collagen density (2, 4, or 6 mg/ml) were adjusted in the multicompartment model. Images are maximum intensity projections of confocal fluorescence microscopy stacks. EGFP-tagged FTECs (green) and mCherry-tagged stromal cells (red). Scale bar, 300 μm. (B) Cartoon depicting the compartmentalization within an assembloid. Epithelial cells (purple), stromal cells (blue), Matrigel (magenta), and collagen (pink). (C) Architectural quantifications from CODA maps. The percent deviation of each assembloid generation from the fallopian tube reference values: (D) epithelial packing density within the epithelium wall (cells/mm3 epithelium), (E) epithelial bulk cell density across the whole tissue/assembloid (cells/mm3 bulk), (F) stromal cell packing density within the stroma (cells/mm3), (G) volume ratio of epithelium to lumen, (H) epithelium thickness (μm), and (I) ratio of epithelium nucleus to cytoplasm. n = 3. Data are mean ± SD. (J) Quantitative comparison of assembloids to the reference fallopian tube via PCA. n = 3. (K) Maximum intensity projections of confocal fluorescence microscopy stacks of the 1 × 10⁴ 2 mg/ml + S assembloid generation. (L) Single-plane confocal fluorescence microscopy images of the 1 × 10⁴ 2 mg/ml + S assembloid generation. For (K) and (L), FTEC (green), stromal cells (red), nuclear DNA (blue), and F-actin (magenta). Scale bar, 200 μm.

References

    1. Croxatto H. B., Physiology of gamete and embryo transport through the fallopian tube. Reprod. Biomed. Online 4, 160–169 (2002). - PubMed
    1. Leese H., Tay J., Reischl J., Downing S., Formation of fallopian tubal fluid: Role of a neglected epithelium. Reproduction, 339–346 (2001). - PubMed
    1. Shao R., Understanding the mechanisms of human tubal ectopic pregnancies: New evidence from knockout mouse models. Hum. Reprod. 25, 584–587 (2010). - PMC - PubMed
    1. Chua S. J., Akande V. A., Mol B. W. J., Surgery for tubal infertility. Cochrane Database Syst. Rev. 1, CD006415 (2017). - PMC - PubMed
    1. Zondervan K. T., Becker C. M., Missmer S. A., Endometriosis. N. Engl. J. Med. 382, 1244–1256 (2020). - PubMed

LinkOut - more resources