. 2024 Sep 27;10(39):eadp2442.
doi: 10.1126/sciadv.adp2442. Epub 2024 Sep 27.

Estrogen signaling suppresses tumor-associated tissue eosinophilia to promote breast tumor growth

Affiliations

Estrogen signaling suppresses tumor-associated tissue eosinophilia to promote breast tumor growth

Sandeep Artham et al. Sci Adv. .

Abstract

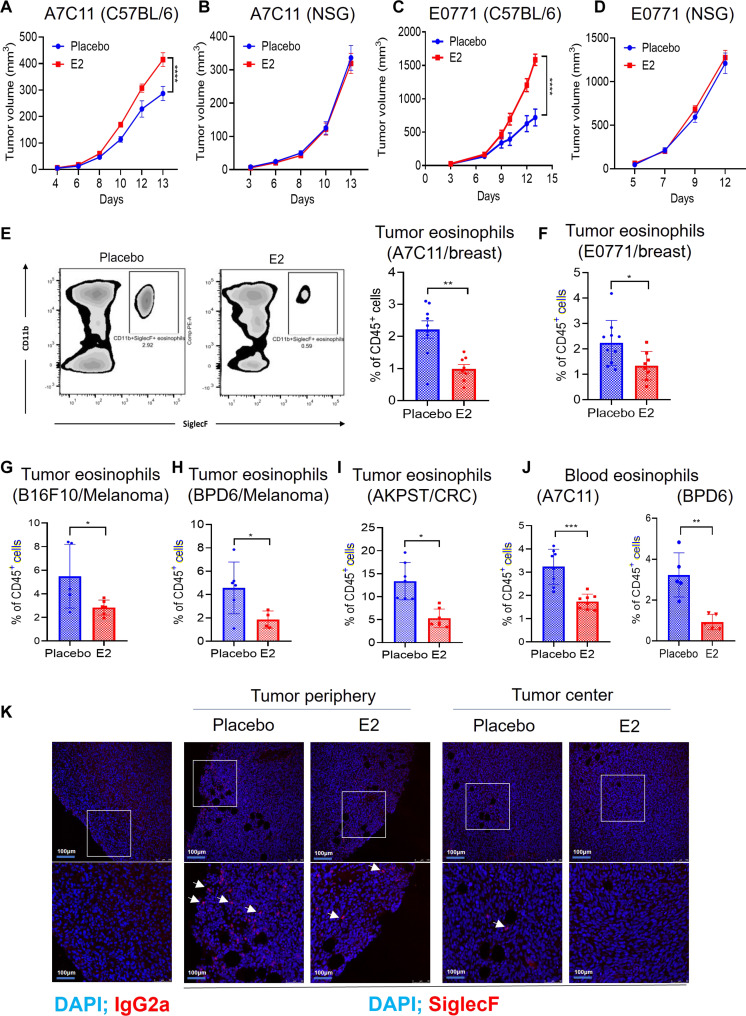
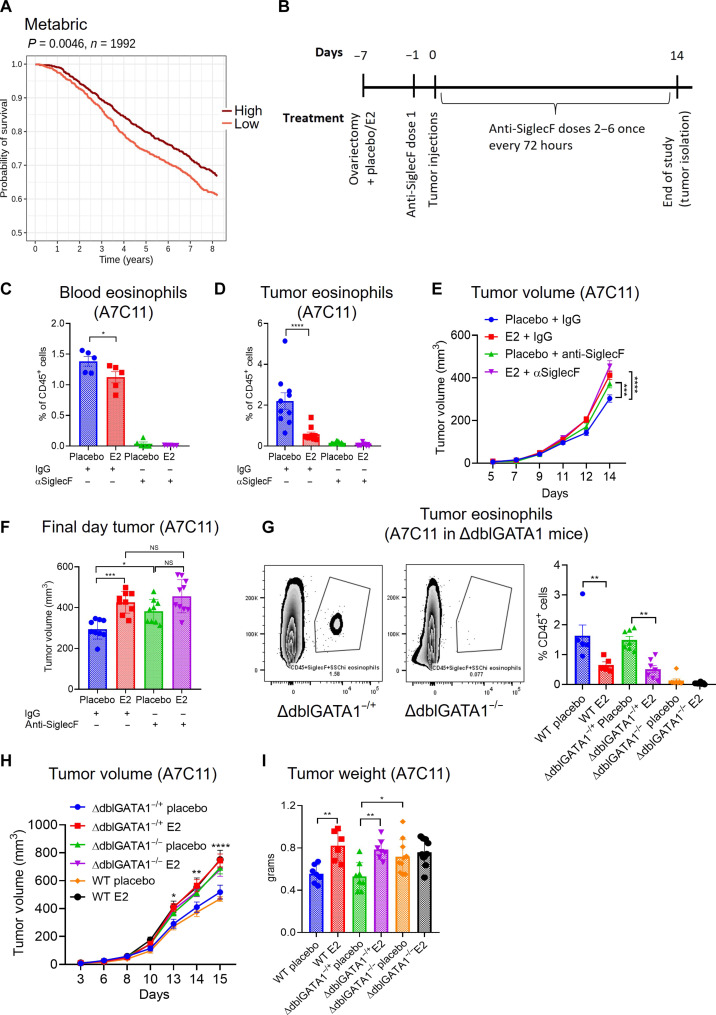
Estrogens regulate eosinophilia in asthma and other inflammatory diseases. Further, peripheral eosinophilia and tumor-associated tissue eosinophilia (TATE) predicts a better response to immune checkpoint blockade (ICB) in breast cancer. However, how and if estrogens affect eosinophil biology in tumors and how this influences ICB efficacy has not been determined. Here, we report that estrogens decrease the number of peripheral eosinophils and TATE, and this contributes to increased tumor growth in validated murine models of breast cancer and melanoma. Moreover, estrogen signaling in healthy female mice also suppressed peripheral eosinophil prevalence by decreasing the proliferation and survival of maturing eosinophils. Inhibiting estrogen receptor (ER) signaling decreased tumor growth in an eosinophil-dependent manner. Further, the efficacy of ICBs was increased when administered in combination with anti-estrogens. These findings highlight the importance of ER signaling as a regulator of eosinophil biology and TATE and highlight the potential near-term clinical application of ER modulators to increase ICB efficacy in multiple tumor types.


Figures

Fig. 1.
Fig. 1.. ET/Ovarian suppression increases the prevalence of blood eosinophils in patients with breast cancer.
(A) Schematic depiction of the study design that was used to evaluate peripheral blood immune cell counts in patients with breast cancer that received endocrine therapy (ET). (B) Changes in the prevalence of various blood immune cells obtained from complete differential blood counts in patients taken at baseline (CBC collected before chemotherapy but no more than 3 months before diagnosis) and an early timepoint (T1) after the initiation of ET (n = 70). (C) Changes in the prevalence of various blood immune cells obtained from complete differential blood counts in patients taken at baseline and a late timepoint (T2) after the initiation of ET (n = 69). (D) Changes in the prevalence of blood eosinophils in patients taken at postchemo baseline compared to ET treatment at T2 (n = 41). (E) Changes in the prevalence of blood eosinophils in patients collected at the prechemo baseline compared to the postchemo timepoint (n = 41). (F) Changes in the prevalence of blood eosinophils in patients comparing pre- versus postbreast tumor resection surgery (n = 25). Data are shown as the mean ± SD. Significance was calculated using two-way ANOVA with repeated measures followed by Bonferroni correction of individual immune cell values normalized to variance. This was followed by paired Student’s t test for comparing baseline and treatment for individual immune cells. *P ≤ 0.05, **P ≤ 0.005, and ***P ≤ 0.0001.
Fig. 2.
Fig. 2.. Estrogens decrease tumor and blood eosinophil numbers and increase tumor growth.
(A) The growth of orthotopic A7C11 tumors (2 × 10⁴ cells) in ovariectomized female C57BL/6 mice. Following ovariectomy, mice were supplemented with either placebo or E2 (2.72 mcg/ml in drinking water) throughout the study (n = 9). (B) The growth of orthotopic A7C11 tumors (2 × 10⁴ cells) in ovariectomized, immune-compromised NSG mice, supplemented with placebo or E2 (n = 10). (C) E0771 (2 × 10⁵ cells) tumor growth in syngeneic C57BL/6 mice ovariectomized and supplemented with placebo or E2 (n = 10). (D) E0771 (2 × 10⁵ cells) tumor volume in immune-compromised NSG mice ovariectomized and supplemented with placebo or E2 (n = 10). (E to I) Tumor-infiltrated eosinophils (CD45+Ly6GlowSSChiMHCIICD11b+SiglecF+) in A7C11 (E), E0771 (F), B16F10 (G), BPD6 (H), and AKPS (I) tumor models. (J) Quantification of blood eosinophil counts in tumor-bearing mice in A7C11 and BPD6 tumor models (n = 6). (K) Representative immunohistochemistry images (20×) showing siglecF (red)–expressing cells (eosinophils) in the periphery and center of A7C11 tumor. Data are shown as the mean ± SD. Results in (A) to (H) and (J) are representative of two independent experiments. (A to D) Two-way ANOVA followed by Tukey’s multiple comparison test; (E to J) Unpaired t test. *P ≤ 0.05, **P ≤ 0.005, and ***P ≤ 0.0001.
Fig. 3.
Fig. 3.. Eosinophils have antitumorigenic properties in murine models of breast cancer.
(A) Survival analysis using an eosinophil gene signature (20) in patients with breast cancer (Metabric dataset). The patients were stratified into low and high expressing groups (of the eosinophil gene signature) according to the median. The P value was calculated using a log-rank test in R (n = 1992). (B) Schematic of the experimental plan for the eosinophil depletion study. (C and D) Quantification of blood and tumor eosinophils confirming depletion of eosinophils with anti-SiglecF antibody given once every 72 hours (n = 10). (E and F) A7C11 tumor growth and final day tumor volume in ovariectomized C57BL/6J mice treated with placebo or E2 and given either IgG or anti-SiglecF antibody (1 mg/kg dose) once every 72 hours (n = 10). (G) Quantification of A7C11 tumor eosinophils in ΔdblGATA1 mice ovariectomized and supplemented with placebo or E2. Eosinophils are absent in the ΔdblGATA1−/− (n = 9) mice as compared to littermate controls ΔdblGATA1−/+ mice (n = 7). (H and I) Tumor growth and final day tumor weight in ΔdblGATA1−/− and littermate control ΔdblGATA1−/+ mice ovariectomized and supplemented with placebo or E2 for 7 days before orthotopic injection of A7C11 (2 × 10⁴ cells) (n = 7 to 9). Data are shown as the mean ± SD. (C, D, F, H, and I) One-way ANOVA followed by Tukey’s test. (E and H) Two-way ANOVA followed by Tukey’s test. *P ≤ 0.05, **P ≤ 0.005, and ***P ≤ 0.0001.
Fig. 4.
Fig. 4.. E2 regulates the biogenesis and antitumor activity of eosinophils.
(A) Blood eosinophils in healthy C57BL/6J mice ovariectomized and supplemented with placebo or E2 (n = 6). (B) Bone marrow eosinophils in A7C11 tumor-bearing and healthy C57BL/6J mice ovariectomized and supplemented with placebo or E2 (n = 6). (C) Schematic representation of experimental plan used to generate BMEos in vitro. (D and E) Quantification of live BMEos and Ki67+ BMEos in the experiment at various timepoints (n = 3). (F) Schematic representation of the experimental plan used to study BMEos cytotoxicity activity in vitro. (G and H) Quantification of live, pre-apoptotic, apoptotic, and necrotic A7C11 cells after 5 hours of coculture with BMEos differentiated in presence or absence of E2 (n = 4). (I) Volcano plot of differentially expressed genes in BMEos (n = 3). (J and K) Negative enrichment plots for hallmark Myc target V2 and hallmark G2M checkpoint pathways in E2 versus Veh treatment comparison (n = 3). (L) Normalized counts from RNAseq for mRNAs that encode proteins in the cytotoxic granules of eosinophils; Epx, eosinophil peroxidase; Ear1, eosinophil-associated RNAse1; Prg2, major basic protein (n = 3). (M) qPCR analysis of BMEos (day 11) for the expression of Epx, Ear1, Prg2, Myc, Cdc6, and E2f1 genes (n = 3). (N) Quantification of BMEos viability (live/dead staining of eosinophils) and proliferation (Ki67+ BMEos) at day 11 with the addition of an ER degrader fulv (100 nM) in addition to E2 (n = 4). Data are shown as the mean ± SD. Results in (A), (B), (D), (E), (H), (M), and (N) are representative of three independent experiments. (A and B) unpaired t test; (D, E, H, and M) two-way ANOVA followed by Tukey’s multiple comparison test; (N) one-way ANOVA followed by Tukey’s multiple comparison test. *P ≤ 0.05, **P ≤ 0.005, and ***P ≤ 0.0001.
Fig. 5.
Fig. 5.. Inhibiting ERα signaling in eosinophils promotes their antitumorigenic activity.
(A) Schematic showing breeding strategy to generate EosERWT and EosERKO mice. (B) Western blot of ERα expression in eosinophils derived from the BM of either EosERWT or EosERKO mice (n = 3). (C and D) Tumor growth and final day tumor volume in EosERKO and EosERWT mice ovariectomized and supplemented with placebo or E2 for 7 days before orthotopic injection of A7C11 (2 × 10⁴ cells) (n = 9). (E and F) Tumor growth and final day tumor volume in EosERKO and EosERWT mice ovariectomized and supplemented with placebo or E2 for 7 days before orthotopic injection of E0771 (2 × 10⁵ cells) (n = 9). (G and H) Quantification of tumor eosinophils (n = 7) and tumor eosinophil peroxidase levels (n = 3) in the A7C11 tumors from EosERWT and EosERKO mice. Data are shown as the mean ± SD. Results in (C) and (D) are representative of two independent experiments. (C and E) Two-way ANOVA followed by Tukey’s multiple comparison test. (G and H) One-way ANOVA followed by Tukey’s multiple comparison test. *P ≤ 0.05, **P ≤ 0.005, and ***P ≤ 0.0001.
Fig. 6.
Fig. 6.. Pharmacological inhibition of ER signaling increases TATE to suppress tumor growth.
(A) A7C11 tumor volume (after injecting 2 × 10⁴ cells) in ovariectomized C57BL/6 mice supplemented with E2 or placebo and given subcutaneous laso (10 mg/kg per day) or vehicle daily starting from day 2 after tumor injection. Significant increase in tumor growth with E2 treatment was reversed with the addition of laso (n = 10). (B) E0771 tumor volume (after injecting 2 × 10⁵ cells) in ovariectomized C57BL/6 mice supplemented with E2 or placebo and given subcutaneous laso (10 mg/kg per day) or vehicle daily starting from day 2 after tumor injection. Significant increase in tumor growth with E2 treatment was reversed with the addition of laso (n = 10). (C) Quantification of tumor eosinophils. The decrease in eosinophils with estrogen treatment was reversed by lasofoxifene treatment. An increase in tumor eosinophils when laso was given alone was also noted (n = 8). (D) Quantification of tumor eosinophil peroxidase (EPX) levels in A7C11 tumors, indicating rescue of eosinophil activity in the tumors upon lasofoxifene treatment (n = 5). (E) Schematic of experimental methods for eosinophil depletion study and laso treatment. (F and G) A7C11 tumor growth and final day tumor volume in ovariectomized C57BL/6 mice supplemented with placebo or E2 and given either intraperitoneal IgG or anti-SiglecF antibody (1 mg/kg per dose) once every 72 hours and subcutaneous laso (10 mg/kg per day) or vehicle given daily from day 2 after tumor injections (n = 8). Data are shown as the mean ± SD. Results in (A) and (C) are representative of two independent experiments. (A, B, and F) Two-way ANOVA followed by Tukey’s multiple comparison test; (C, D, and G) One-way ANOVA followed by Tukey’s multiple comparison test. *P ≤ 0.05, **P ≤ 0.005, and ***P ≤ 0.0001.
Fig. 7.
Fig. 7.. Lasofoxifene enhances the antitumor efficacy of immune checkpoint inhibitors.
(A and B) Individual and average A7C11 tumor growth curves in C57BL/6 mice that were ovariectomized and given placebo or E2 treatment were further treated with subcutaneous laso (10/mg/kg per day) or subcutaneous vehicle treatment starting from day 2 after tumor cell injection, intraperitoneal ICB (anti-CTLA, 4 to 5 mg/kg; anti-PD1, 10 mg/kg) or IgG given once every 72 hours starting from day 2, intramuscular fulv (25 mg/kg) or vehicle given once weekly starting from day 2 after tumor injections or the combinations as indicated (n = 8). (C) Final day tumor volume (A7C11) in treatment groups as indicated (n = 8). (D and E) Quantification of tumor eosinophils (D) and CD8 T cells (E) (n = 8). Data are expressed as the mean ± SD. Results in (A) to (E) are representative of two independent experiments. Two-way ANOVA followed by Tukey’s multiple comparison test. *P ≤ 0.05, **P ≤ 0.005, and ***P ≤ 0.0001.
Fig. 8.
Fig. 8.. Model describing how modulating ER influences eosinophil biology.
E2 suppresses peripheral eosinophil prevalence and TATE in tumor models. E2 also decreases eosinophil cytotoxicity by suppressing the expression of cytotoxic granular contents. These deleterious effects of estrogens can be countered using anti-estrogens such as laso and fulv.

References

    1. Giaquinto A. N., Sung H., Miller K. D., Kramer J. L., Newman L. A., Minihan A., Jemal A., Siegel R. L., Breast cancer statistics, 2022. CA Cancer J. Clin. 72, 524–541 (2022). - PubMed
    1. Hanker A. B., Sudhan D. R., Arteaga C. L., Overcoming endocrine resistance in breast cancer. Cancer Cell 37, 496–513 (2020). - PMC - PubMed
    1. Harbeck N., Penault-Llorca F., Cortes J., Gnant M., Houssami N., Poortmans P., Ruddy K., Tsang J., Cardoso F., Breast cancer. Nat. Rev. Dis. Primers. 5, 66 (2019). - PubMed
    1. Harbeck N., Bartlett M., Spurden D., Hooper B., Zhan L., Rosta E., Cameron C., Mitra D., Zhou A., CDK4/6 inhibitors in HR+/HER2- advanced/metastatic breast cancer: A systematic literature review of real-world evidence studies. Future Oncol. 17, 2107–2122 (2021). - PubMed
    1. Li F., Liu S., Focusing on NK cells and ADCC: A promising immunotherapy approach in targeted therapy for HER2-positive breast cancer. Front. Immunol. 13, 1083462 (2022). - PMC - PubMed