

Revealing a cancer-associated fibroblast-based risk signature for pancreatic adenocarcinoma through single-cell and bulk RNA-seq analysis
- PMID: 39332020
- PMCID: PMC11466480
- DOI: 10.18632/aging.206043
Revealing a cancer-associated fibroblast-based risk signature for pancreatic adenocarcinoma through single-cell and bulk RNA-seq analysis
Abstract
Purpose: Proliferation of stromal connective tissue is a hallmark of pancreatic adenocarcinoma (PAAD). The engagement of activated cancer-associated fibroblasts (CAFs) contributes to the progression of PAAD through their involvement in tumor fibrogenesis. However, the prognostic significance of CAF-based risk signature in PAAD has not been explored.
Methods: The single-cell RNA sequencing (scRNA-seq) data sourced from GSE155698 within the Gene Expression Omnibus (GEO) database was supplemented by bulk RNA sequencing data from The Cancer Genome Atlas (TCGA) and microarray data retrieved from the GEO database. The scRNA-seq data underwent processing via the Seurat package to identify distinct CAF clusters utilizing specific CAF markers. Differential gene expression analysis between normal and tumor samples was conducted within the TCGA-PAAD cohort. Univariate Cox regression analysis pinpointed genes associated with CAF clusters, identifying prognostic CAF-related genes. These genes were utilized in LASSO regression to craft a predictive risk signature. Subsequently, integrating clinicopathological traits and the risk signature, a nomogram model was constructed.
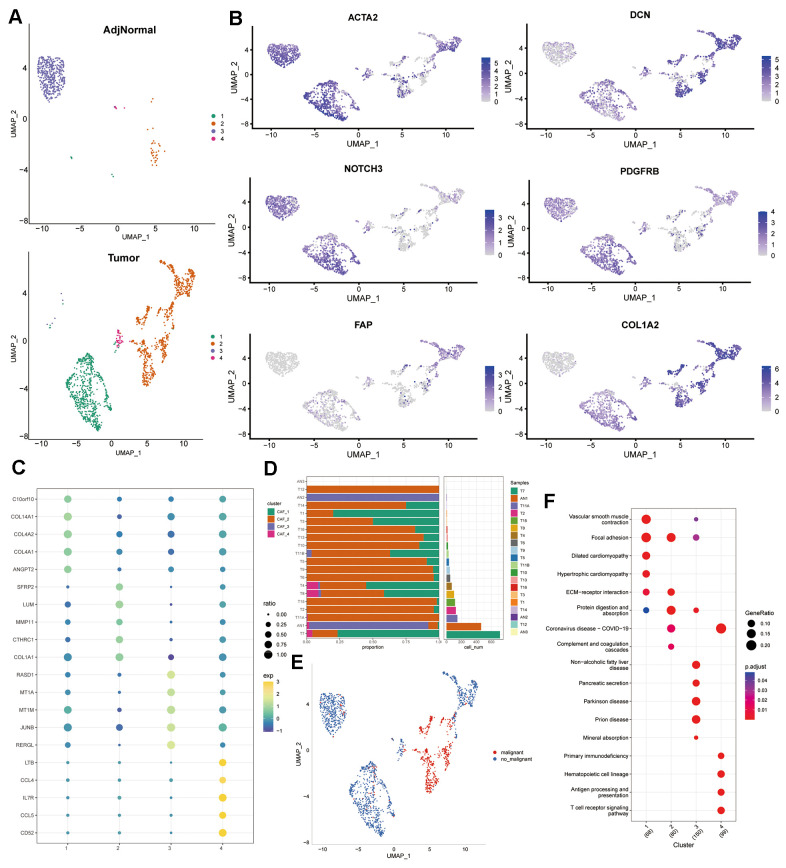
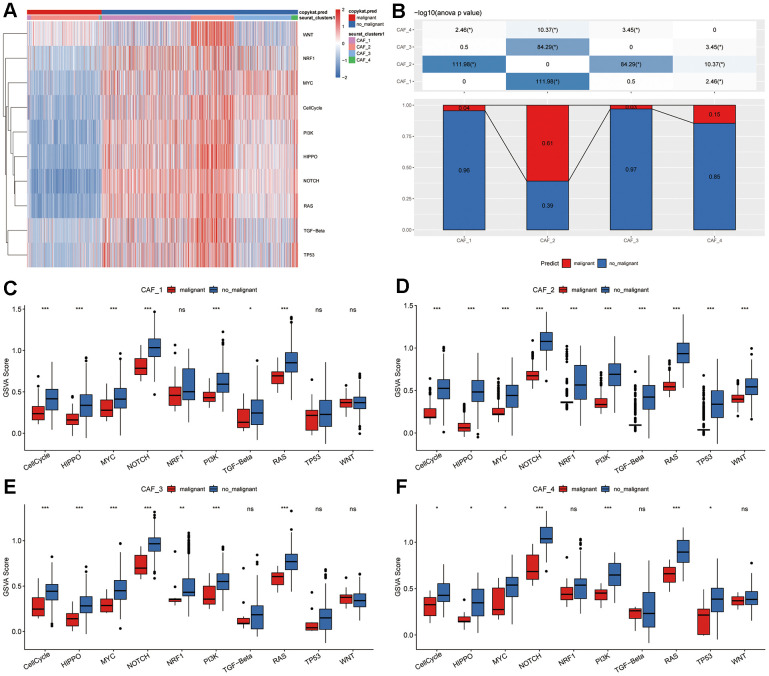
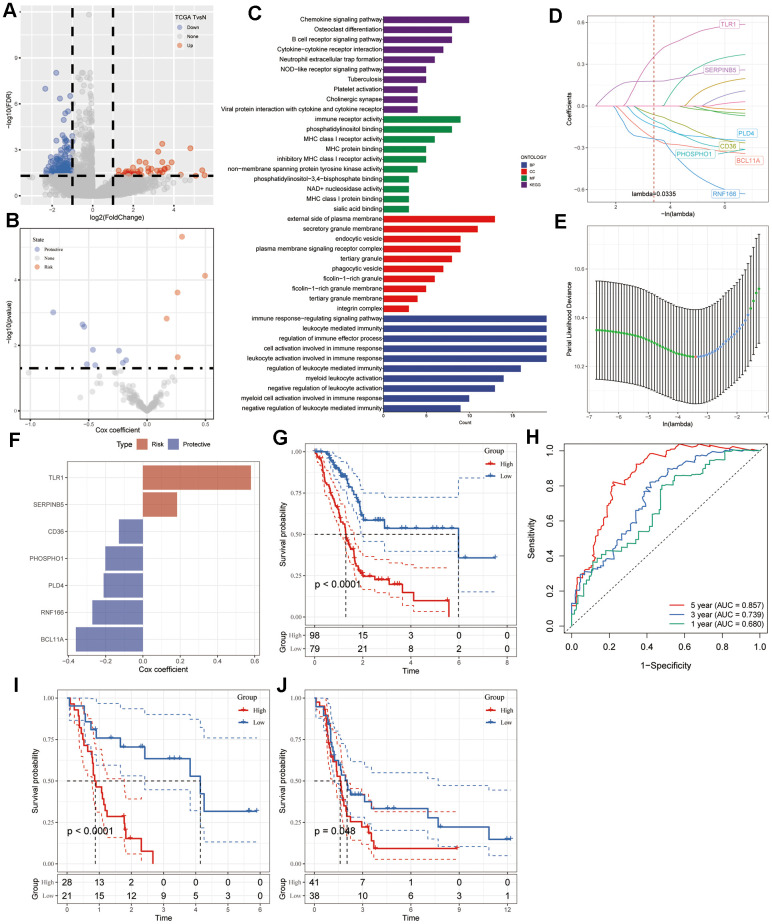
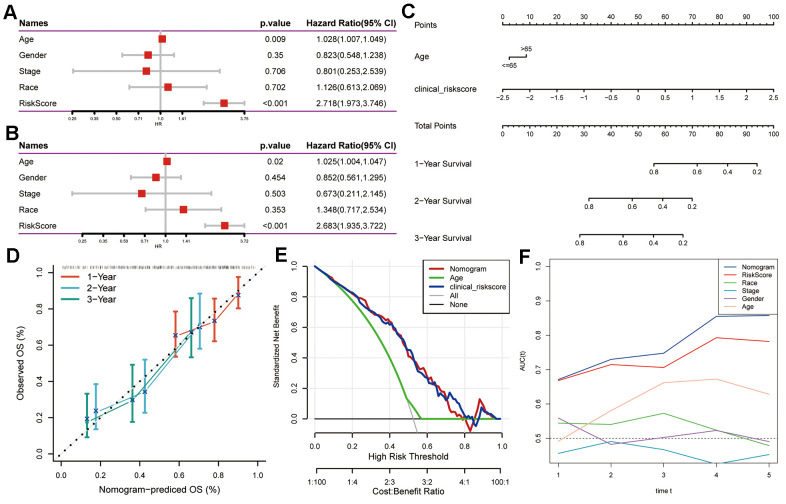
Results: Our scRNA-seq analysis unveiled four distinct CAF clusters in PAAD, with two linked to PAAD prognosis. Among 207 identified DEGs, 148 exhibited significant correlation with these CAF clusters, forming the basis of a seven-gene risk signature. This signature emerged as an independent predictor in multivariate analysis for PAAD and demonstrated predictive efficacy in immunotherapeutic outcomes. Additionally, a novel nomogram, integrating age and the CAF-based risk signature, exhibited robust predictability and reliability in prognosticating PAAD. Moreover, the risk signature displayed substantial correlations with stromal and immune scores, as well as specific immune cell types.
Conclusions: The prognosis of PAAD can be accurately predicted using the CAF-based risk signature, and a thorough analysis of the PAAD CAF signature may aid in deciphering the patient's immunotherapy response and presenting fresh cancer treatment options.
Keywords: cancer-associated fibroblasts; immunotherapy; nomogram; pancreatic adenocarcinoma; risk signature.
Conflict of interest statement
Figures
Similar articles
-
RNA-seq and bulk RNA-seq data analysis of cancer-related fibroblasts (CAF) in LUAD to construct a CAF-based risk signature.Sci Rep. 2024 Oct 6;14(1):23243. doi: 10.1038/s41598-024-74336-1. Sci Rep. 2024. PMID: 39369095 Free PMC article.
-
Characterization of cancer-related fibroblasts (CAF) in hepatocellular carcinoma and construction of CAF-based risk signature based on single-cell RNA-seq and bulk RNA-seq data.Front Immunol. 2022 Sep 23;13:1009789. doi: 10.3389/fimmu.2022.1009789. eCollection 2022. Front Immunol. 2022. PMID: 36211448 Free PMC article.
-
Construction of T-Cell-Related Prognostic Risk Models and Prediction of Tumor Immune Microenvironment Regulation in Pancreatic Adenocarcinoma via Integrated Analysis of Single-Cell RNA-Seq and Bulk RNA-Seq.Int J Mol Sci. 2025 Mar 7;26(6):2384. doi: 10.3390/ijms26062384. Int J Mol Sci. 2025. PMID: 40141028 Free PMC article.
-
Identify potential prognostic indicators and tumor-infiltrating immune cells in pancreatic adenocarcinoma.Biosci Rep. 2022 Feb 25;42(2):BSR20212523. doi: 10.1042/BSR20212523. Biosci Rep. 2022. PMID: 35083488 Free PMC article. Review.
-
Cancer-associated fibroblasts in breast cancer in the single-cell era: Opportunities and challenges.Biochim Biophys Acta Rev Cancer. 2025 Apr;1880(2):189291. doi: 10.1016/j.bbcan.2025.189291. Epub 2025 Feb 28. Biochim Biophys Acta Rev Cancer. 2025. PMID: 40024607 Review.
References
-
- Zhang D, Wu S, Pan S, Wang M, Wang Z, He Z, Zhang G, Cui F, Song Y, Li W, Shi X, Huang H, Xu H. Single-cell sequencing reveals heterogeneity between pancreatic adenosquamous carcinoma and pancreatic ductal adenocarcinoma with prognostic value. Front Immunol. 2022; 13:972298. 10.3389/fimmu.2022.972298 - DOI - PMC - PubMed
MeSH terms
Substances
LinkOut - more resources
Full Text Sources
Medical
