. 2024 Nov:77:103348.
doi: 10.1016/j.redox.2024.103348. Epub 2024 Sep 10.

TCF4 trinucleotide repeat expansions and UV irradiation increase susceptibility to ferroptosis in Fuchs endothelial corneal dystrophy

Affiliations

TCF4 trinucleotide repeat expansions and UV irradiation increase susceptibility to ferroptosis in Fuchs endothelial corneal dystrophy

Sanjib Saha et al. Redox Biol. 2024 Nov.

Abstract

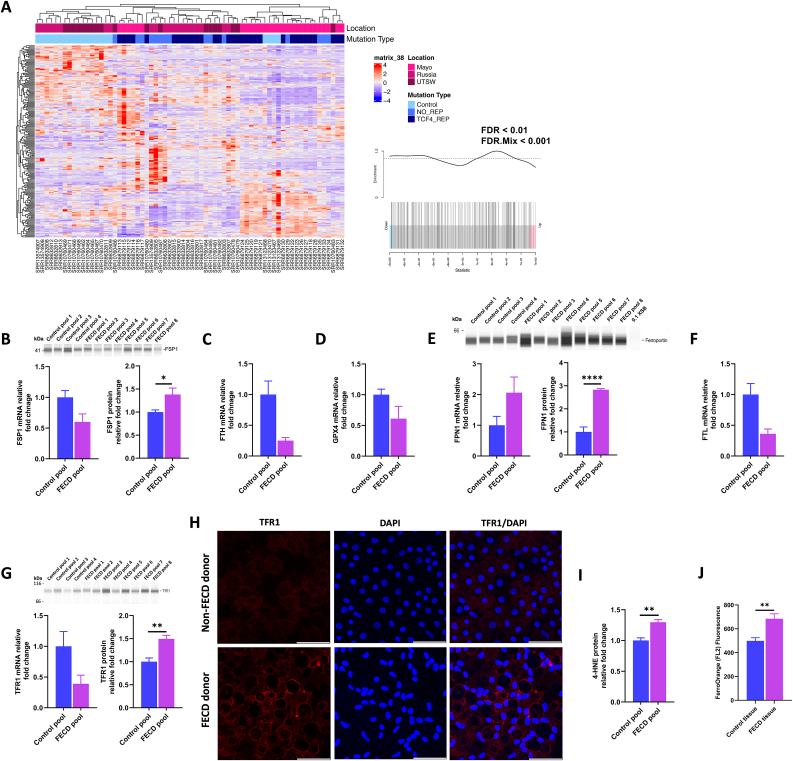
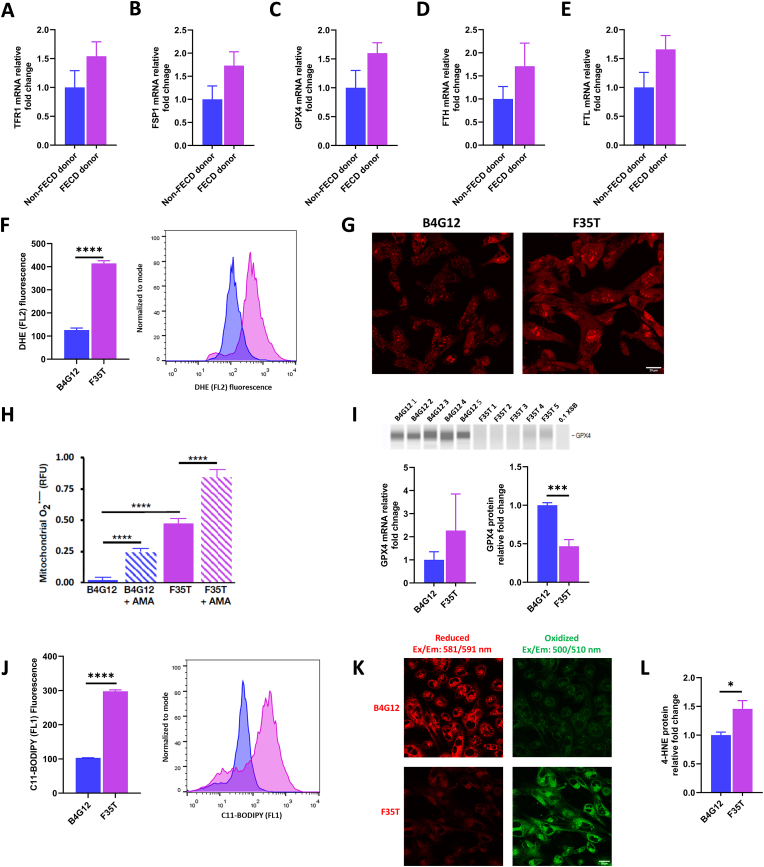
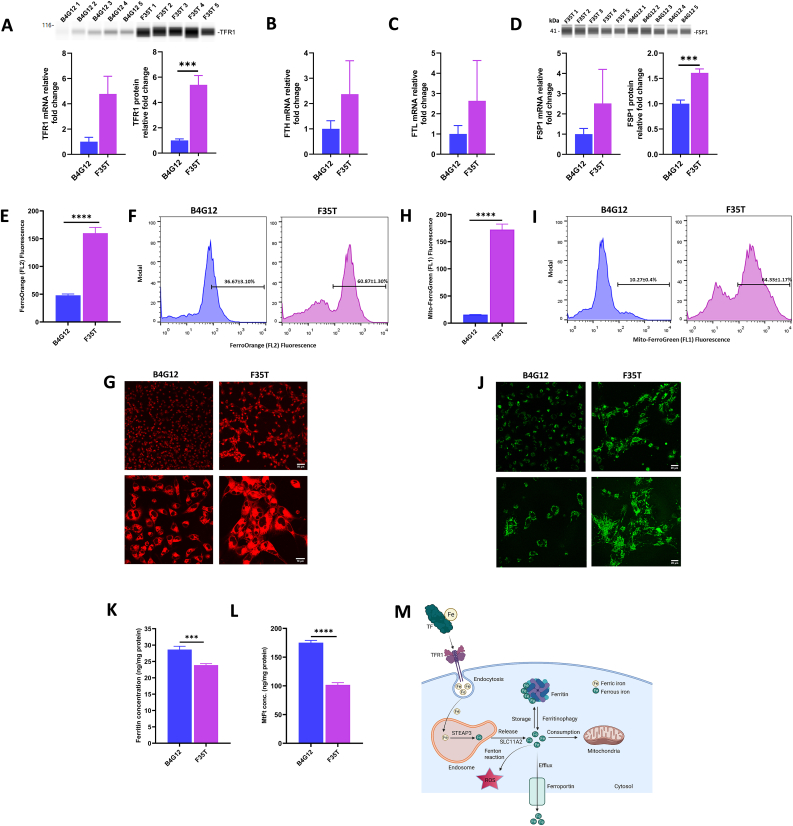
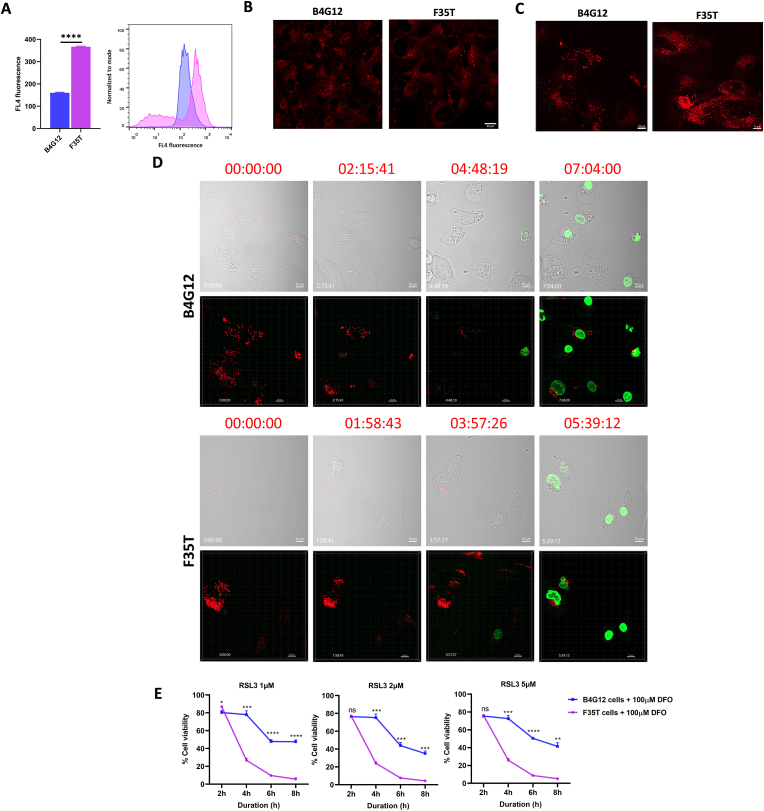
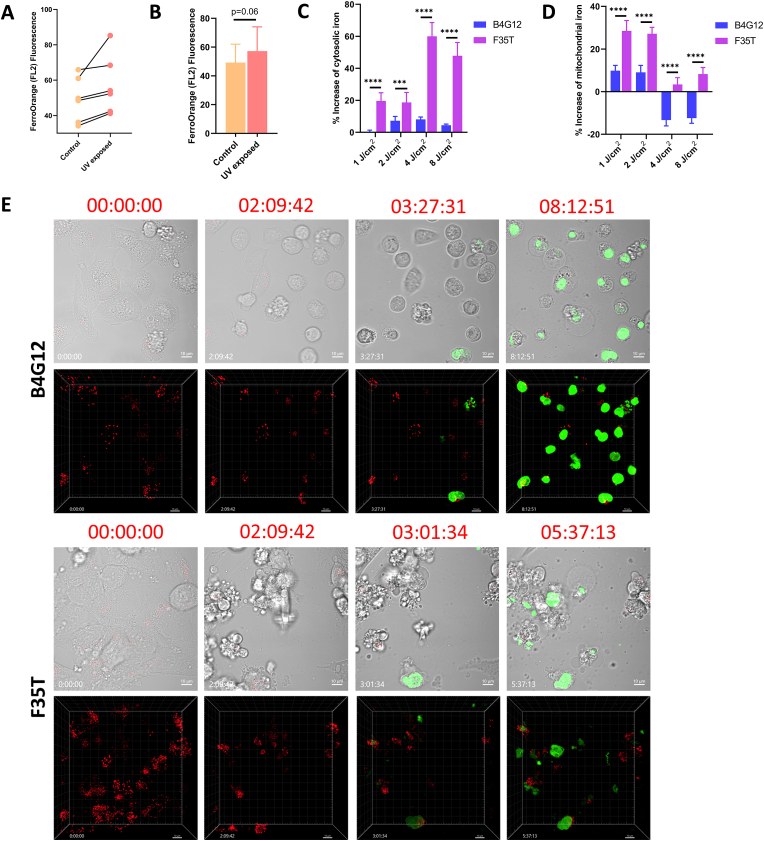
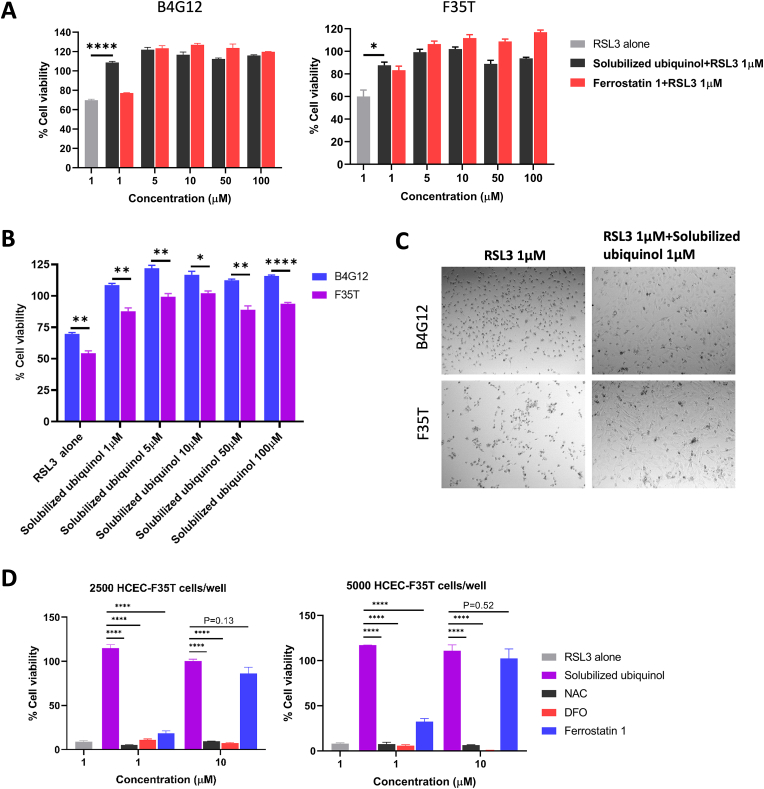
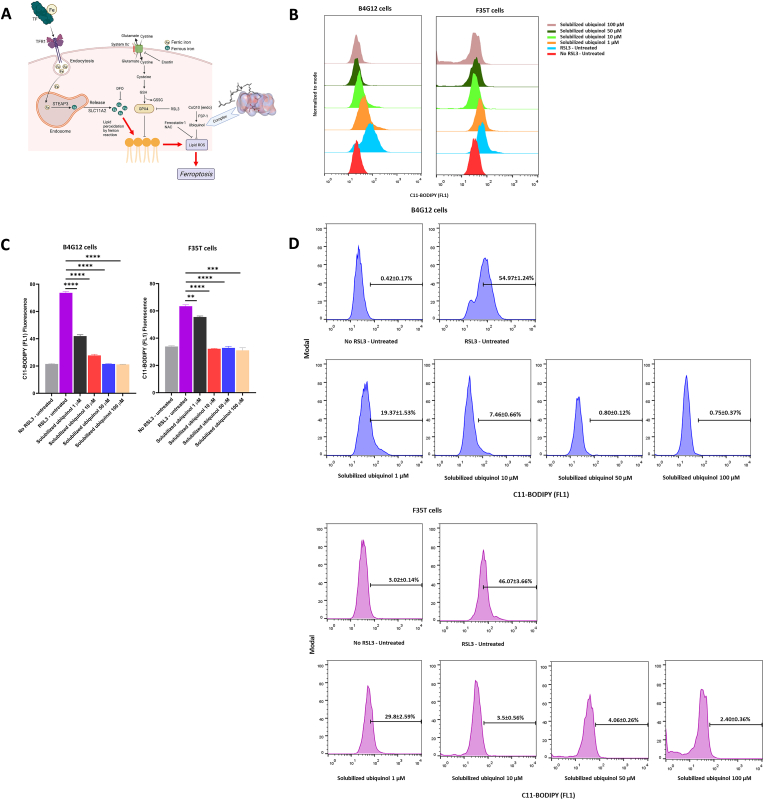
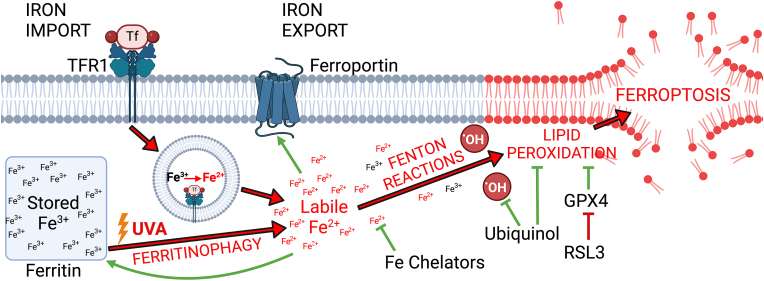
Fuchs endothelial corneal dystrophy (FECD), the leading indication for corneal transplantation in the U.S., causes loss of corneal endothelial cells (CECs) and corneal edema leading to vision loss. FECD pathogenesis is linked to impaired response to oxidative stress and environmental ultraviolet A (UVA) exposure. Although UVA is known to cause nonapoptotic oxidative cell death resulting from iron-mediated lipid peroxidation, ferroptosis has not been characterized in FECD. We investigated the roles of genetic background and UVA exposure in causing CEC degeneration in FECD. Using ungenotyped FECD patient surgical samples, we found increased levels of cytosolic ferrous iron (Fe2+) and lipid peroxidation in end-stage diseased tissues compared with healthy controls. Using primary and immortalized cell cultures modeling the TCF4 intronic trinucleotide repeat expansion genotype, we found altered gene and protein expression involved in ferroptosis compared to controls including elevated levels of Fe2+, basal lipid peroxidation, and the ferroptosis-specific marker transferrin receptor 1. Increased cytosolic Fe2+ levels were detected after physiologically relevant doses of UVA exposure, indicating a role for ferroptosis in FECD disease progression. Cultured cells were more prone to ferroptosis induced by RSL3 and UVA than controls, indicating ferroptosis susceptibility is increased by both FECD genetic background and UVA. Finally, cell death was preventable after RSL3 induced ferroptosis using solubilized ubiquinol, indicating a role for anti-ferroptosis therapies in FECD. This investigation demonstrates that genetic background and UVA exposure contribute to iron-mediated lipid peroxidation and cell death in FECD, and provides the basis for future investigations of ferroptosis-mediated disease progression in FECD.

Keywords: Corneal endothelium; Corneal transplant; Ferritin; Ferroptosis; Ferrous iron; Fuchs endothelial corneal dystrophy; Reactive oxygen species; Transferrin; Ubiquinol; Ultraviolet light.


Conflict of interest statement

Declaration of competing interest Sanjib Saha, Declarations of interest: none. Jessica M. Skeie, Declarations of interest: none. Gregory A. Schmidt, Declarations of interest: none. Tim Eggleston, Declarations of interest: none. Hanna Shevalye, Declarations of interest: none. Christopher S. Sales, Declarations of interest: none. Pornpoj Phruttiwanichakun, Declarations of interest: none. Apurva Dusane, Declarations of interest: none. Matthew G. Field, Declarations of interest: none. Tommy A. Rinkoski, Declarations of interest: none. Michael P. Fautsch, Declarations of interest: none. Keith H. Baratz, Declarations of interest: none. Madhuparna Roy, Declarations of interest: none. Albert S. Jun, Declarations of interest: none. Chandler Pendleton, Declarations of interest: none. Aliasger K. Salem, Declarations of interest: none. Mark A. Greiner, Declarations of interest: none.

Figures

Fig. 1
Fig. 1
FECD surgical tissues show key markers of ferroptosis. (A) Heatmap with hierarchical clustering for 211 genes from the FerrDB database that includes known driver, suppressor, and marker ferroptosis genes that were expressed in the RNA-Seq datasets. For each plot, “pearson” was used for the clustering distance and “complete” for the hierarchical clustering method. The location where the representative dataset was collected (Mayo, Russia, or UTSW) and mutation type (Control, no TCF4 repeats [No_Rep] or TCF repeats [TCF4_Rep]) are shown for each sample. (B) FSP1 mRNA and protein expression in FECD and control tissues. (C)FTH mRNA expression in control and FECD tissues. (D)GPX4 mRNA expression in FECD and control human tissues. (E) Ferroportin (FPN1) mRNA and protein expression in FECD and control tissues. (F) FTL mRNA expression in control and FECD tissues. (G) TFR1 mRNA and protein expression in control and FECD surgical tissues. (H) Representative immunohistochemistry images of TFR1 localization in non-FECD and FECD donor cornea tissues. (I) 4-HNE protein expression in human surgical samples from patients with FECD (n = 8). All data of mRNA and protein expression are shown as mean ± SEM for n = 12 (Control tissues, 8 pools of 3, each pool contained 3 tissues) and n = 24 (FECD tissues, 8 pools of 3, each pool contained 3 tissues). All the statistical comparisons were conducted using two-tailed, unpaired Student's t-test, ∗p < 0.05, ∗∗p < 0.01, ∗∗∗∗p < 0.0001. Relative gene expression is normalized by β-actin. (J) Cytosolic Fe2+ in primary CECs isolated from healthy human donor corneas (n = 11, each cornea divided into 2 sections) and FECD surgical explants (n = 7). Data are shown as mean ± SEM; ∗∗p < 0.01, Student's t-test.
Fig. 2
Fig. 2
FECD primary and immortalized cell cultures showkey markersof ferroptosis. (A)TFR1 mRNA expression in non-FECD and FECD donor expanded TCF4 repeat expansion primary cells. (B) FSP1 mRNA expression in primary cells. (C) GPX4 mRNA expression in human expanded TCF4 repeat expansion primary cells. (D)FTH mRNA expression in non-FECD and FECD donor expanded TCF4 repeat expansion primary cells. (E)FTL mRNA expression in non-FECD and FECD donor primary cells. (F) Representation of median of the fluorescence of DHE showing significant difference in ROS between indicated cells. DHE (FL2 fluorescence) peak of F35T cells shifts to right when compared to B4G12 cells. (G) Representative confocal images showing fluorescence of DHE indicating ROS in the indicated cell lines. (H) Mitochondrial ROS quantified by MitoROS 580 dye in the indicated cells. Data are shown as mean ± SEM; n = 3; ∗∗∗∗p < 0.0001, one-way ANOVA, followed by Tukey's post-hoc test. AMA indicates antimycin-A. (I)GPX4 mRNA and protein expression in HCEC-B4G12 and F35T cells. (J) Basal level of lipid peroxidation in HCEC-B4G12 and F35T cells quantified by C11-BODIPY fluorescent probe using flow cytometry. Comparisons of median fluorescence of C11-BODIPY detected in HCEC-B4G12 and F35T cells (10,000 cells). Data are shown as mean ± SEM; n = 3; ∗∗∗∗p < 0.0001, Student's t-test. C11-BODIPY (FL1 fluorescence) peak of F35T cells shifts to right when compares to B4G12 cells. (K) Representative confocal images showing fluorescence of reduced and oxidized dye in the indicated cell lines. (L) 4-HNE protein expression in HCEC-B4G12 and F35T cells. All data of mRNA and protein expression are shown as mean ± SEM for n = 5–9 (B4G12), n = 5–7 (F35T) and n = 4 (both non-FECD and FECD donor primary cells). All the statistical comparisons were conducted using two-tailed, unpaired Student's t-test, ∗∗∗p < 0.001. Relative gene expression is normalized by β-actin.
Fig. 3
Fig. 3
FECD immortalized cell culture showskey gene and protein expression changes related to ferroptosis. (A)TFR1 mRNA and protein expression in HCEC-B4G12 and F35T cells. (B)FTH mRNA expression in indicated cells. (C)FTL mRNA expression in indicated cells. (D) FSP1 mRNA and protein expression in the indicated cells. All data of mRNA and protein expression are shown as mean ± SEM for n = 5–9 (B4G12) and n = 5–7 (F35T). All the statistical comparisons were conducted using two-tailed, unpaired Student's t-test, ∗∗∗p < 0.001, ∗∗∗∗p < 0.0001. Relative gene expression is normalized by β-actin. (E) Representation of median of the fluorescence of FerroOrange showing significant difference in cytosolic Fe2+ between indicated cells. B4G12 and F35T cells were stained with FerroOrange fluorescent probe to quantify cytosolic Fe2+ by flow cytometry. A minimum 10,000 cells were quantified for measuring the fluorescence. (F) Cell population distribution after staining with FerroOrange showing cytosolic Fe2+ content. (G) Representation of confocal microscopy images of HCEC-B4G12 and F35T cells stained with FerroOrange fluorescent probe showing and comparing cytosolic Fe2+. (H) Representation of median of the fluorescence of Mito-FerroGreen showing significant difference in mitochondrial Fe2+ between indicated cells. HCEC-B4G12 and F35T cells were stained with Mito-FerroGreen fluorescent probe to quantify mitochondrial Fe2+ by flow cytometry. A minimum of 10,000 cells were quantified for measuring fluorescence. (I) Cell population distribution after staining with Mito-FerroGreen showing mitochondrial Fe2+ content. (J) Representation of confocal microscopy images of HCEC-B4G12 and F35T cells stained with Mito-FerroGreen fluorescent probe showing and comparing mitochondrial Fe2+. Data are represented as means ± SEM; n = 3; unpaired Student's t-test, ∗∗∗∗p < 0.0001. (K) Quantification of human ferritin (Ft) by ELISA in protein from HCEC-B4G12 and F35T cells. The human ferritin levels are presented as mean ± SEM; n = 9 (3 biological replicates × 3 technical replicates); ∗∗∗p < 0.001, Student's t-test. (L) Quantification of mitochondrial ferritin (FtMt) by ELISA in protein from HCEC-B4G12 and F35T cells. The mitochondrial ferritin levels are presented as mean ± SEM; n = 9 (3 biological replicates × 3 technical replicates); ∗∗∗∗p < 0.0001, Student's t-test. (M) Representation of cellular iron metabolism in ferroptosis process.
Fig. 4
Fig. 4
FECD demonstrates higher lipid droplets and higher susceptibility to ferroptosis induced by RSL3. (A) Representation of median fluorescence of LipidSpot™ 610 showing significant difference in ROS between indicated cell lines. LipidSpot™ 610 (FL4 fluorescence) peak of F35T cells shifts to right when compared to B4G12 cells. (B) Representative confocal images showing fluorescence of LipidSpot™ 610 indicating lipid droplets in the indicated cell lines. In flow cytometer analysis, data are shown as mean ± SEM; n = 9 (3 biological replicates × 3 technical replicates); ∗∗∗∗p < 0.0001, Student's t-test. (C) Representative confocal images showing RSL3 induced lipid droplets in the indicated cells. (D) Time lapse confocal images of ferroptosis events induced by RSL3. (E) Deferoxamine (DFO) iron chelation assay where HCEC-B4G12 and F35T cells were treated with DFO for 24h and then challenged with RSL3 at 1, 2 and 5 μM for different durations of 2, 4, 6 and 8h. Cell viability was measured by MTS assay. Data are represented as mean ± SEM for three biological replicates; Student's t-test, ∗p < 0.05, ∗∗p < 0.01, ∗∗∗p < 0.001, ∗∗∗∗p < 0.0001.
Fig. 5
Fig. 5
FECD demonstrates higher iron overload and higher susceptibility to ferroptosis induced by UVA irradiation. (A) Cytosolic Fe2+ release in human donor corneas upon UVA irradiation at 5 J/cm2. Primary endothelial cells were isolated after UVA irradiation and stained with FerroOrange fluorescent probe. The experiment was conducted pairwise, where the left cornea was used as control and the right cornea was exposed to UVA. Data are shown as geometric mean FerroOrange (FL2 fluorescence) signals; n = 6 paired biological samples. (B) Comparison of geometric mean of FerroOrange (FL2 fluorescence) signals. Data are mean ± SEM, Paired two-tailed Student's t-test and n = 6 paired biological samples. (C) Representation of percent increase of labile cytosolic Fe2+ after UVA irradiation at the fluence of 1, 2, 4 and 8 J/cm2. Indicated cells were stained with FerroOrange fluorescent probe immediately post-UVA (Data are shown as mean ± SEM, n = 9; 3 biological replicates × 3 technical replicates; ∗∗∗p < 0.001, ∗∗∗∗p < 0.0001, one-way ANOVA, followed by Tukey's post-hoc test). (D) Representation of percent increase of mitochondrial Fe2+ after UVA irradiation at the fluence of 1, 2, 4 and 8 J/cm2. Indicated cells were stained with Mito-FerroGreen fluorescent probe immediately post-UVA (Data are shown as mean ± SEM, n = 9; 3 biological replicates × 3 technical replicates; ∗∗∗∗p < 0.0001, one-way ANOVA, followed by Tukey's post-hoc test.). (E) Time lapse confocal images of ferroptosis events induced by UVA irradiation at 1.5 J/cm2. Representative confocal images showing disappearance of lipid droplets at the time of ferroptosis induced death in the indicated cells. SYTOX green indicates cell death. (For interpretation of the references to colour in this figure legend, the reader is referred to the Web version of this article.)
Fig. 6
Fig. 6
Solubilized ubiquinol gives protection against ferroptosis. (A) Cell viability assay was performed by quantifying LDH release after treatment with solubilized ubiquinol at different concentrations of 1, 5, 10, 50, and 100 μM. Following solubilized ubiquinol treatment, HCEC-B4G12 and F35T cells were challenged with 1 μM of RSL3 for 24 h. Data are shown as mean ± SEM; n = 3; ∗∗∗∗p < 0.0001, Student's t-test against RSL3 alone group. (B) Comparisons of cell viability of HCEC-B4G12 and F35T cells following the treatment of solubilized ubiquinol. Solubilized ubiquinol was comparatively less effective in F35T cells, indicating more ferroptosis compared to B4G12 cells. Data are shown as mean ± SEM; n = 3; ∗p < 0.05, ∗∗p < 0.01, ∗∗∗∗p < 0.0001, Student's t-test. (C) Representative light microscopy images showing that solubilized ubiquinol at 1 μM dose inhibited RSL3 induced ferroptosis in HCEC-B4G12 and F35T cells. (D) Solubilized ubiquinol outperforms NAC, DFO and ferrostatin-1 in protecting F35T cells against RSL3 induced cell death in ferroptosis assay. Data are shown as mean ± SEM, n = 3; ∗∗∗∗p < 0.0001, Student's t-test.
Fig. 7
Fig. 7
Solubilized ubiquinol gives protection against lipid peroxidation. (A) Schematic showing RSL3 induced ferroptosis and role of solubilized ubiquinol to prevent lipid peroxidation and ferroptosis. (B) Solubilized ubiquinol prevents lipid peroxidation in HCEC-B4G12 and F35T cells induced by RSL3 in dose dependent manner detected by the peak shift of C11-BODPY fluorescent probe in flow cytometer analysis. (C) C11-BODIPY fluorescence signals detected by flow cytometer following treatments with solubilized ubiquinol at different concentrations of 1, 10, 50 and 100 μM. Values are mean ± SEM; n = 3; ∗∗∗∗p < 0.0001, Student's t-test against RSL3-untreated group. (D) Representation of cell population undergoing RSL3 induced lipid peroxidation following solubilized ubiquinol treatment at the indicated concentrations in HCEC-B4G12 and F35T cells. Solubilized ubiquinol decreased the number of cells undergoing lipid peroxidation in a concentration dependent manner. Values are mean ± SEM; n = 3.
Fig. 8
Fig. 8
Summary ofthemolecular mechanism of ferroptosis in FECD. Iron enters the cell in ferric form via TFR1-mediated endocytosis. Ferritin stores the excess iron in ferric form, which is nontoxic. The ferric form of iron gets converted to the ferrous form in endosomes. When labile, ferrous iron gets released into the cytosol, it causes lipid peroxidation via Fenton chemistry. UVA irradiation can cause iron release from ferritin which increases the labile iron pool in the cytosol, as well as increases iron-mediated lipid peroxidation, a process known as ferroptosis. GPX4 is the key regulator of ferroptosis, preventing occurrence through scavenging lipid peroxides and reactive oxygen species (ROS). In this study, RSL3 was used to block GPX4 to induce ferroptosis. Ubiquinol, the reduced and active form of coenzyme Q10, is a potent ferroptosis inhibitor that works by scavenging ROS and modulating iron metabolism. Ubiquinol is an essential participant in the FSP1-CoQ10-NAD(P)H pathway, an independent system working in parallel with GPX4 and glutathione to suppress lipid peroxidation and ferroptosis by supporting FSP1 function. Other molecules like DFO and artesunate can prevent ferroptosis by quenching labile toxic ferrous iron, however, are not solely as effective as ubiquinol in preventing ferroptosis.

References

    1. Ołdak M., et al. Fuchs endothelial corneal dystrophy: strong association with rs613872 not paralleled by changes in corneal endothelial TCF4 mRNA level. BioMed Res. Int. 2015;2015 doi: 10.1155/2015/640234. (in eng) - DOI - PMC - PubMed
    1. Uchida T., Sakai O., Imai H., Ueta T. Role of glutathione peroxidase 4 in corneal endothelial cells. Curr. Eye Res. 2017/03/04 2017;42(3):380–385. doi: 10.1080/02713683.2016.1196707. - DOI - PubMed
    1. Lovatt M., Adnan K., Peh G.S.L., Mehta J.S. Regulation of oxidative stress in corneal endothelial cells by Prdx6. Antioxidants. Dec 4 2018;7(12) doi: 10.3390/antiox7120180. (in eng) - DOI - PMC - PubMed
    1. Lovatt M., Adnan K., Kocaba V., Dirisamer M., Peh G.S.L., Mehta J.S. Peroxiredoxin-1 regulates lipid peroxidation in corneal endothelial cells. Redox Biol. 2020;30 doi: 10.1016/j.redox.2019.101417. (in eng) - DOI - PMC - PubMed
    1. Eye Bank Association of America . vol. 2021. 2020. (2019 Eye Banking Statistical Report). Washington, DC.

Publication types

MeSH terms

LinkOut - more resources