

Systemic complications of Aicardi Goutières syndrome using real-world data
- PMID: 39332260
- PMCID: PMC12302025
- DOI: 10.1016/j.ymgme.2024.108578
Systemic complications of Aicardi Goutières syndrome using real-world data
Abstract
Objective: Aicardi Goutières Syndrome (AGS) is a rare genetic interferonopathy associated with diverse multisystemic complications. A critical gap exists in our understanding of its longitudinal, systemic disease burden, complicated by delayed diagnosis. To address this need, real-world data extracted from existing medical records were used to characterize the longitudinal disease burden.
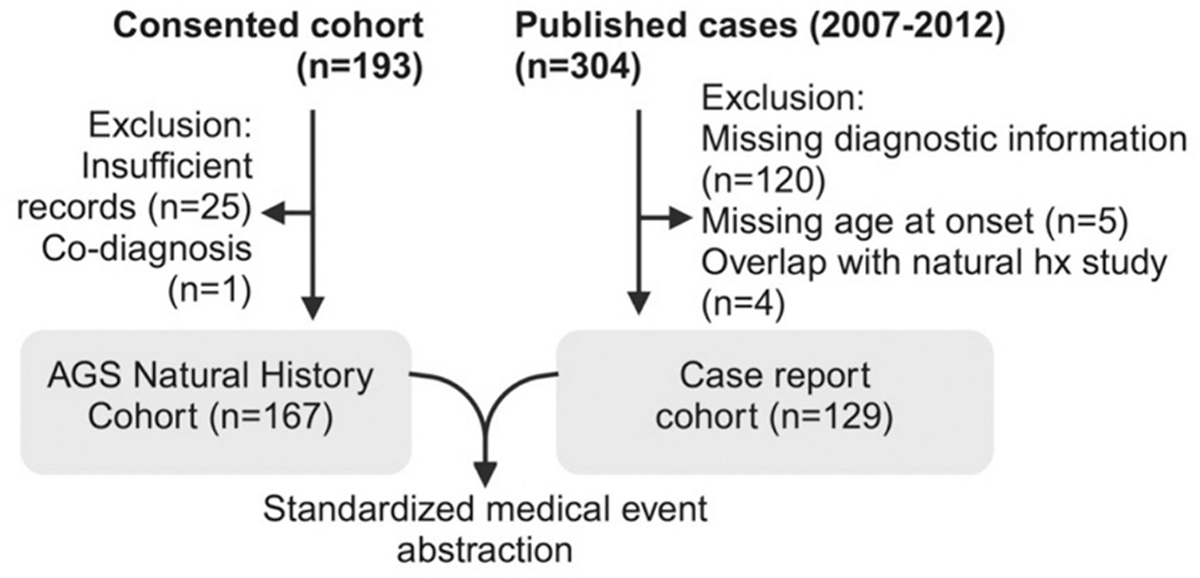
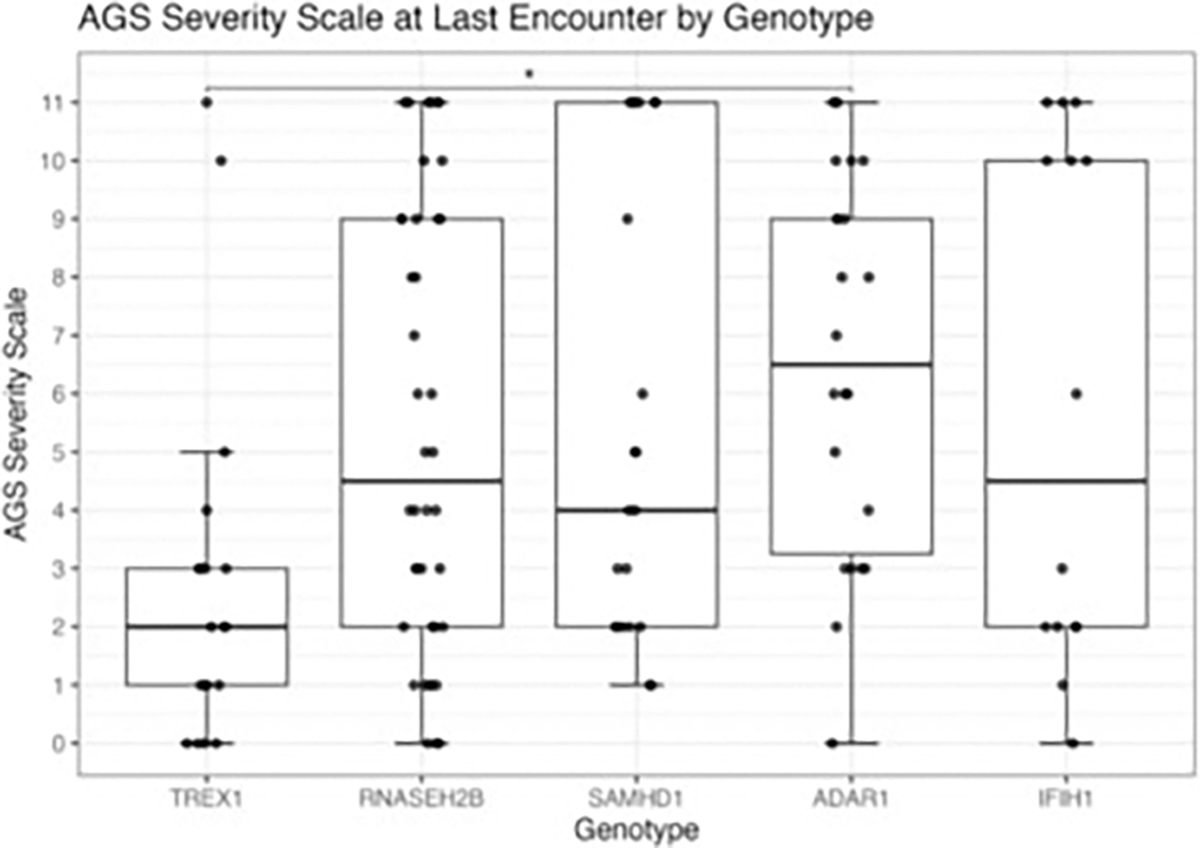
Methods: All subjects (n = 167) with genetically confirmed AGS enrolled in the Myelin Disorders Biorepository Project (MDBP) were included. As available in medical records, information was collected on subject demographics, age of onset, and disease complications. Information from published cases of AGS (2007-2022; n = 129) with individual-level data was also collected. Neurologic severity at the last available encounter was determined by retrospectively assigning the AGS Severity Scale [severe (0-3), moderate (4-8), and mild (9-11)].
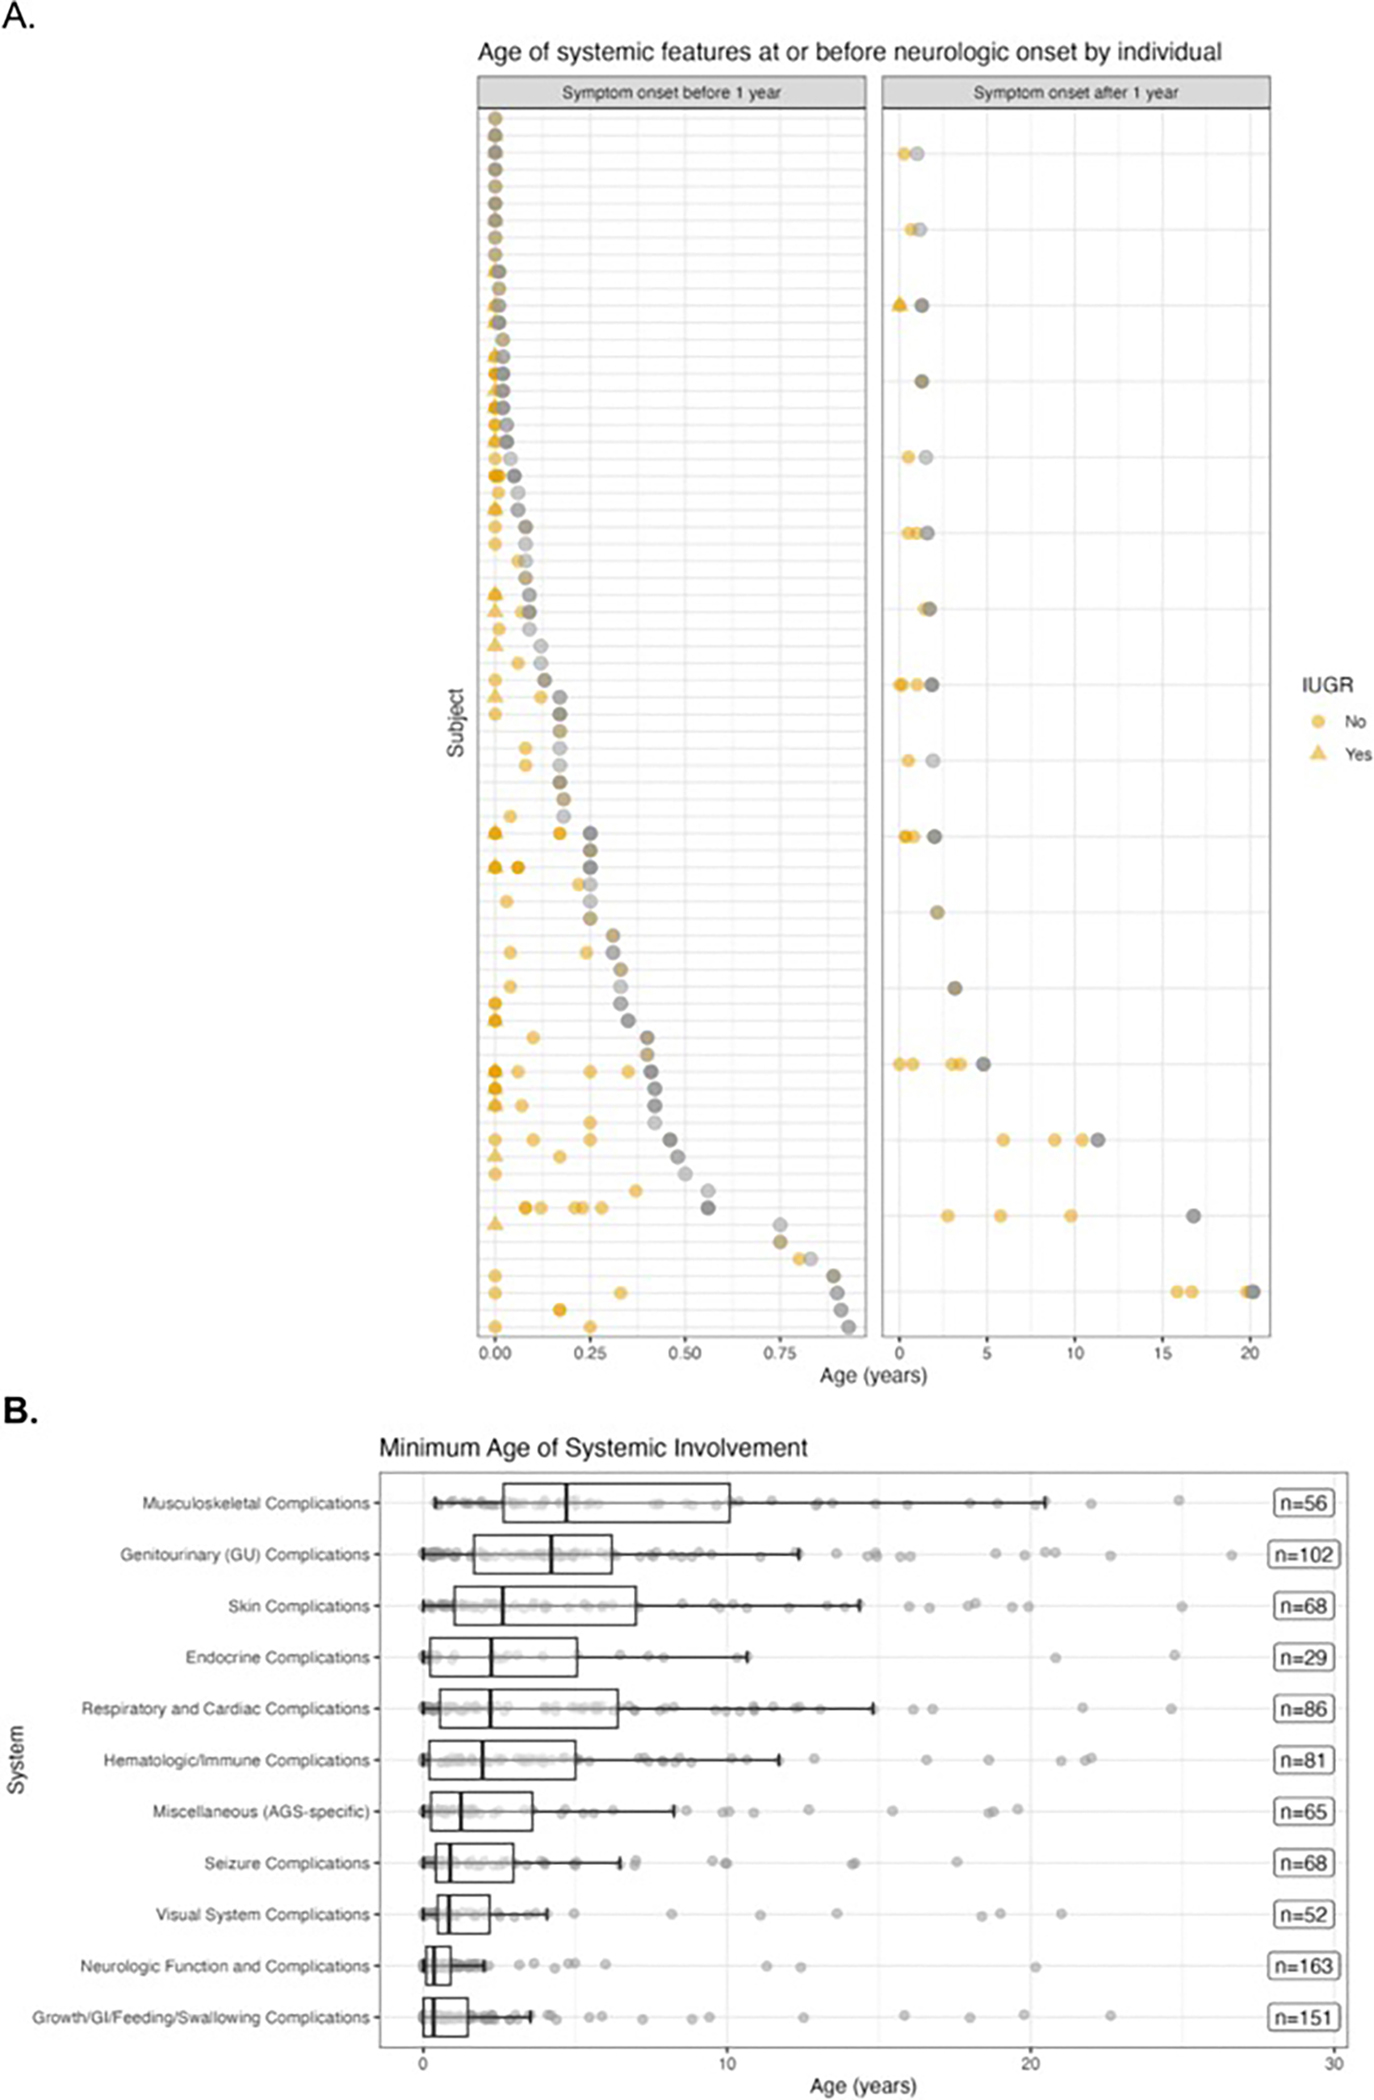
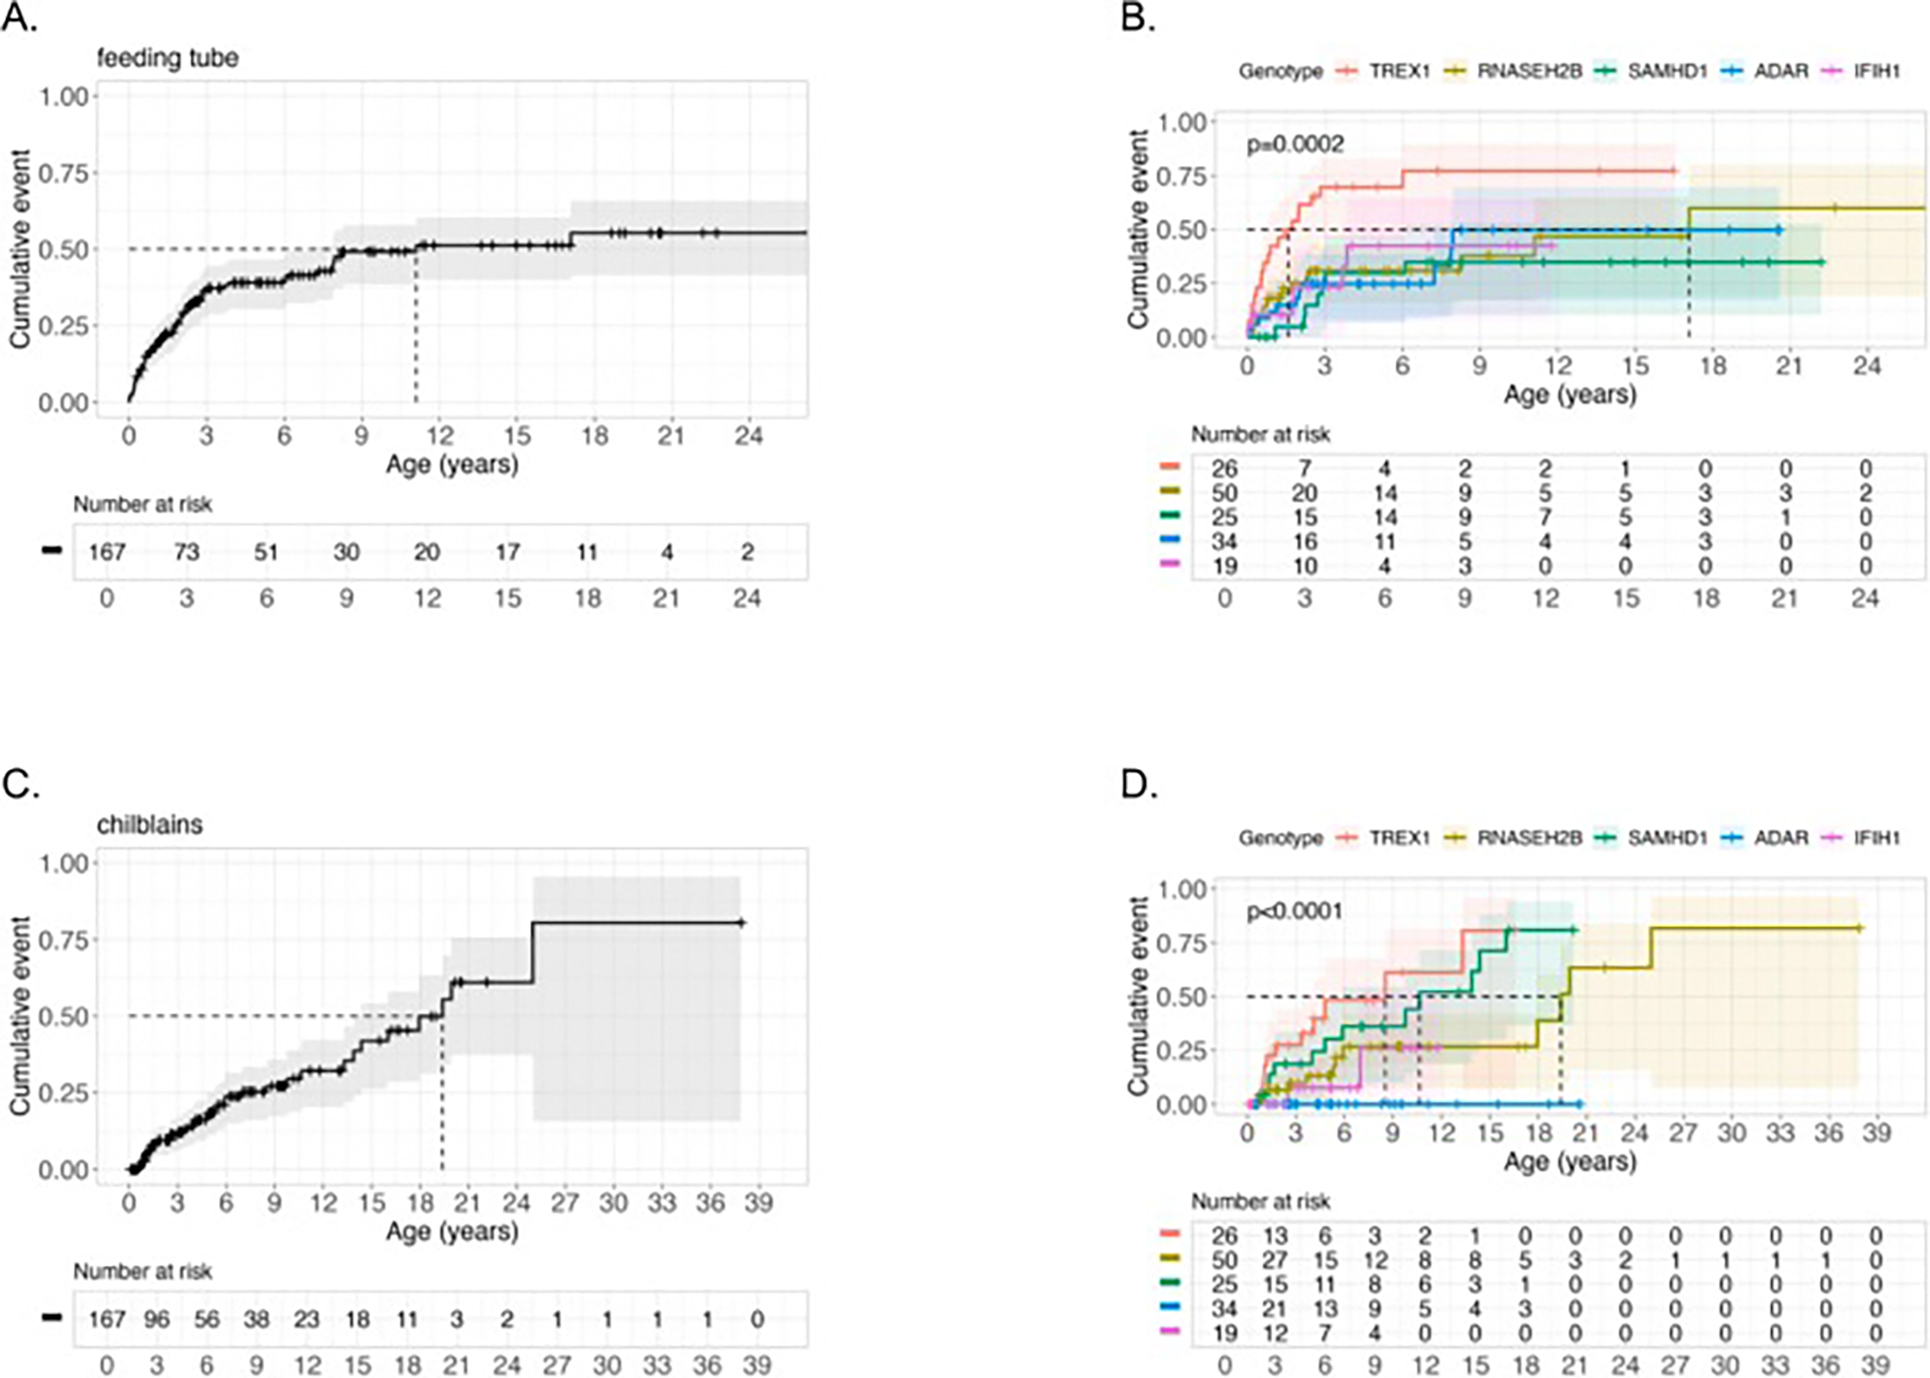
Results: The genotype frequency in the natural history cohort was TREX1 (n = 26, 15.6 %), RNASEH2B (n = 50, 29.9 %), RNASEH2C (n = 3, 1.8 %), RNASEH2A (n = 7, 4.2 %), SAMHD1 (n = 25, 15.0 %), ADAR (n = 34, 20.4 %), IFIH1 (n = 19, 11.4 %), and RNU7-1 (n = 3, 1.8 %). The median age of systemic onset was 0.15 years [IQR = 0.67 years; median range by genotype: 0 (TREX1) - 0.62 (ADAR) years], while the median neurological onset was 0.33 years [IQR = 0.82 years; median range by genotype: 0.08 (TREX1) - 0.90 (ADAR) year]. The most common early systemic complications were gastrointestinal, including dysphagia or feeding intolerance (n = 124) and liver abnormalities (n = 67). Among postnatal complications, thrombocytopenia appeared earliest (n = 29, median 0.06 years). Tone abnormalities (axial hypotonia: n = 145, 86.8 %; dystonia: n = 123, 73.7 %), irritability (n = 115, 68.9 %), and gross motor delay (n = 112, 7.1 %) emerged as the most prevalent neurological symptoms. Previously published case reports demonstrated similar patterns. The median AGS score for the entire cohort was 4 (IQR = 7). The most severe neurologic phenotype occurred in TREX1-related AGS (n = 19, median AGS severity score 2, IQR = 2). Time to feeding tube placement, chilblains, early gross motor delay, early cognitive delay, and motor regression were significantly associated with genotype (Fleming-Harrington log-rank: p = 0.0002, p < 0.0001, p = 0.0038, p < 0.0001, p = 0.0001, respectively). Microcephaly, feeding tube placement, and seizures were associated with lower AGS scores (All: Wilcoxon rank sum test, p < 0.0001). Among the qualifying case reports (n = 129), tone abnormalities were the most prevalent disease feature, with spastic quadriplegia reported in 37 of 96 cases (38.5 %) and dystonia in 30 of 96 cases (31.2 %).
Conclusions: AGS is a heterogeneous disease with multi-organ system dysfunction that compounds throughout the clinical course, resulting in profound neurological and extra-neurological disease impact. Systemic symptoms precede neurologic disease features in most cases. Disease onset before the age of one year, microcephaly, feeding tube placement, and seizures were associated with worse neurological outcomes. This work will inform evidence-based clinical monitoring guidelines and clinical trial design.
Keywords: Aicardi Goutières syndrome; Clinical manifestations; Genotype; Interferonopathy; Leukodystrophy.
Copyright © 2024. Published by Elsevier Inc.
Conflict of interest statement
Declaration of competing interest The authors declare that they have no known competing financial interests or personal relationships that influence the work reported in this paper. AV receives research support from Gilead Sciences Inc., Homology Medicines, Eli Lilly and Company, Shire/Takeda, Ionis, Biogen, and Ilumina Inc. She is a consultant to Orchard Pharmaceutical. She has provided unpaid scientific advisory services to Illumina, Shire/Takeda, Ionis, and Biogen, in addition to the research support she receives. AV receives grants and in-kind support for research from Eli Lilly, Gilead, Takeda, Illumina, Biogen, Boehringer Ingelhiem, Sanofi, Sana, Myrtelle, Affinia, Homology, Ionis, Passage Bio, and Orchard Therapeutics. AV serves on the scientific advisory boards of the MLD Foundation, European Leukodystrophy Association, and the United Leukodystrophy Foundation and in an unpaid capacity for Takeda, Ionis, Biogen, and Illumina. LAA is a consultant for Takeda, Biogen, and Orchard Therapeutics. LE serves on the Ionis Pharmaceuticals Board of Directors.
Figures


References
-
- Uggenti C, Lepelley A, Depp M, Badrock AP, Rodero MP, El-Daher MT, Rice GI, Dhir S, Wheeler AP, Dhir A, Albawardi W, Frémond ML, Seabra L, Doig J, Blair N, Martin-Niclos MJ, Della Mina E, Rubio-Roldán A, García-Pérez JL, Sproul D, Rehwinkel J, Hertzog J, Boland-Auge A, Olaso R, Deleuze JF, Baruteau J, Brochard K, Buckley J, Cavallera V, Cereda C, De Waele LMH, Dobbie A, Doummar D, Elmslie F, Koch-Hogrebe M, Kumar R, Lamb K, Livingston JH, Majumdar A, Lorenço CM, Orcesi S, Peudenier S, Rostasy K, Salmon CA, Scott C, Tonduti D, Touati G, Valente M, van der Linden H Jr, Van Esch H, Vermelle M, Webb K, Jackson AP, Reijns MAM, Gilbert N, Crow YJ, cGAS-mediated induction of type I interferon due to inborn errors of histone pre-mRNA processing, Nat. Genet. 52 (2020) 1364–1372. - PubMed
-
- Crow YJ, Shetty J, Livingston JH, Treatments in Aicardi-Goutières syndrome, Dev. Med. Child Neurol. 62 (2020) 42–47. - PubMed
-
- Piccoli C, Bronner N, Gavazzi F, Dubbs H, De Simone M, De Giorgis V, Orcesi S, Fazzi E, Galli J, Masnada S, Tonduti D, Varesio C, Vanderver A, Vossough A, Adang L, Late-onset Aicardi-Goutierès syndrome: a characterization of presenting clinical features, Pediatr. Neurol. 115 (2021) 1–6. - PMC - PubMed
-
- Crow YJ, Chase DS, Lowenstein Schmidt J, Szynkiewicz M, Forte GM, Gornall HL, Oojageer A, Anderson B, Pizzino A, Helman G, Abdel-Hamid MS, Abdel-Salam GM, Ackroyd S, Aeby A, Agosta G, Albin C, Allon-Shalev S, Arellano M, Ariaudo G, Aswani V, Babul-Hirji R, Baildam EM, Bahi-Buisson N, Bailey KM, Barnerias C, Barth M, Battini R, Beresford MW, Bernard G, Bianchi M, Billette de Villemeur T, Blair EM, Bloom M, Burlina AB, Carpanelli ML, Carvalho DR, Castro-Gago M, Cavallini A, Cereda C, Chandler KE, Chitayat DA, Collins AE, sierra Corcoles C, Cordeiro NJ, Crichiutti G, Dabydeen L, Dale RC, D’Arrigo S, De Goede CG, De Laet C, De Waele LM, Denzler I, Desguerre I, Devriendt K, Di Rocco M, Fahey MC, Fazzi E, Ferrie CD, Figueiredo A, Gener B, Goizet C, Gowrinathan NR, Gowrishankar K, Hanrahan D, Isidor B, Kara B, Khan N, King MD, Kirk EP, Kumar R, Lagae L, Landrieu P, Lauffer H, Laugel V, La Piana R, Lim MJ, Lin JP, Linnankivi T, Mackay MT, Marom DR, Marques Lourenco C, McKee SA, Moroni I, Morton JE, Moutard ML, Murray K, Nabbout R, Nampoothiri S, Nunez-Enamorado N, Oades PJ, Olivieri I, Ostergaard JR, Perez-Duenas B, Prendiville JS, Ramesh V, Rasmussen M, Regal L, Ricci F, Rio M, Rodriguez D, Roubertie A, Salvatici E, Segers KA, Sinha GP, Soler D, Spiegel R, Stodberg TI, Straussberg R, Swoboda KJ, Suri M, Tacke U, Tan TY, te Water Naude J, Wee Teik K, Thomas MM, Till M, Tonduti D, Valente EM, Van Coster RN, van der Knaap MS, Vassallo G, Vijzelaar R, Vogt J, Wallace GB, Wassmer E, Webb HJ, Whitehouse WP, Whitney RN, Zaki MS, Zuberi SM, Livingston JH, Rozenberg F, Lebon P, Vanderver A, Orcesi S, Rice GI, Characterization of human disease phenotypes associated with mutations in TREX1, RNASEH2A, RNASEH2B, RNASEH2C, SAMHD1, ADAR, and IFIH1, Am. J. Med. Genet. A vol. 167a (2015) 296–312. - PMC - PubMed
MeSH terms
Substances
Supplementary concepts
Grants and funding
LinkOut - more resources
Full Text Sources
Medical
Research Materials
Miscellaneous
