. 2024 Oct 8;19(10):1379-1388.
doi: 10.1016/j.stemcr.2024.08.011. Epub 2024 Sep 26.

Functionally redundant roles of ID family proteins in spermatogonial stem cells

Affiliations

Functionally redundant roles of ID family proteins in spermatogonial stem cells

Hue M La et al. Stem Cell Reports. .

Abstract

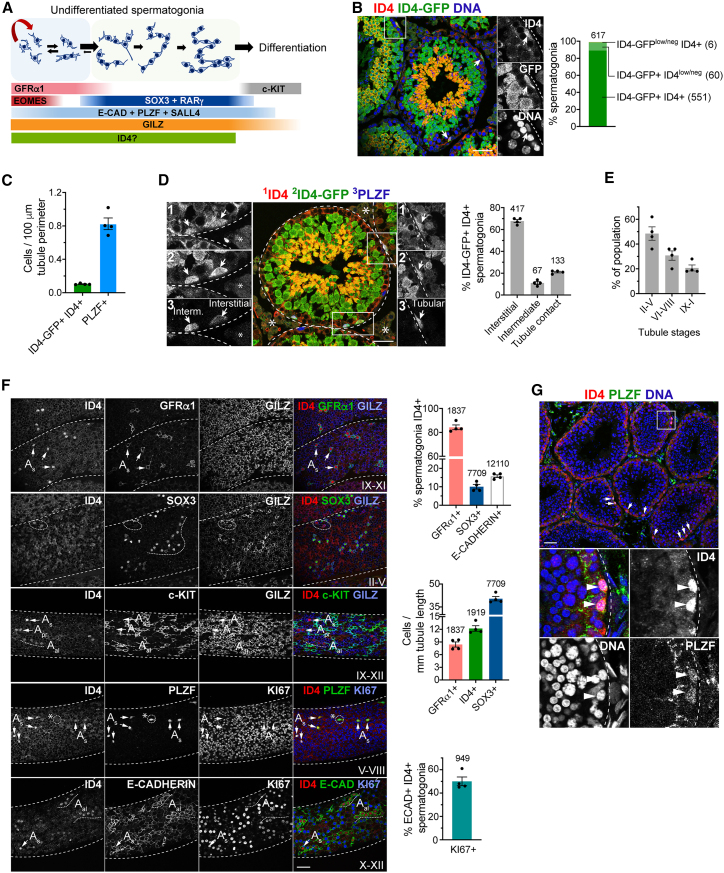
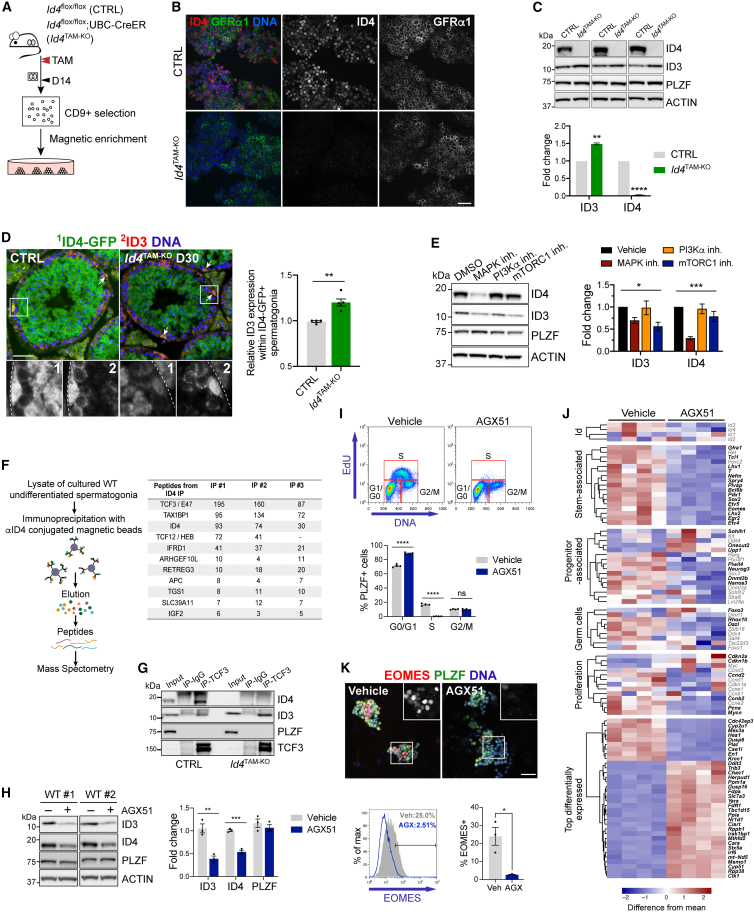
Spermatogonial stem cells (SSCs) are essential for sustained sperm production, but SSC regulatory mechanisms and markers remain poorly defined. Studies have suggested that the Id family transcriptional regulator Id4 is expressed in SSCs and involved in SSC maintenance. Here, we used reporter and knockout models to define the expression and function of Id4 in the adult male germline. Within the spermatogonial pool, Id4 reporter expression and inhibitor of DNA-binding 4 (ID4) protein are found throughout the GFRα1+ fraction, comprising the self-renewing population. However, Id4 deletion is tolerated by adult SSCs while revealing roles in meiotic spermatocytes. Cultures of undifferentiated spermatogonia could be established following Id4 deletion. Importantly, ID4 loss in undifferentiated spermatogonia triggers ID3 upregulation, and both ID proteins associate with transcription factor partner TCF3 in wild-type cells. Combined inhibition of IDs in cultured spermatogonia disrupts the stem cell state and blocks proliferation. Our data therefore demonstrate critical but functionally redundant roles of IDs in SSC function.

Keywords: ID genes; germline; spermatogonial stem cells; transcription factors.


Conflict of interest statement

Declaration of interests F.J.R. receives institutional support as a co-investigator and is subcontracted by Peter MacCallum Cancer Centre for an investigator-initiated trial, which receives funding from Sanofi/Regeneron Pharmaceuticals.

Figures

None
Graphical abstract
Figure 1
Figure 1
Expression pattern of Id4 in adult testis (A) Spermatogonial hierarchy and markers associated with Aundiff populations. (B) Representative IF of adult Id4IRES-GFP testis sections. Graph shows percentage overlap between GFP and ID4 expression (n= 4 mice). Arrows: GFP+ ID4+ spermatogonia. (C) Abundance of GFP+ ID4+ and PLZF+ spermatogonia in sections from B normalized to tubule perimeter. (D) Representative IF of adult Id4IRES-GFP testis sections showing localization of GFP+ ID4+ spermatogonia within tubules. Arrows: GFP+ ID4+ spermatogonia. Graph shows percentage of cells localized at distinct tubule regions (n = 4 mice). Numbered panels show grayscale images of the indicated markers. Asterisks: autofluorescent interstitial regions. (E) Distribution of GFP+ ID4+ spermatogonia to the indicated ranges of seminiferous tubule stages from D. 60 tubule cross-sections scored per animal (n = 4 mice). (F) Representative whole-mount IF of adult wild-type seminiferous tubules. Tubule stage is indicated. Selected Aundiff are highlighted with arrows. Graphs show the percentage of spermatogonial populations expressing ID4 (top), abundance of spermatogonial populations (middle), and percentage of ID4+ E-Cadherin+ spermatogonia KI67+ (bottom). 37–40 mm of tubules analyzed on one tubule face per animal (n = 4 mice). (G) Representative IF of adult marmoset testis sections (n = 2 animals). Arrows: ID4+ PLZF+ spermatogonia. Graphs show mean ± SEM. Total numbers of scored cells are indicted. Tubule basement membrane or profile is indicated with dashed lines. Insets show higher magnification details. Scale bars 50 μm.
Figure 2
Figure 2
Effects of inducible Id4 deletion on the adult male germline (A) Id4flox/flox UBC-CreER (Id4TAM-KO) and Cre-negative littermate control mice were treated with tamoxifen (TAM) and harvested at indicated time points. Lower panel: testis-to-body-weight ratio (n = 4 mice per genotype). (B) Representative flow cytometry of testis cells from Id4TAM-KO and control mice D14 post-TAM. Percentages of cells within gates are indicated. Graphs show percentage of cells E-Cadherin+ (top) and percentage of E-Cadherin+ cells α6-integrin+ c-KIT– (Aundiff) (n = 4 mice per genotype). (C) RT-qPCR of sorted Aundiff (E-Cadherin+ α6-integrin+ c-KIT–) from Id4TAM-KO and control mice D14 post-TAM (n = 3 controls, n = 4 Id4TAM-KO mice). (D) Representative IF of testis sections D14 and D30 post-TAM. Asterisks: degenerating tubules. Graphs show percentage of tubules degenerating (left) and abundance of PLZF+ spermatogonia (right) (n = 3 mice per genotype and time point, 50 tubule cross-sections scored per animal). (E) Representative whole-mount IF of tubules at indicated time points and associated graphs from analysis of GFRα1+ spermatogonia (n = 3 or n = 4 mice per genotype and time point). (F) Representative whole-mount IF of Id4TAM-KO and control tubules D30 post-TAM. Images taken along tubule length. Stages of seminiferous epithelium regions are indicated. Data are mean ± SEM. Insets show higher magnification details. Scale bars 50 μm (D, E), 100 μm (F). Dashed lines indicate tubule basement membrane or tubule profile. Significance by two-tailed Student’s t test (p > 0.05 [ns], p < 0.05, ∗∗∗p < 0.001, ∗∗∗∗p < 0.0001). See also Figure S1.
Figure 3
Figure 3
Functionally redundant roles of IDs in Aundiff (A) Method for generating Aundiff cultures from Id4TAM-KO and control mice D14 post-TAM. (B) Representative IF of Aundiff cultures (passage 6) from A. (C) Western blot analysis of independently derived Aundiff cultures. Graph shows ID3 and ID4 band intensities normalized to actin (n = 3 cultures per genotype from separate mice). (D) Representative IF of testis sections from control and Id4TAM-KO mice D30 post-TAM (n = 4 mice per genotype). Graph shows ID3 staining intensity in Id4-GFP+ spermatogonia from representative control and Id4TAM-KO mice (minimum 50 tubule cross-sections scored per sample). Dashed lines indicate tubule basement membrane. Arrows: GFP+ ID3+ spermatogonia. (E) Western blot of cultured Aundiff treated for 20 h with inhibitors to indicated pathways. Graph shows ID3 and ID4 band intensity normalized to actin (n = 3 independent cultures from separate mice). Significance by one-way ANOVA. (F) Identification of ID4 interacting proteins in cultured Aundiff using IP and mass spectrometry. Non-specific IgG was used as control. Table includes selected interaction partners from 3 independent IPs alongside numbers of MS2 spectra. Only proteins not identified in control IPs are included. (G) Confirmation of TCF3-ID interaction in cultured control and Id4-deleted Aundiff by IP and western blotting. (H) Western blot of cultured wild-type Aundiff treated with AGX51 for 20 h. Graph shows band intensities normalized to actin (n = 3 independent cultures from separate mice). (I) Cell cycle analysis of wild-type cultured Aundiff treated for 24 h with AGX51 by flow cytometry. Graph shows the percentage of PLZF+ cells in different phases (n = 4 independent cultures from separate mice). (J) RNA-seq of cultured wild-type Aundiff treated as in H (n = 4 independent cultures from separate mice). Genes with significant changes in expression are in bold in the heatmap (FDR<0.05, fold change>1.5). (K) Representative IF of cultured wild-type Aundiff treated as in H. Graph shows the percentage of PLZF+ cells EOMES+ (n = 3 independent cultures from separate mice). Insets show higher magnification details. Scale bars 50 μm. Data are mean ± SEM. Significance by two-tailed Student’s t test (p > 0.05 [ns], p < 0.05, ∗∗p < 0.01, ∗∗∗p < 0.001, ∗∗∗∗p < 0.0001). See also Figure S2.

References

    1. Best S.A., Hutt K.J., Fu N.Y., Vaillant F., Liew S.H., Hartley L., Scott C.L., Lindeman G.J., Visvader J.E. Dual roles for Id4 in the regulation of estrogen signaling in the mammary gland and ovary. Development. 2014;141:3159–3164. doi: 10.1242/dev.108498. - DOI - PubMed
    1. Bounpheng M.A., Dimas J.J., Dodds S.G., Christy B.A. Degradation of Id proteins by the ubiquitin-proteasome pathway. FASEB J. 1999;13:2257–2264. - PubMed
    1. Chan A.L., La H.M., Legrand J.M.D., Mäkelä J.A., Eichenlaub M., De Seram M., Ramialison M., Hobbs R.M. Germline Stem Cell Activity Is Sustained by SALL4-Dependent Silencing of Distinct Tumor Suppressor Genes. Stem Cell Rep. 2017;9:956–971. doi: 10.1016/j.stemcr.2017.08.001. - DOI - PMC - PubMed
    1. Chan F., Oatley M.J., Kaucher A.V., Yang Q.E., Bieberich C.J., Shashikant C.S., Oatley J.M. Functional and molecular features of the Id4+ germline stem cell population in mouse testes. Genes Dev. 2014;28:1351–1362. doi: 10.1101/gad.240465.114. - DOI - PMC - PubMed
    1. Grubman A., Choo X.Y., Chew G., Ouyang J.F., Sun G., Croft N.P., Rossello F.J., Simmons R., Buckberry S., Landin D.V., et al. Transcriptional signature in microglia associated with Abeta plaque phagocytosis. Nat. Commun. 2021;12:3015. doi: 10.1038/s41467-021-23111-1. - DOI - PMC - PubMed

Publication types

MeSH terms

Substances

LinkOut - more resources