. 2024 Oct 8;19(10):1474-1488.
doi: 10.1016/j.stemcr.2024.08.010. Epub 2024 Sep 26.

Abnormal synaptic architecture in iPSC-derived neurons from a multi-generational family with genetic Creutzfeldt-Jakob disease

Affiliations

Abnormal synaptic architecture in iPSC-derived neurons from a multi-generational family with genetic Creutzfeldt-Jakob disease

Aldana D Gojanovich et al. Stem Cell Reports. .

Abstract

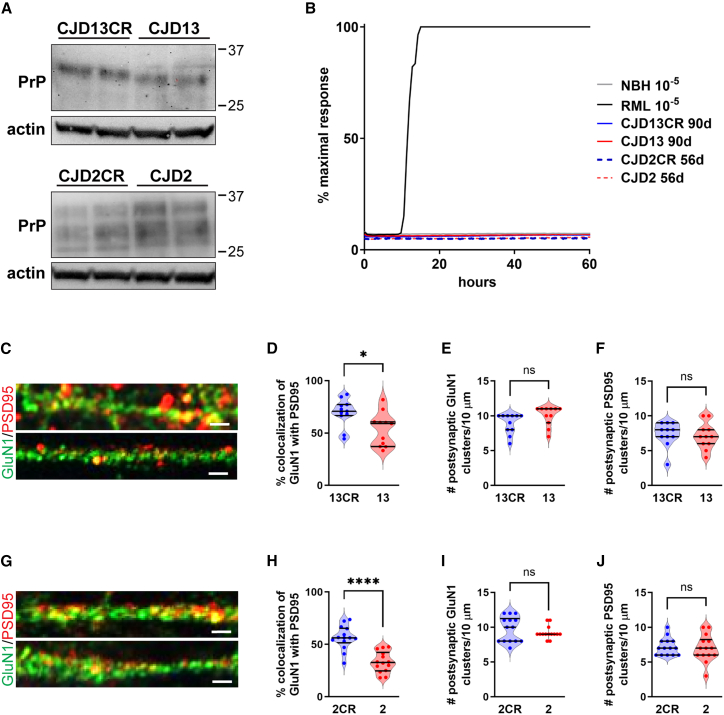
Genetic prion diseases are caused by mutations in PRNP, which encodes the prion protein (PrPC). Why these mutations are pathogenic, and how they alter the properties of PrPC are poorly understood. We have consented and accessed 22 individuals of a multi-generational Israeli family harboring the highly penetrant E200K PRNP mutation and generated a library of induced pluripotent stem cells (iPSCs) representing nine carriers and four non-carriers. iPSC-derived neurons from E200K carriers display abnormal synaptic architecture characterized by misalignment of postsynaptic NMDA receptors with the cytoplasmic scaffolding protein PSD95. Differentiated neurons from mutation carriers do not produce PrPSc, the aggregated and infectious conformer of PrP, suggesting that loss of a physiological function of PrPC may contribute to the disease phenotype. Our study shows that iPSC-derived neurons can provide important mechanistic insights into the pathogenesis of genetic prion diseases and can offer a powerful platform for testing candidate therapeutics.

Keywords: E200K; PrP; PrPSc; genetic prion disease; iPSC; neurodegeneration; prion; prion disease; synapse.


Conflict of interest statement

Declaration of interests The authors declare no competing interests.

Figures

Figure 1
Figure 1
Generation of an iPSC library from a family harboring the E200K PrP mutation (A) Schematic representation of the reprograming of peripheral blood mononuclear cells (PBMCs) to induced pluripotent stem cells (iPSC). Sev, Sendai virus. (B) Representative images of staining for TRA-1-81 from five non-carrier iPSC lines (NC10, NC11, NC12, BU1, and BU3) and seven iPSC lines carrying the E200K mutation (CJD2, CJD3, CJD4, CJD5, CJD6, CJD29, and CJD40). Scale bars, 100 μm.
Figure 2
Figure 2
Differentiation of human iPSCs to pyramidal cortical neurons via dual SMAD inhibition (A) Schematic representation of iPSC differentiation into neuronal progenitors and neurons. Created with BioRender.com. (B) Typical single-cell, patch-clamp recordings from neurons at a range of ages following neuronal differentiation. Young neurons (day 75) fire a single action potential following current injection. As neurons mature, they progress from firing a short burst of action potentials in response to current injection (day 97) to sustained action potential firing (day 110). (C) Morphological change in iPSC cultures during neuronal induction. (i) Confluent monolayer of iPSCs ready for neural induction; (ii) iPSC-derived progenitor cells after neuronal induction; (iii) neurogenesis stage; (iv) neurons at day 95; (v) immunofluorescence staining for F-actin visualizes dendritic spine morphology of mature neurons at day 105. Each boxed region in v and v1 is shown at higher magnification in the smaller panels to the bottom and right, respectively. (vi, ix) Immunofluorescence staining for different progenitor makers. (vi) PAX6+/Nestin+ primary progenitor cells forming a rosette structure at day 29; (ix) TBR2+/Nestin+ secondary progenitor cells at day 40. (vii, viii, x, and xi) Immunofluorescence staining for different classes of excitatory neurons. The glutamatergic identity of young (vii, x) and mature neurons (viii, xi) was confirmed by immunofluorescent staining for the vesicular glutamate transporter 1 (VGLUT1), neuron-specific tubulin (TUJ1), dendritic marker (MAP2), and cortical upper-layer neuron marker (SATB2). Nuclei in v–xi are stained with DAPI. These images were acquired from a differentiation of line BU1. Scale bars, 50 μm (ii, iii, iv, v, and ix); 10 μm (i, vi, x, xi, and v1); 1 μm (v2).
Figure 3
Figure 3
E200K PrP-expressing neurons do not develop PrPSc-like assemblies (A) Expression level of PrP is similar among lines of IPSCs-derived neurons. Western blotting analysis for total PrP in neuronal lysates at 95 days post differentiation. The three bands represent di-, mono-, and un-glycosylated forms of PrP, in addition to various physiological proteolytic cleavage products. (B and C) 50 μg of total protein was exposed to 2.5 μg/mL PK for 1 h at 37°C (C) Detergent extracts were centrifuged at 186,000 × g for 1 h at 4°C. Soluble and insoluble fractions were collected and analyzed by western blot. Blots in (A–C) were probed with the anti-PrP antibody D18. (D) No seeding activity was detected by RT-QuIC in neuronal lysates at 95 days post differentiation. One of five replicate wells containing CJD29 lysate turned positive after 55 h of assay time; below the threshold required to define positive seeding activity. n = 5 wells seeded with 2 ng protein per sample. See also Figure S1.
Figure 4
Figure 4
E200K PrP-expressing neurons show misalignment of NMDARs and PSD95 Representative images following staining of iPSC-derived cortical neurons for GluN1 and PSD95 from 95 to 110 days post differentiation. GluN1 staining is shown in green, and PSD95 staining is shown in red. (A–C) E200K carriers (B) non-carriers. Scale bars, 5 μm. (C) Graph of pixel intensities for each fluorescent channel along a representative segment of dendrite from an E200K carrier (lower panel) and a non-carrier (upper panel). Coincident peaks of fluorescent signal greater than 5,000 RFUs, indicated by boxes, are scored as co-localized. Black arrows indicate regions of low colocalization. (D) Plot of the colocalization of GluN1 and PSD95 along the neuronal dendritic shaft. Non-carrier vs. E200K, p = 0.007; BU1 vs. NC12, p = 0.0285; CJD2 vs. CJD29, p = 0.0285. n = fields observed. BU1 n = 13; BU3 n = 6, NC10 n = 10; NC11 n = 9; NC12 n = 9; CJD2 n = 9; CJD3 n = 22; CJD5 n = 9; CJD6 n = 9; CJD29 n = 30; CJD40 n = 14. (E) Plot of the number of postsynaptic GluN1 clusters per 10 μm. Non-carrier vs. E200K, p = 0.0629; BU3 vs. NC10, p = 0.0065; NC10 vs. NC12, p = <0.0001; NC11 vs. NC12, p = 0.0089; CJD3 vs. CJD5, p = 0.0065; CJD5 vs. CJD29, p = <0.0001; CJD6 vs. CJD29, p = 0.0089. n = fields observed. BU1 n = 13; BU3 n = 6, NC10 n = 10; NC11 n = 9; NC12 n = 9; CJD2 n = 9; CJD3 n = 22; CJD5 n = 9; CJD6 n = 9; CJD29 n = 30; CJD40 n = 14. (F) Plot of the number of postsynaptic PSD95 clusters per 10 μm. Non-carrier vs. E200K, p = 0.4572. n = fields observed. BU1 n = 8; BU3 n = 6, NC10 n = 17; NC11 n = 14; NC12 n = 11; CJD2 n = 11; CJD3 n = 23; CJD5 n = 10; CJD6 n = 19; CJD29 n = 16; CJD40 n = 12. Median, first and third quartile is indicated on all graphs. p < 0.0001 = ∗∗∗∗; p < 0.001 = ∗∗∗; p < 0.01 = ∗∗; p < 0.05 = ; ns = not significant using mixed linear models and Tukey’s correction for multiple comparisons.
Figure 5
Figure 5
Generation of CRISPR-corrected isogenic iPSC lines (A) Schematic of human PrP (created with BioRender.com) with the genomic locus of the E200K mutation (rs28933385 (c.598G>A, p.E200K) shown below with the mutated nucleotide in red. TRA-1-81 staining of CJD13 is shown to the left, scale bar, 100 μm. (B) Schematic of the oligonucleotide donor and gRNA sequences. (C) Sanger sequencing electrophoretogram showing nucleotide correction. The edited nucleotide is indicated in pink, the gRNA above in red, and the PAM sequence highlighted by orange box. TRA-1-81 staining of CJD13CR and CJD2CR is shown to the right, scale bar, 100 μm. See also Figure S2.
Figure 6
Figure 6
NGN2-differentiated E200K neurons lack PrPSc and show synaptic misalignment (A) Expression level of PrP is similar within the coisogenic CJD13/13CR and CJD2/2CR lines of iPSCs-derived neurons. Western blotting analysis for total PrP levels in lysates from neurons at 64 days (CJD13/13CR) and 61 days (CJD2/2CR) post differentiation. The anti-PrP antibody D18 was used. (B) No seeding activity was detected by RT-QuIC in lysates of 90 days (CJD13/13CR) or 56 days (CJD2/2CR) post differentiation of iPSC-derived cortical neurons. n = 5 wells seeded with 2 ng protein per sample. (C) Representative images following staining of cortical neurons derived from iPSC lines CJD13CR (top) and CJD13 (bottom) for GluN1 and PSD95. GluN1 staining is shown in green, and PSD95 staining is shown in red. Scale bars, 5 μm. (D) Plot showing a significant reduction in the colocalization of GluN1 and PSD95 along the dendritic shaft of neurons derived from CJD13 vs. CJD13CR (p = 0.0174, n = 11 fields observed). (E) Plot of the number of postsynaptic GluN1 clusters per 10 μm along the dendritic shaft of neurons derived from CJD13 vs. CJD13CR (p = 0.0888, n = 11 fields observed). (F) Plot of the number of postsynaptic PSD95 clusters per 10 μm along the dendritic shaft of neurons derived from CJD13 vs. CJD13CR (p = 0.7274, n = 11 fields observed). (G) Representative images following staining of cortical neurons derived from iPSC lines CJD2CR (top) and CJD2 (bottom) for GlunN1 and PSD95. GluN1 staining is shown in green, and PSD95 staining is shown in red. Scale bars, 5 μm. (H) Plot showing a significant reduction in the colocalization of GluN1 and PSD95 along the dendritic shaft of neurons derived from CJD2 vs. CJD2CR (p = <0.0001, n = 14 fields observed). (I) Plot of the number of postsynaptic GluN1 clusters per 10 μm along the dendritic shaft of neurons derived from CJD2 vs. CJD2CR (p = 0.3668, n = 14 fields observed). (J) Plot of the number of postsynaptic PSD95 clusters per 10 μm along the dendritic shaft of neurons derived from CJD2 vs. CJD2CR (p = 0.7299, n = 14 fields observed). Median, first and third quartile is indicated on all graphs. p < 0.0001 = ∗∗∗∗; p < 0.001 = ∗∗∗; p < 0.01 = ∗∗p < 0.05 = ; ns = not significant using Student’s t test with Welch’s correction.

References

    1. Adle-Biassette H., Verney C., Peoc'h K., Dauge M.-C., Razavi F., Choudat L., Gressens P., Budka H., Henin D. Immunohistochemical expression of prion protein (PrPC) in the human forebrain during development. J. Neuropathol. Exp. Neurol. 2006;65:698–706. - PubMed
    1. Asante E.A., Gowland I., Grimshaw A., Linehan J.M., Smidak M., Houghton R., Osiguwa O., Tomlinson A., Joiner S., Brandner S., et al. Absence of spontaneous disease and comparative prion susceptibility of transgenic mice expressing mutant human prion proteins. J. Gen. Virol. 2009;90:546–558. - PMC - PubMed
    1. Asante E.A., Linehan J.M., Smidak M., Tomlinson A., Grimshaw A., Jeelani A., Jakubcova T., Hamdan S., Powell C., Brandner S., et al. Inherited prion disease A117V is not simply a proteinopathy but produces prions transmissible to transgenic mice expressing homologous prion protein. PLoS Pathog. 2013;9:e1003643. - PMC - PubMed
    1. Barnat M., Capizzi M., Aparicio E., Boluda S., Wennagel D., Kacher R., Kassem R., Lenoir S., Agasse F., Braz B.Y., et al. Huntington's disease alters human neurodevelopment. Science. 2020;369:787–793. doi: 10.1126/science.aax3338. - DOI - PMC - PubMed
    1. Biasini E., Unterberger U., Solomon I.H., Massignan T., Senatore A., Bian H., Voigtlaender T., Bowman F.P., Bonetto V., Chiesa R., et al. A mutant prion protein sensitizes neurons to glutamate-induced excitotoxicity. J. Neurosci. 2013;33:2408–2418. doi: 10.1523/JNEUROSCI.3406-12.2013. - DOI - PMC - PubMed

Publication types

MeSH terms