. 2024 Oct 31;187(22):6309-6326.e15.
doi: 10.1016/j.cell.2024.08.049. Epub 2024 Sep 26.

CSF proteomics identifies early changes in autosomal dominant Alzheimer's disease

Collaborators, Affiliations

CSF proteomics identifies early changes in autosomal dominant Alzheimer's disease

Yuanyuan Shen et al. Cell. .

Abstract

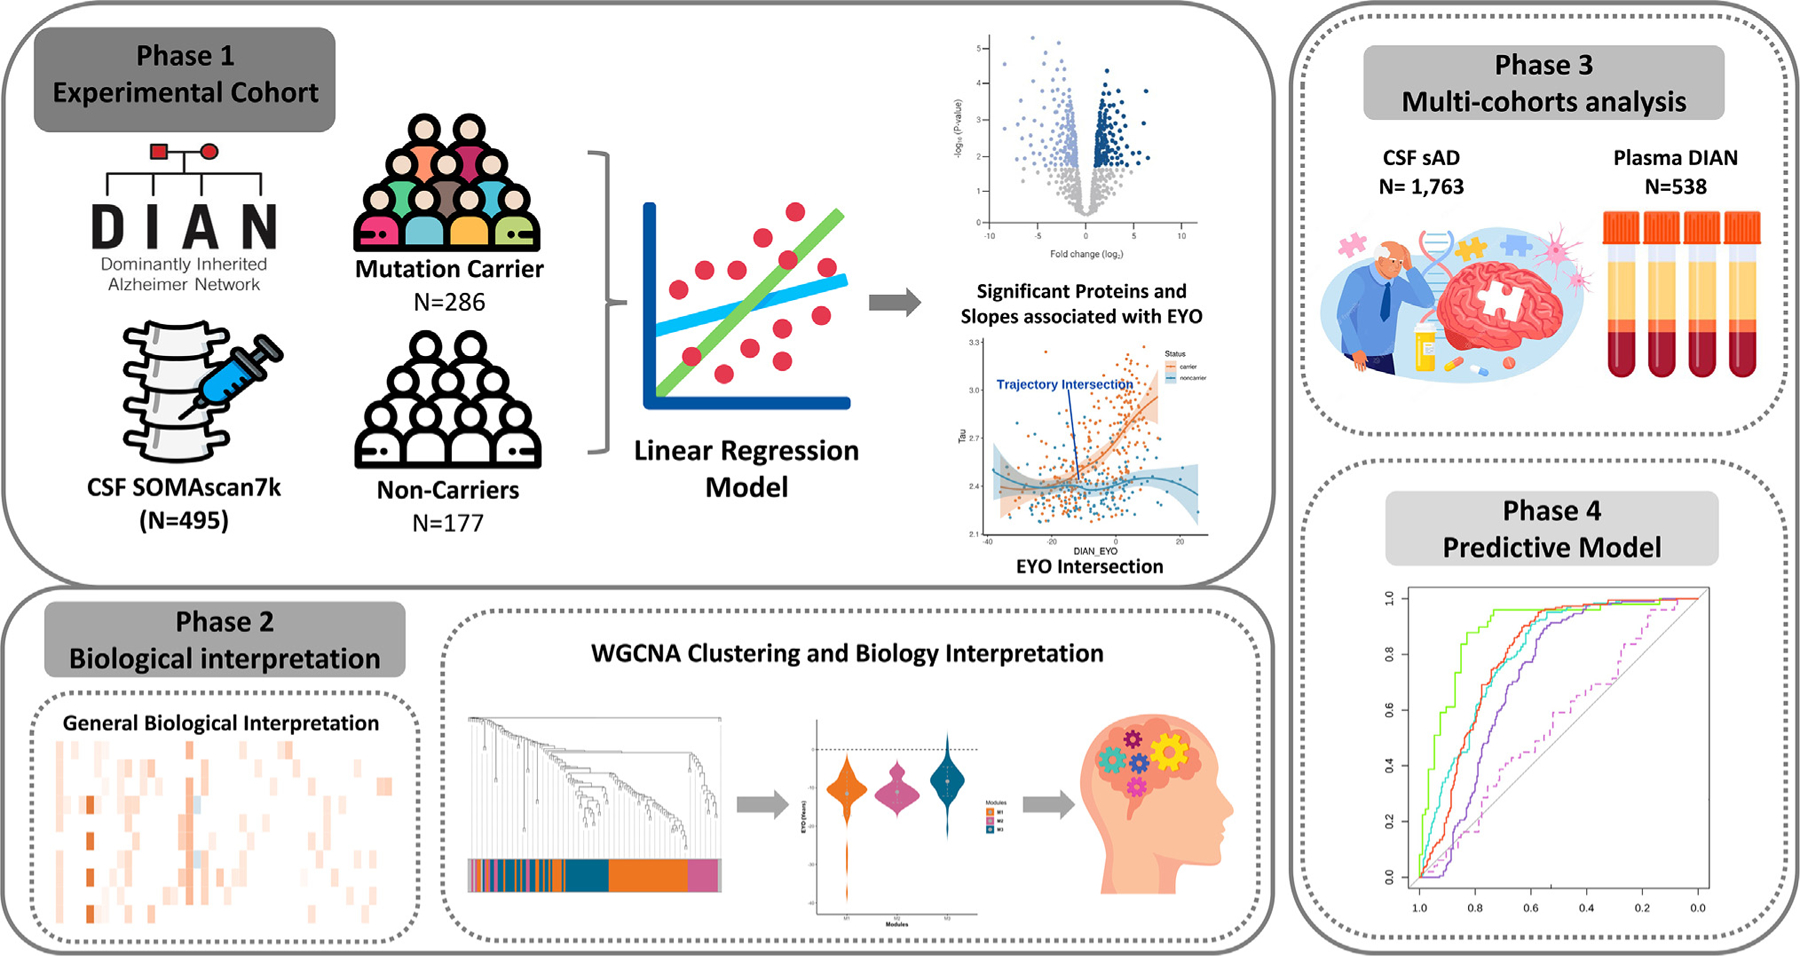
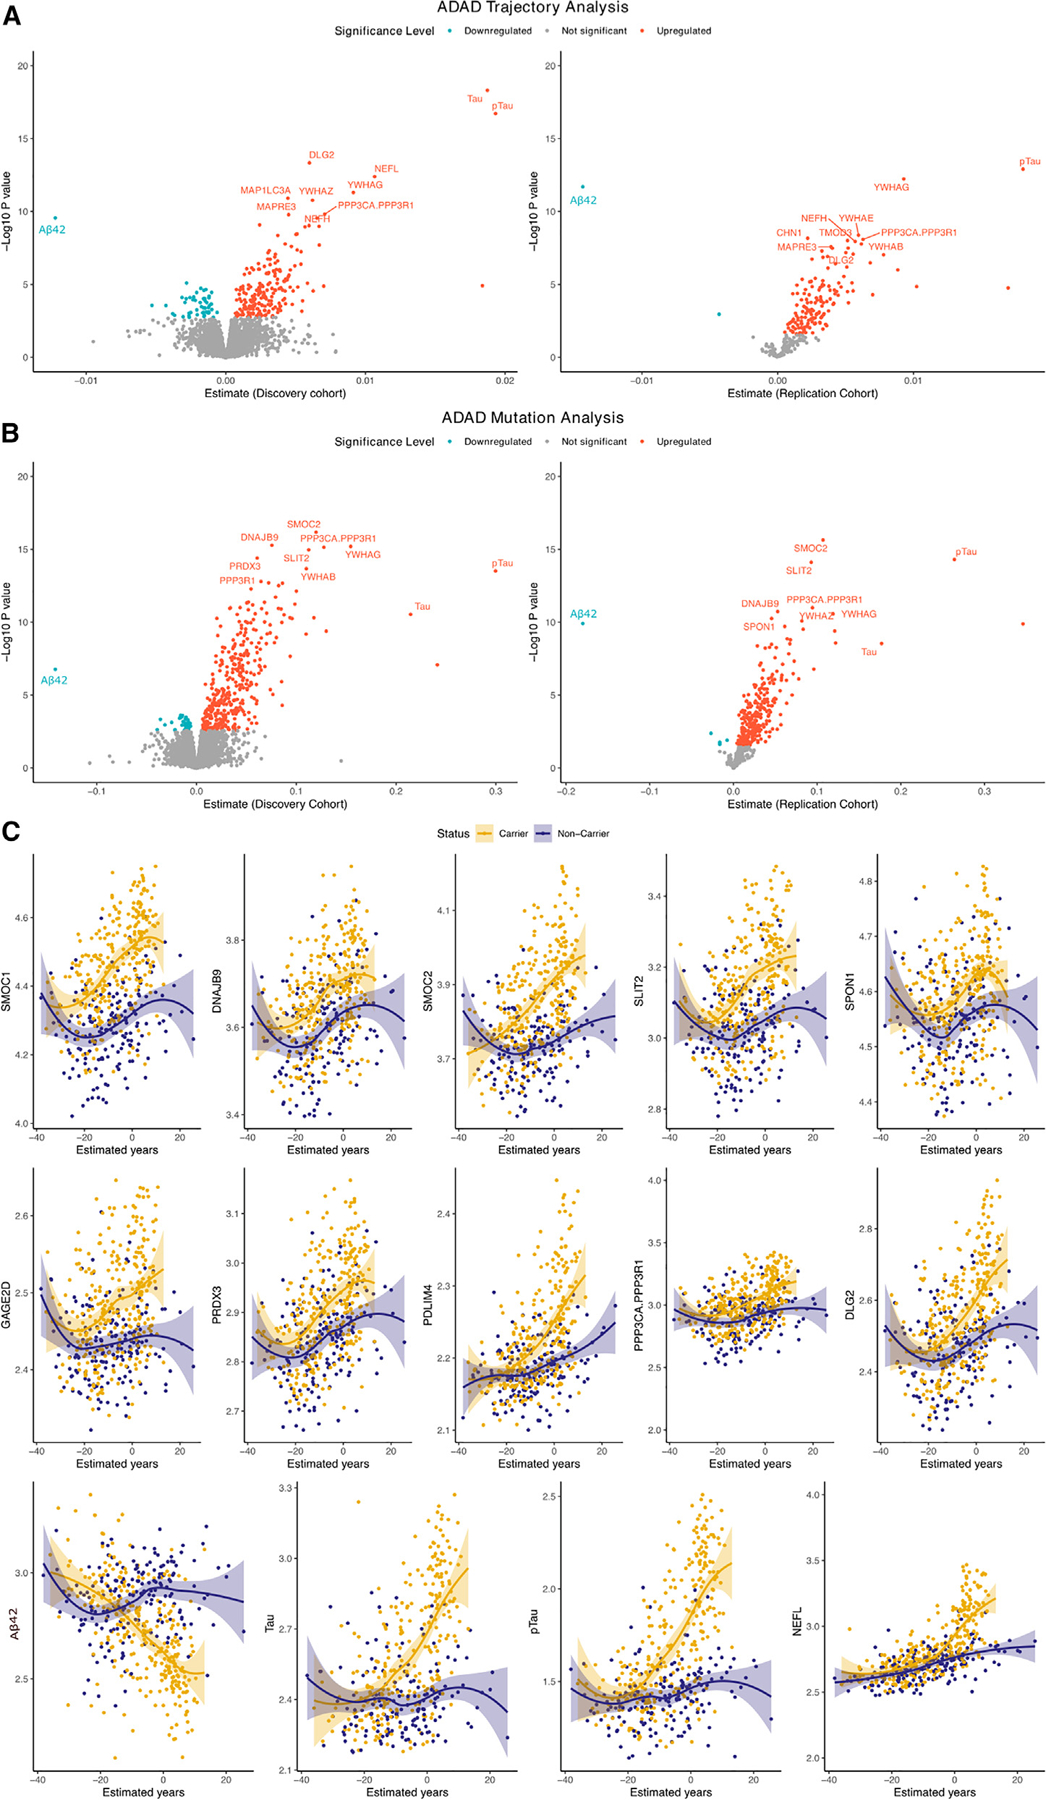
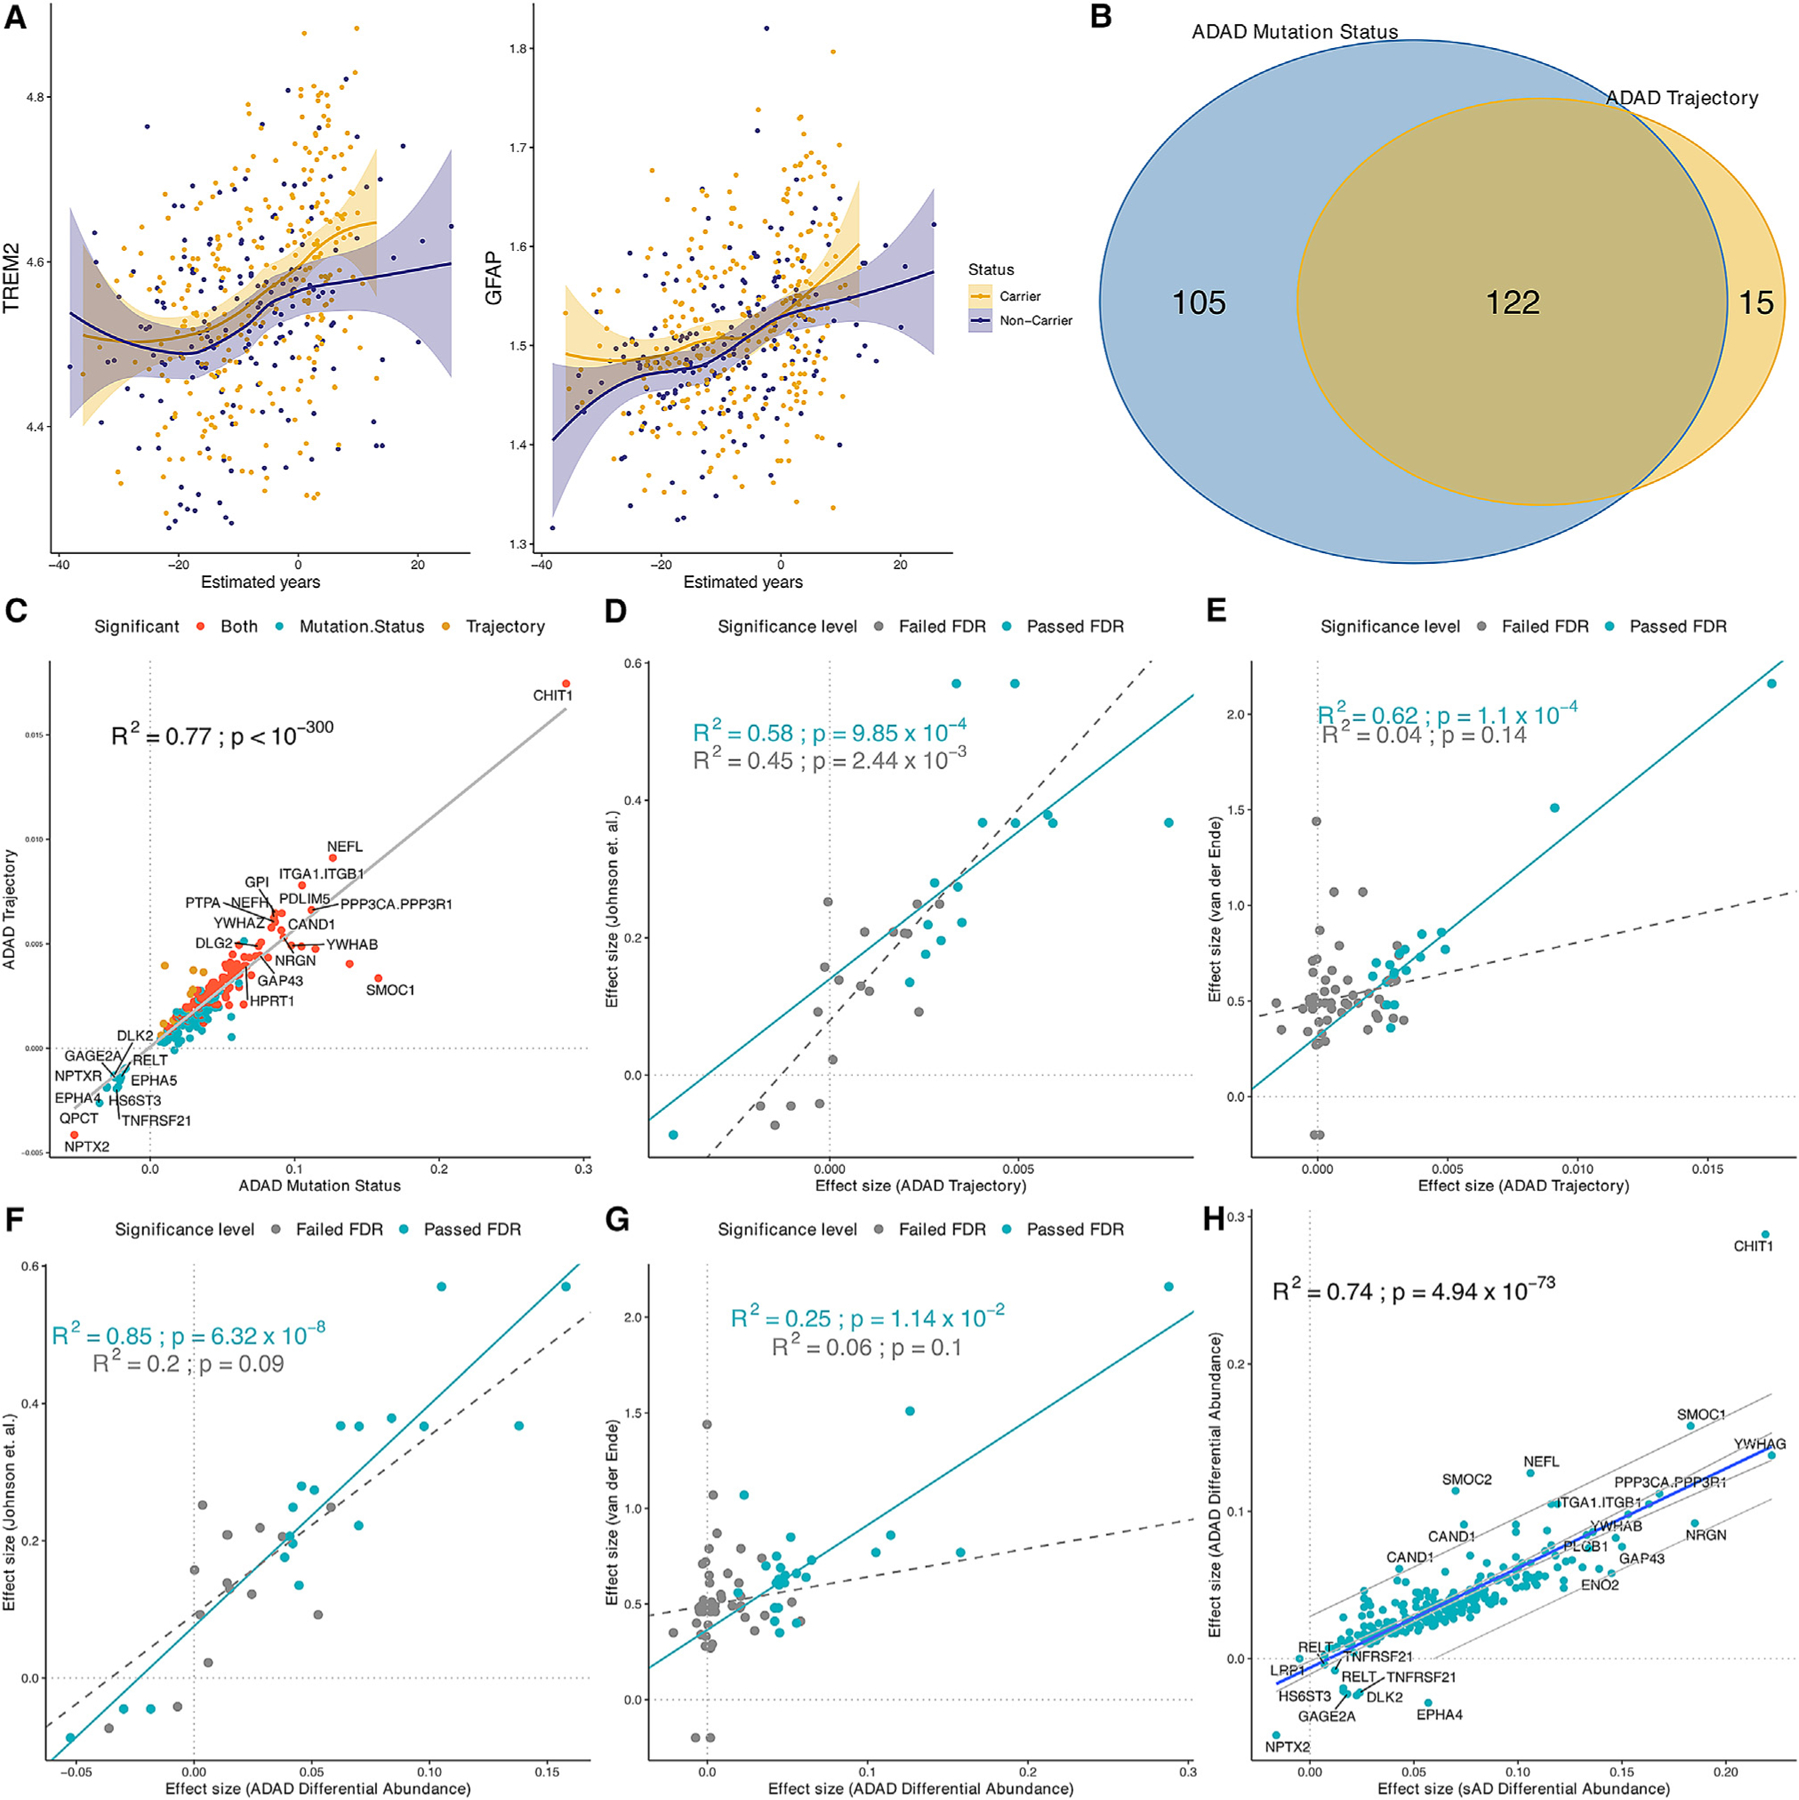
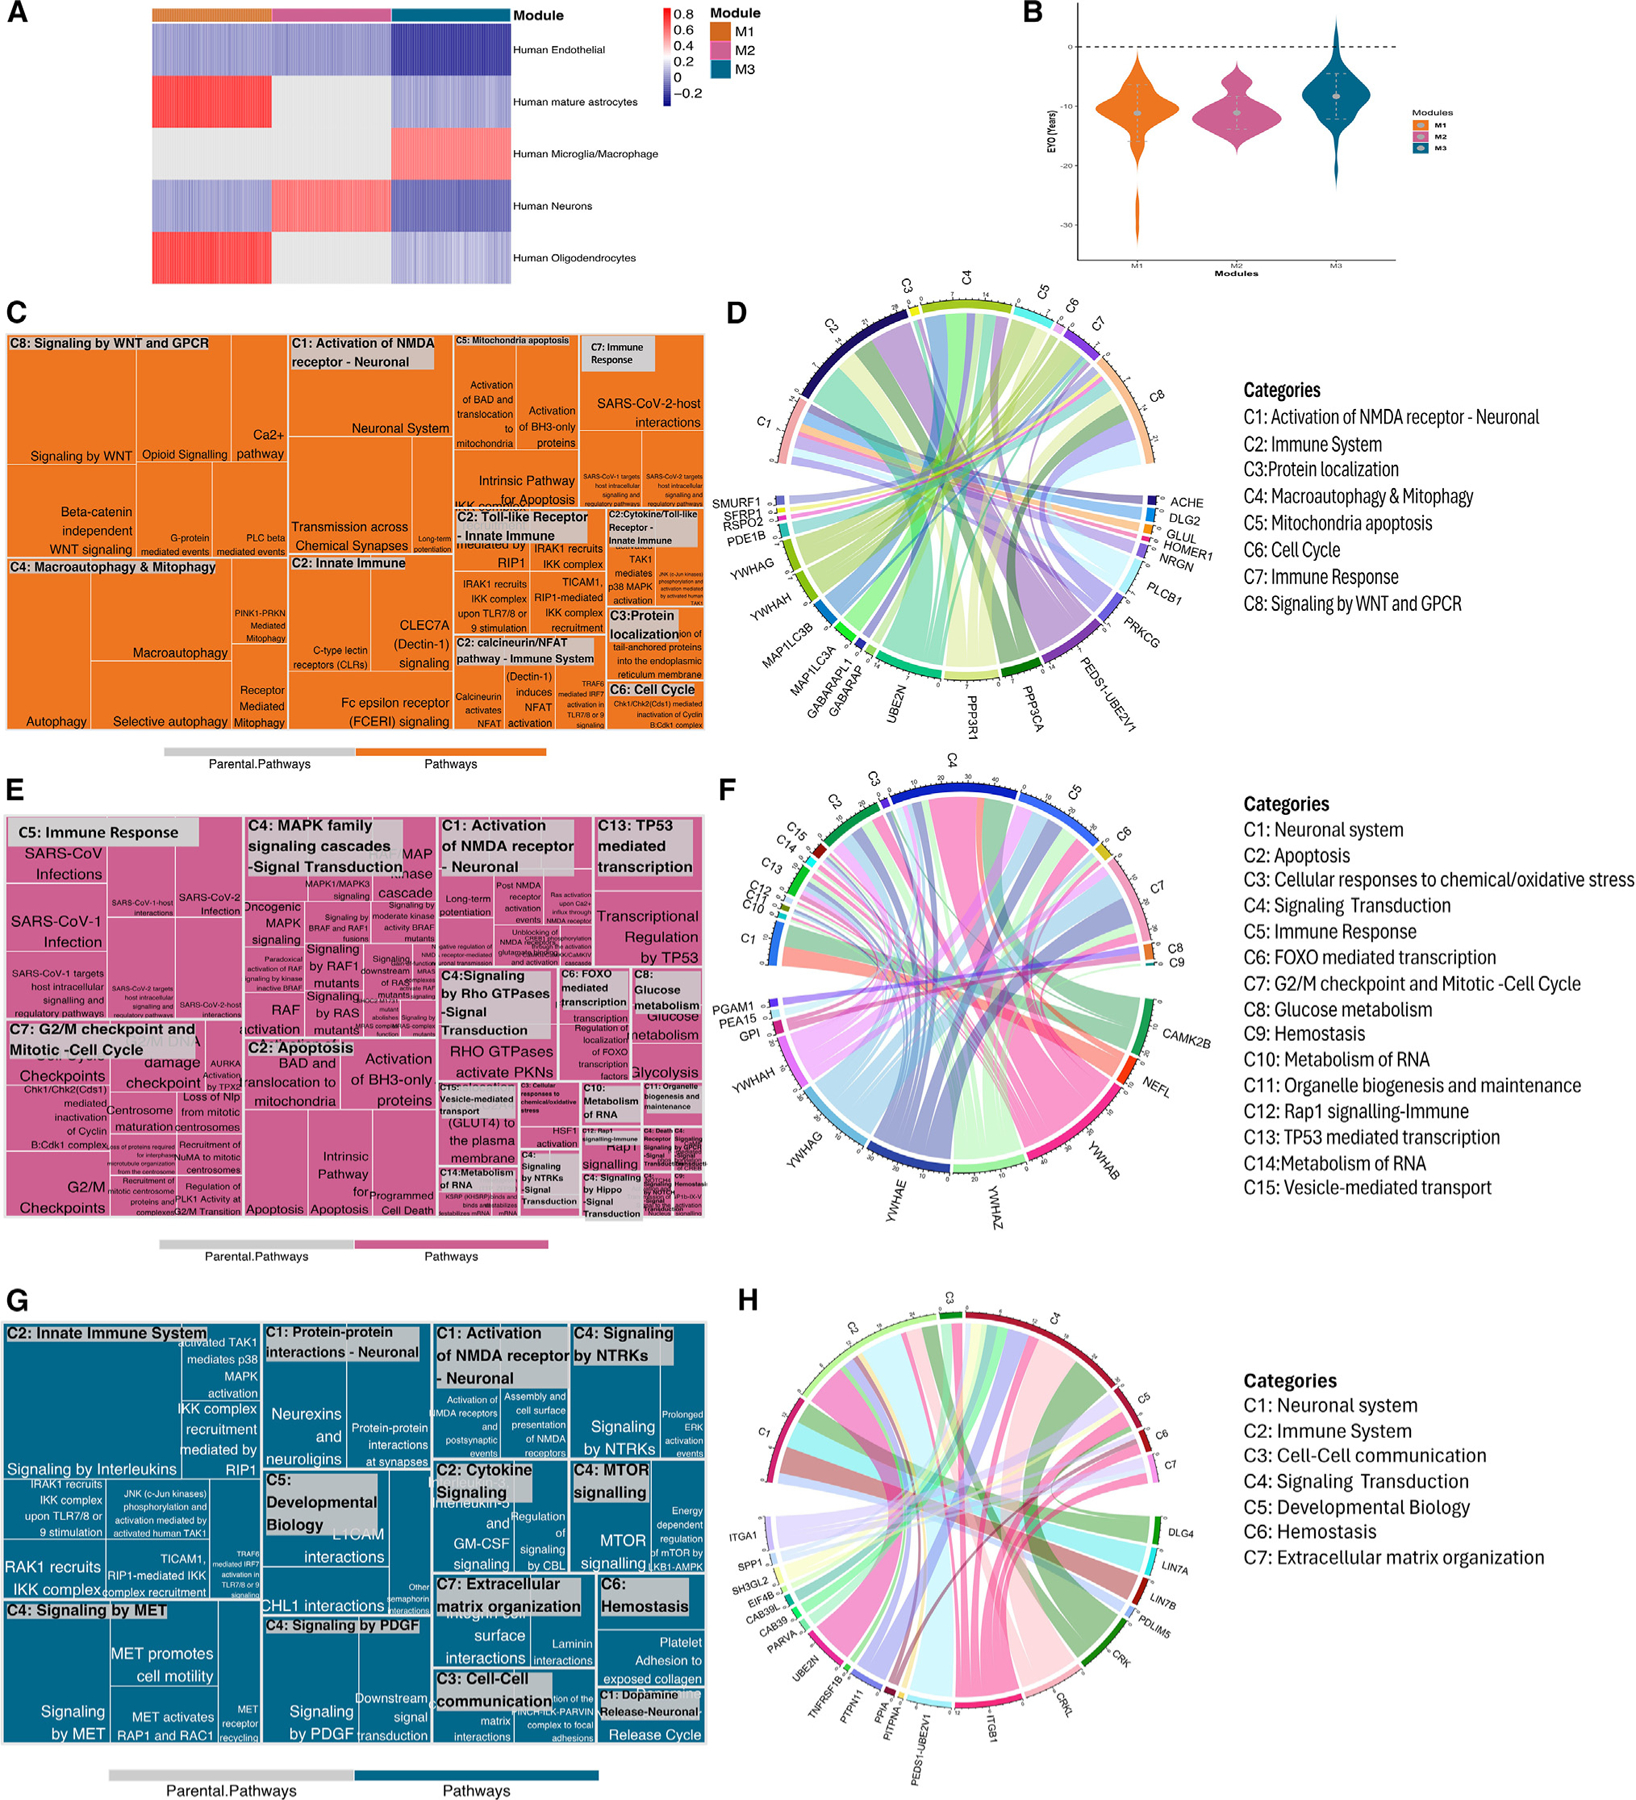
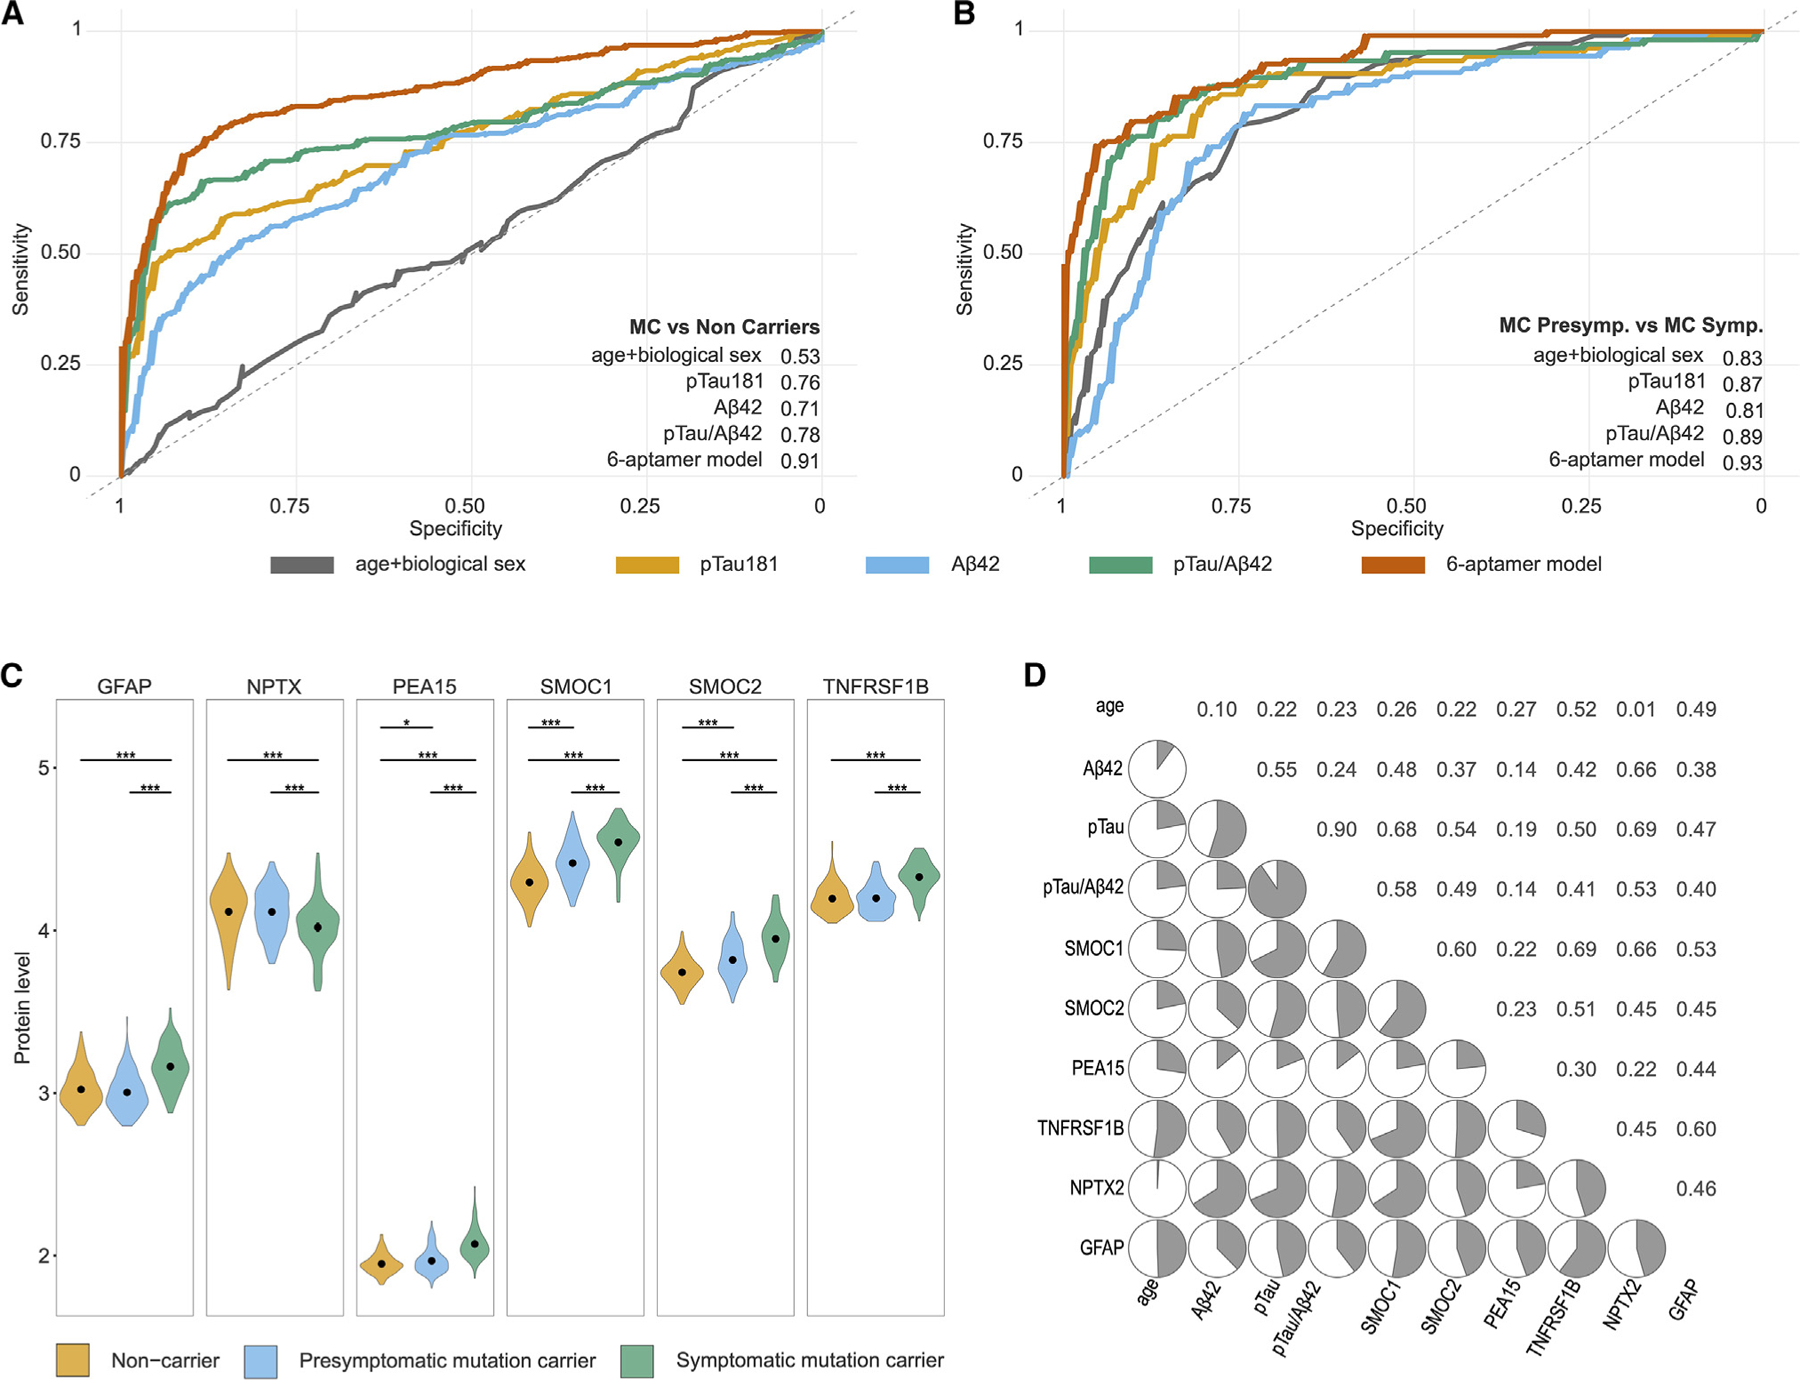
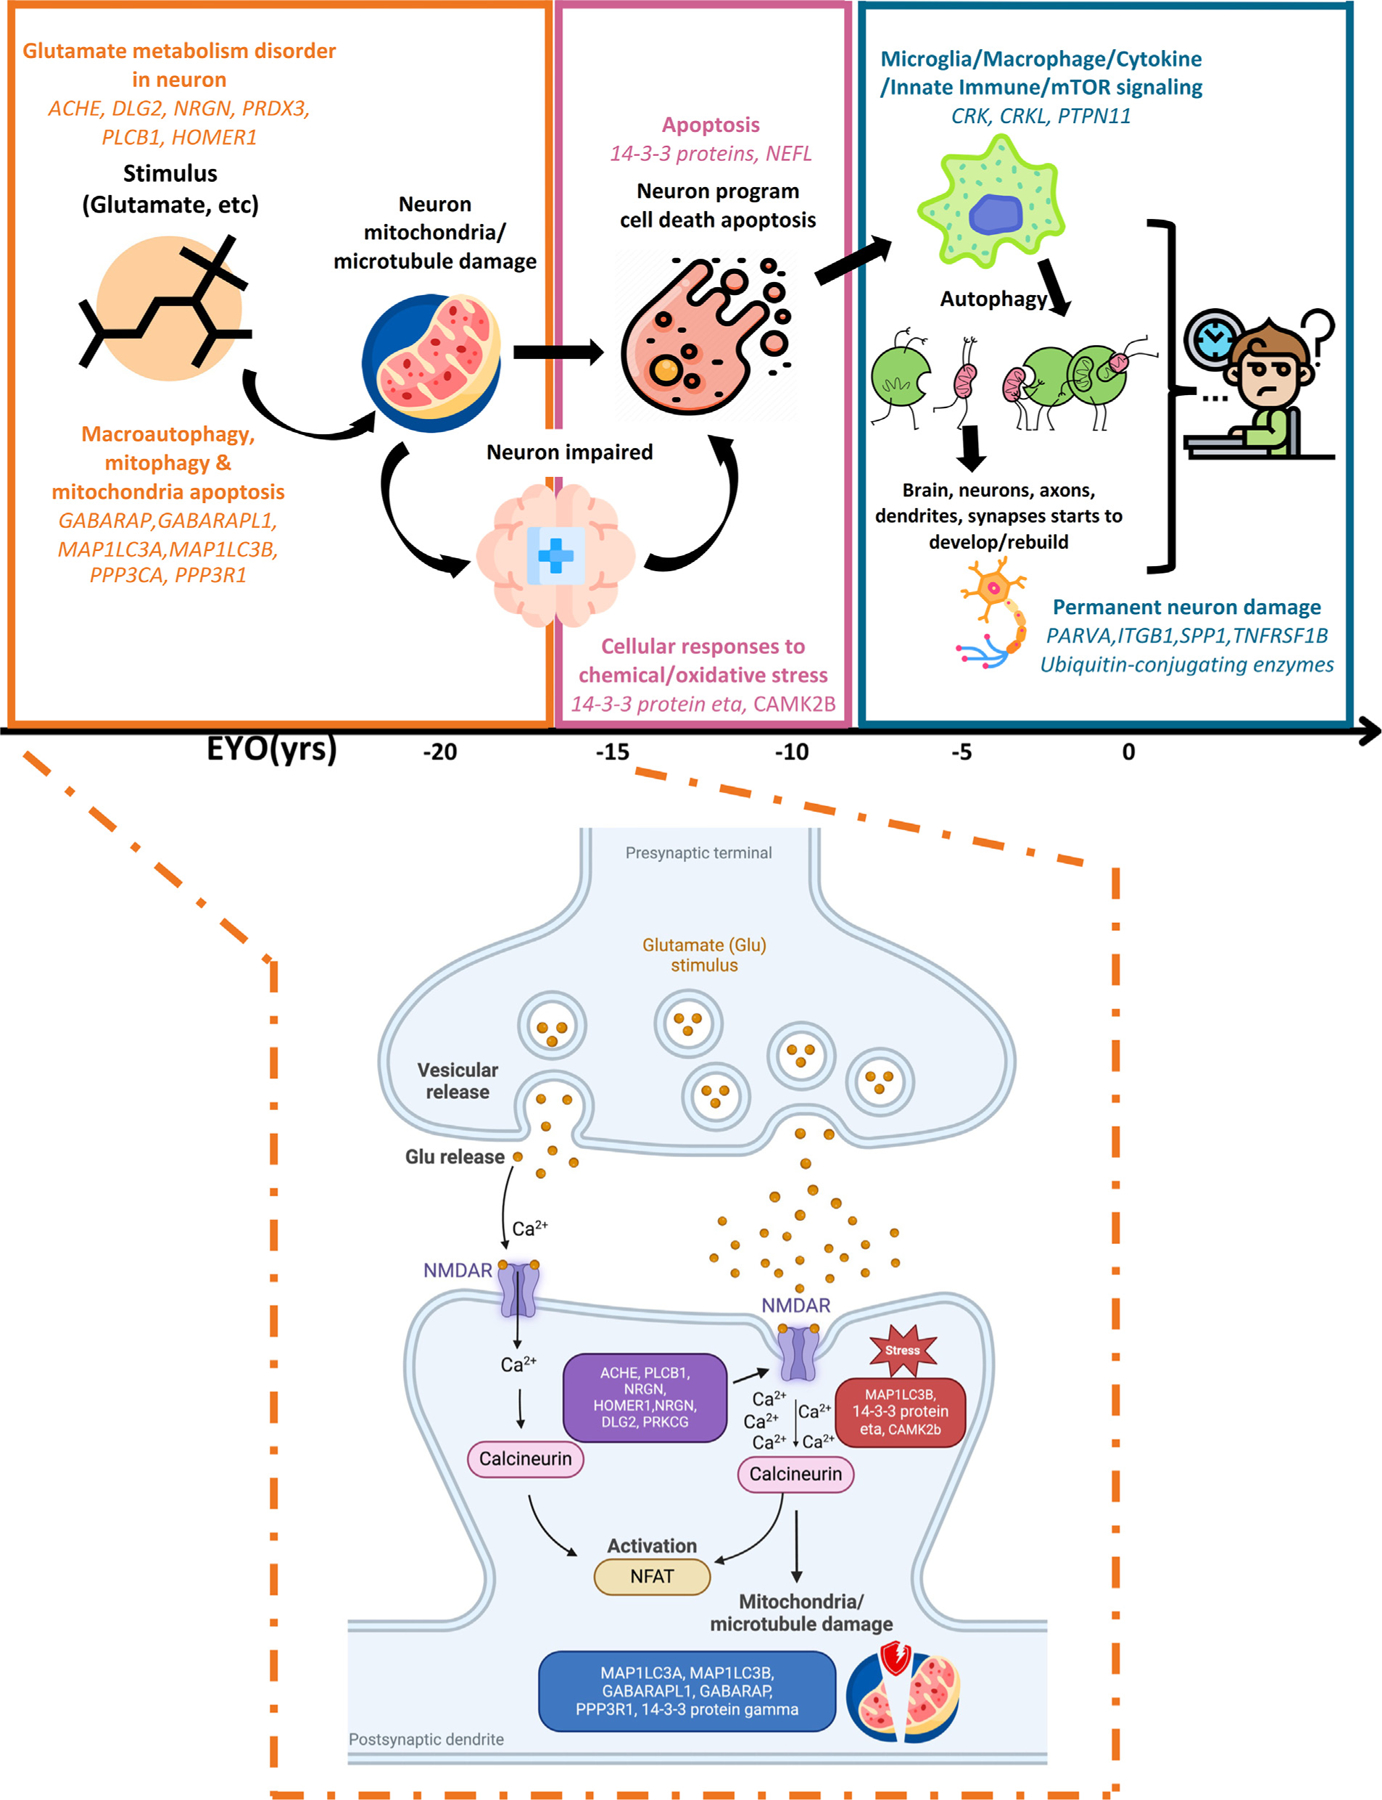
In this high-throughput proteomic study of autosomal dominant Alzheimer's disease (ADAD), we sought to identify early biomarkers in cerebrospinal fluid (CSF) for disease monitoring and treatment strategies. We examined CSF proteins in 286 mutation carriers (MCs) and 177 non-carriers (NCs). The developed multi-layer regression model distinguished proteins with different pseudo-trajectories between these groups. We validated our findings with independent ADAD as well as sporadic AD datasets and employed machine learning to develop and validate predictive models. Our study identified 137 proteins with distinct trajectories between MCs and NCs, including eight that changed before traditional AD biomarkers. These proteins are grouped into three stages: early stage (stress response, glutamate metabolism, neuron mitochondrial damage), middle stage (neuronal death, apoptosis), and late presymptomatic stage (microglial changes, cell communication). The predictive model revealed a six-protein subset that more effectively differentiated MCs from NCs, compared with conventional biomarkers.

Keywords: Somascan; autosomal dominant Alzheimer’s disease; microglia; mitochondrial damage; neurodegeneration; neuronal death; proteomics; pseudotrajectory analysis.


Conflict of interest statement

Declaration of interests C.C. has received research support from GSK and EISAI. C.C. is a member of the advisory board of Circular Genomics and owns stocks in these companies. C.C. is on the advisory board of ADmit. J.L. reports speaker fees from Bayer Vital, Biogen, EISAI, TEVA, Zambon, Merck, and Roche; consulting fees from Axon Neuroscience, EISAI, and Biogen; author fees from Thieme medical publishers and W. Kohlhammer GmbH medical publishers; and is inventor in a patent “Oral Phenylbutyrate for Treatment of Human 4-Repeat Tauopathies” (EP 23 156 122.6). He receives compensation for serving as chief medical officer for MODAG GmbH and is a beneficiary of the phantom share program of MODAG GmbH. E.M. reports research support received from NIA (U01AG059798), Anonymous Foundation, GHR, Alzheimer Association, Eli Lilly Eisai, and Hoffmann-La Roche and paid consulting for Eli Lilly, Alector, Alzamend, Sanofi, AstraZeneca, Hoffmann-La Roche, Grifols, and Merck.

Figures

Figure 1.
Figure 1.. Study overview
A total of 6,163 proteins were measured in CSF sample from 286 mutation carriers (MCs) and 177 non-carriers (NCs). Differential pseudo-trajectory analyses were performed between MCs and NCs. Trajectory intersections were calculated for significant pseudo-trajectory proteins. Biological functions were identified by protein co-expression network analysis and pathway enrichment. A total of 1,763 sAD CSF samples and 538 DIAN plasma samples were analyzed to validate the approach and contextualize the findings. Several publicly available external proteomic datasets were used to validate our findings as well. Finally, the LASSO model was used to select significant trajectory proteins and to create predictive models for ADAD.
Figure 2.
Figure 2.. Significant pseudo-trajectory proteins and significant proteins associated with ADAD mutation status in CSF
(A and B) Volcano plots displaying the estimate change (x axis) against −log10 statistical differences (y axis) for all tested proteins for pseudo-trajectory analyses between MCs and NCs (A) and ADAD mutation status only (B). The red dots show the significantly upregulated proteins, and the blue dots show the significantly downregulated proteins after multiple test correction (FDR p value < 0.05). (C) Twelve significant pseudo-trajectory proteins that changed earlier than Tau, pTau, and Aβ42.
Figure 3.
Figure 3.. Validation and replication of significant pseudo-trajectory proteins
(A) The pseudo-trajectory curve for TREM2 and GFAP, but these two proteins did not pass the FDR threshold between MCs vs. NCs. The yellow curve indicates the MCs’ proteins change with EYO, and purple curve indicates the NCs’ proteins change with EYO. (B) The overlapped significant proteins from trajectory analysis and ADAD mutation status analysis of MCs vs. NCs at FDR threshold. (C–H) Scatterplot of the significant trajectory proteins replicated in (C) CSF ADAD mutation status analysis; (D) significant pseudo-trajectory proteins replicated in Johnson et al. finding; (E) significant trajectory proteins replicated in Van der Ende et al. finding; (F) significant proteins associated with mutation status replicated in Johnson et al. finding; (G) significant proteins associated with mutation status replicated in Van der Ende et al. finding; (H) significant proteins associated with mutation status replicated in significant proteins associated with sAD. Gray line represent 95% confidence interval.
Figure 4.
Figure 4.. Co-expression network analysis of significant pseudo-trajectory proteins and pathway enrichment for each module
(A) Heatmap showing GSVA scores for each cell type across modules. Higher GSVA score is shown in red, highlighting an enrichment for that cell type within the module, whereas lower GSVA scores, represented in blue, show depletion. Gray color indicates that the module did not have any genes/proteins associated with the cell type. (B) EYO comparison for functional identified proteins from Reactome pathway analysis. (C–H) Reactome pathway analysis for each module. Treemap (C, E, and G) represents the significantly enriched pathways with summarized categories (C#, such as C1); chord diagram (D, F, and H) shows the enriched proteins in categorized pathways. The colored patterns labeling proteins represent the different cell types, and the colors are consistent with bar colors in cell-type enrichment (A). See also Figures S4 and S5.
Figure 5.
Figure 5.. Predictive models for ADAD
(A and B) The ROC and AUC corresponding to the final protein signature fitted into a generalized linear model (GLM) model, compared with the predictive power of age and sex; β-amyloid 42, pTau 181, and the pTau181/Abeta42 ratio in predicting mutation carriers compared with non-carriers (A); and symptomatic mutation carriers compared with non-symptomatic mutation carriers (B). (C) Violin plots comparing the levels of the six proteins included in the predictive model in non-carriers, non-symptomatic carriers, and symptomatic carriers. Gray dots with extended lines in each violin plot represent the median ± SD. * represents level of p value significance. ***p < 0.001; **p < 0.01; *p < 0.05; ns = not significant. (D) Correlation matrix corresponding to the Spearman correlations for the six proteins included in the predictive models, age, β-amyloid 42, pTau 181, and the pTau181/ABeta42 ratio in non-carriers.
Figure 6.
Figure 6.. Multiple biological process trajectories’ summary
Highlighted pathology process and enriched significant trajectory proteins in each module by chronological order and highlighted biological process of early stage of ADAD (M1). It includes normal state and early ADAD disease stage. x axis represents the EYO in years.

References

    1. Bateman RJ, Aisen PS, De Strooper B, Fox NC, Lemere CA, Ringman JM, Salloway S, Sperling RA, Windisch M, and Xiong C (2011). Autosomal-dominant Alzheimer’s disease: a review and proposal for the prevention of Alzheimer’s disease. Alzheimers Res. Ther 3, 1. 10.1186/alzrt59. - DOI - PMC - PubMed
    1. Bateman RJ, Xiong C, Benzinger TLS, Fagan AM, Goate A, Fox NC, Marcus DS, Cairns NJ, Xie X, Blazey TM, et al. (2012). Clinical and biomarker changes in dominantly inherited Alzheimer’s disease. N. Engl. J. Med 367, 795–804. 10.1056/NEJMoa1202753. - DOI - PMC - PubMed
    1. Levitis E, Vogel JW, Funck T, Hachinski V, Gauthier S, Vöglein J, Levin J, Gordon BA, Benzinger T, Iturria-Medina Y, et al. (2022). Differentiating amyloid beta spread in autosomal dominant and sporadic Alzheimer’s disease. Brain Commun 4, fcac085. 10.1093/braincomms/fcac085. - DOI - PMC - PubMed
    1. Tang M, Ryman DC, McDade E, Jasielec MS, Buckles VD, Cairns NJ, Fagan AM, Goate A, Marcus DS, Xiong C, et al. (2016). Neurological manifestations of autosomal dominant familial Alzheimer’s disease: a comparison of the published literature with the Dominantly Inherited Alzheimer Network observational study (DIAN-OBS). Lancet Neurol 15, 1317–1325. 10.1016/S1474-4422(16)30229-0. - DOI - PMC - PubMed
    1. Oboudiyat C, Gefen T, Varelas E, Weintraub S, Rogalski E, Bigio EH, and Mesulam MM (2017). Cerebrospinal fluid markers detect Alzheimer’s disease in nonamnestic dementia. Alzheimers Dement 13, 598–601. 10.1016/j.jalz.2017.01.006. - DOI - PMC - PubMed

LinkOut - more resources