. 2024 Oct 15;5(10):101748.
doi: 10.1016/j.xcrm.2024.101748. Epub 2024 Sep 26.

A living organoid biobank of patients with Crohn's disease reveals molecular subtypes for personalized therapeutics

Affiliations

A living organoid biobank of patients with Crohn's disease reveals molecular subtypes for personalized therapeutics

Courtney Tindle et al. Cell Rep Med. .

Abstract

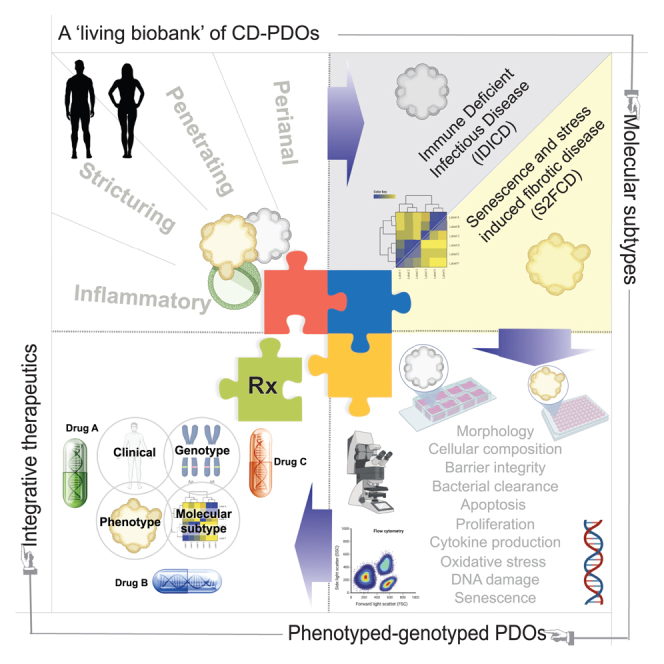
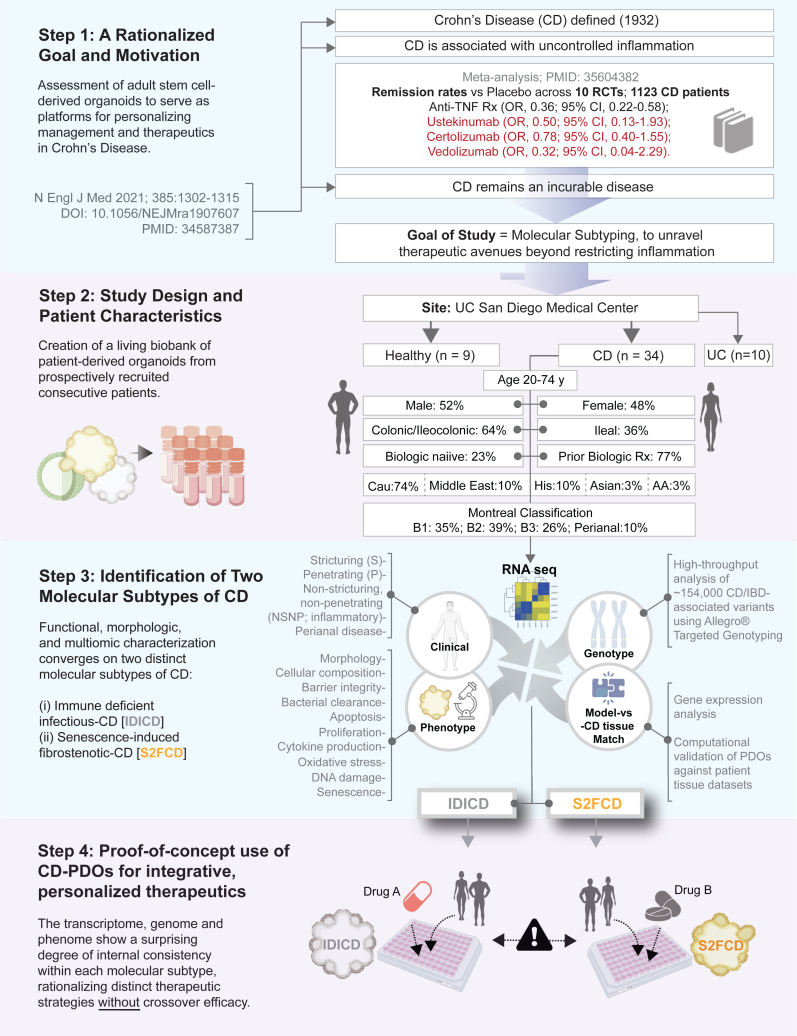
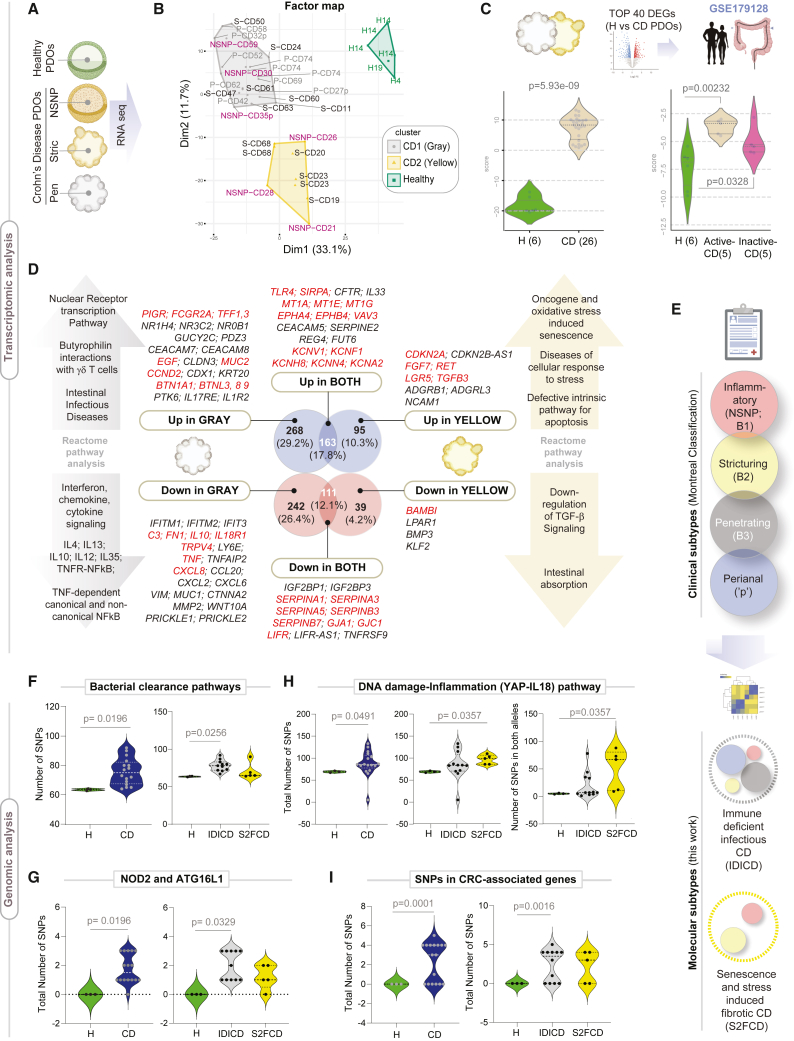
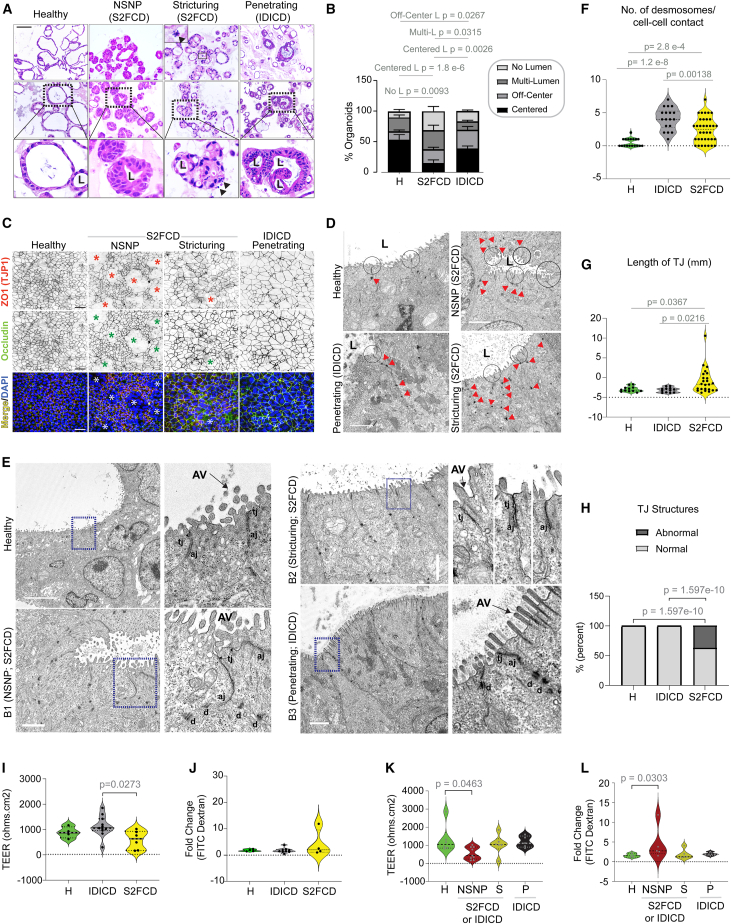
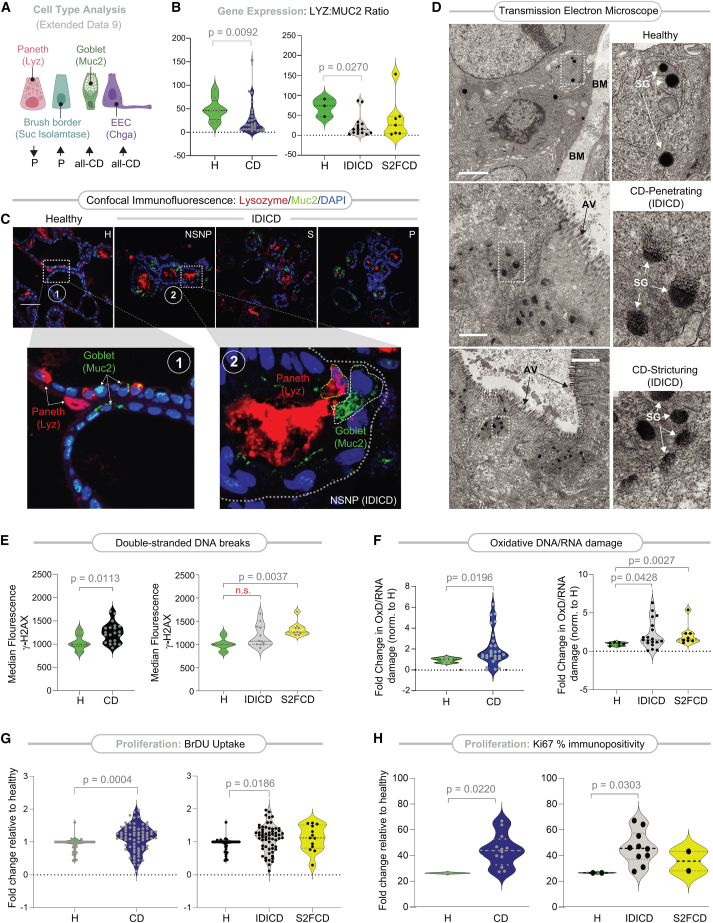
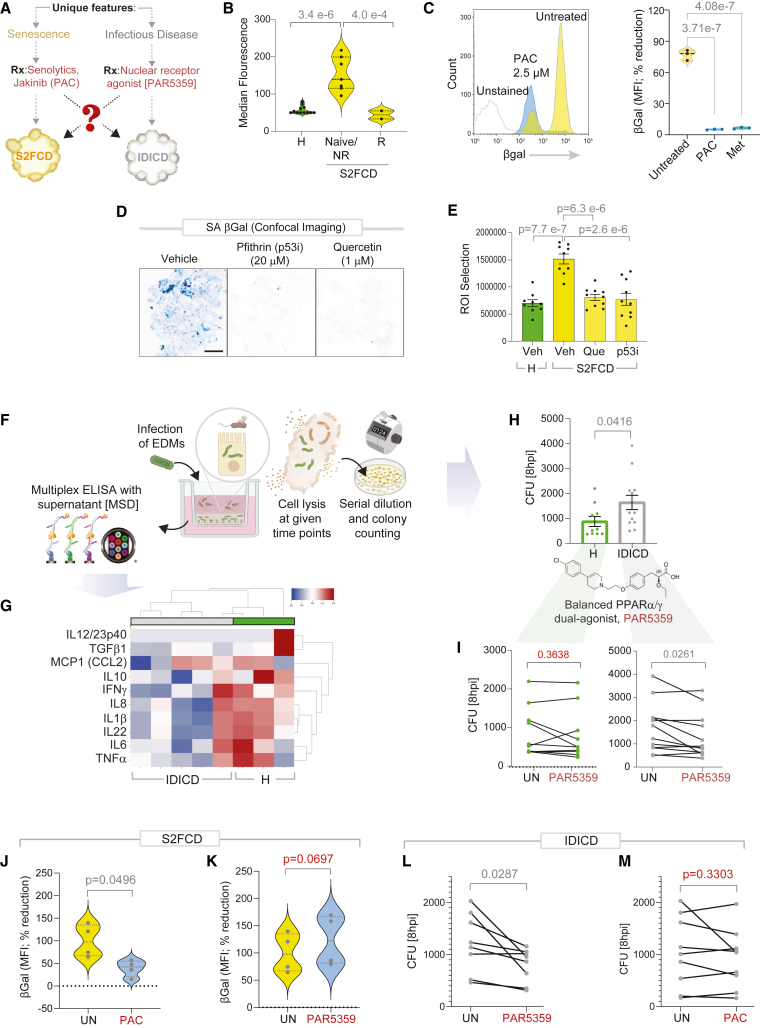
Crohn's disease (CD) is a complex and heterogeneous condition with no perfect preclinical model or cure. To address this, we explore adult stem cell-derived organoids that retain their tissue identity and disease-driving traits. We prospectively create a biobank of CD patient-derived organoid cultures (PDOs) from colonic biopsies of 53 subjects across all clinical subtypes and healthy subjects. Gene expression analyses enabled benchmarking of PDOs as tools for modeling the colonic epithelium in active disease and identified two major molecular subtypes: immune-deficient infectious CD (IDICD) and stress and senescence-induced fibrostenotic CD (S2FCD). Each subtype shows internal consistency in the transcriptome, genome, and phenome. The spectrum of morphometric, phenotypic, and functional changes within the "living biobank" reveals distinct differences between the molecular subtypes. Drug screens reverse subtype-specific phenotypes, suggesting phenotyped-genotyped CD PDOs can bridge basic biology and patient trials by enabling preclinical phase "0" human trials for personalized therapeutics.

Keywords: barrier integrity; host-microbe interaction; inflammatory bowel disease; patient-derived organoids; therapeutics.


Conflict of interest statement

Declaration of interests S.D. and P.G. have a patent on the methodology.

Figures

None
Graphical abstract
Figure 1
Figure 1
Study outline: Creation of a living biobank of adult stem cell-derived PDOs for enhancing personalized therapeutics in CD Key aspects of a rationalized goal and study motivation are summarized (Step 1). Patients were prospectively enrolled in this study as source of colonic tissue biopsies for the isolation and creation of the CD PDO biobank. Clinical, pathological, and treatment history and the Montreal classification of disease were collected (see Table S1). PDOs were generated from the adult stem cells at the crypt base, expanded, and biobanked (in Step 2) for use in various assays (in Step 3). Various multiomic, morphologic, and functional studies that were performed, some in low- and others in high-throughput modes (HTP; in 96-well plates) for systematic molecular and phenotypic characterization (cataloged in Table S2). The study ends with proof-of-concept therapeutic studies (Step 4) in which drugs are rationalized and paired to each subtype with the intention to specifically reverse driver phenotyped within a subtype without crossover benefits to the other subtype. RCT, randomized controlled trials; OR, odds ratio; CI, confidence interval.
Figure 2
Figure 2
Transcriptome and genome analyses of CD PDOs reveal the existence of two distinct molecular subtypes of CD (A) Study design for the transcriptomic analyses on PDOs. (B) A factorial map generated by performing the hierarchical clustering on principal components (HCPC) analysis is plotted onto the first two dimensions. The CD PDOs cluster into two distinct groups: gray and yellow, which are differentiated from healthy controls (green). Individual samples are labeled (see Table S3 for patient information). H, healthy; NSNP, non-stricturing, non-penetrating; S, stricturing; P, penetrating. Samples (annotated with “p”) were from subjects with perianal disease. See also Figure S1 for comparison with UC-PDOs. (C) Top: the strategy used to objectively benchmark CD PDOs. Bottom: violin plots show the composite score of the PDO-derived top upregulated DEGs (left) and in the laser capture microdissected colonic epithelium (right). Values in parentheses indicate unique patients. See Table S4 for the list of DEGs. (D) Genes that are differentially expressed (Up or Down vs. healthy) uniquely in the gray (CD1; left) vs. yellow (CD2; right) cluster of CD PDOs or those that are shared between both subtypes (CD1+2) are listed, alongside the enriched pathways they represent. See Table S4 for a complete list of DEGs and reactome pathways. See also Figures S2 and S3 for additional principal component analysis (PCoA) and reactome pathway enrichment analyses and Figures S4 and S5 for transcriptome-derived insights into CD-associated changes in the crypt-axis differentiation score, stem cell dysfunction, cellular composition, and other properties. (E) Schematic summarizes how various clinical subtypes of CD (Montreal classification) fit into two broad molecular subtypes, immune-deficient infectious CD and senescence and stress-induced fibrotic CD. (F–I) Violin plots show the number of mutations in genes within the indicated pathways (see Table S5 for gene list) in CD PDOs vs. healthy controls. Plots on the left compare all CD PDOs combined, whereas plots on the right separate the CD PDOs by molecular subtypes, IDICD and S2FCD. Plots in (G) specifically display the frequency of NOD2 SNPs rs2066843 and rs2076756 and ATG16L1 SNP rs2241880 in CD PDOs vs. healthy controls. Statistical significance was assessed by Mann-Whitney (F, G [left], H), one-way ANOVA (G, right), and Welch’s test (I). Only significant p values are displayed. See also Figure S6.
Figure 3
Figure 3
Assessment of morphology and barrier integrity of CD PDOs (A and B) Representative images (A) of hematoxylin and eosin-stained FFPE-CD PDOs are shown from each clinical subtype of CD alongside healthy controls. Scale bar, 100 μm. L, lumen. Arrowhead, nuclear fragmentation (likely apoptotic bodies). Stacked bar plots (B) show the quantification of the proportion of each type of organoid structure in various CD subtypes (See Figure S7B for all CD subtypes combined; B [right], separated into CD subtypes). Statistical significance was assessed by one-way ANOVA. Only significant p values are displayed (n = 3–8 in each group). See Figure S7 for morphologic assessment by quantitative morphometrics using Imaris and lumen position/presence by light microscopy. (C) Polarized monolayers of CD PDOs on transwells (enteroid-derived monolayers; EDMs) were fixed and stained for ZO1 (red), occludin (green), and DAPI (nuclei, blue) and analyzed by confocal microscopy. Representative fields are shown; individual red and green channels are displayed in grayscale. Asterisk, areas of impaired barrier. Scale bar, 50 μm. (D) Electron micrographs of healthy and CD PDOs display apical cell-cell junctions. Red arrowheads, desmosomes. Scale bar, 2 μm. (E) Electron micrographs of tight junctions in healthy and CD PDOs of various subtypes are shown. The boxed region on the left is magnified on the right. AV, apical villi; tj, tight junction; aj, adherens junction; d, desmosomes. Scale bars, 5 μm (top two panels) and 2 μm (bottom two panels). (F–H) Plots display the quantification of no. of desmosomes/cell-cell contact (F), the length of TJ (G), and the frequency of abnormal defects/TJ structure (H) observed by TEM. Statistical significance was assessed by Welch’s t test (F, G) and Fisher’s exact test (H) (n = 7–13 fields analyzed in each subtype of PDO). See Figures S8A–S8C for the same analysis displayed as clinical subtypes of CD. (I–L) Violin plots show the fold change in TEER across (I and K) and FITC-dextran leakage through (J and L) CD-EDMs compared to healthy EDMs. Data are displayed either as molecular (I and J) or clinical (K and L) subtypes. Statistical significance was assessed by Welch’s t test (I–K) and Mann-Whitney (L). Only significant p values are displayed (n = 5–9 subjects in each group, 2–5 repeats in each PDO). See Figures S8D–S8F for all CD subtypes combined. See Table S2 for subjects analyzed in each assay.
Figure 4
Figure 4
CD PDOs retain evidence of altered cell composition, high oxidative stress, and turnover (A) Schematic summarizing the relative expression of type, as determined by gene expression (markers used for each cell type in parentheses). Up-arrow, upregulation. Down-arrow, downregulation. P, penetrating CD. See Figures S9A–S9D for violin plots displayed as both clinical and molecular subtypes of CD. (B) Violin plots show the ratio of LYZ and MUC2 transcripts in CD PDOs vs. healthy controls (B [left], all CD subtypes combined; B [right], separated into molecular subtypes of CD). Statistical significance was assessed by Mann-Whitney. Only significant p values are displayed (n = 6–15 subjects in each group). See Figure S9E for the same data, displayed as clinical subtypes of CD. (C) FFPE of CD PDOs of the IDICD subtypes were analyzed for goblet (MUC2; green) and Paneth (lysozyme; red) cells by confocal immunofluorescence. Representative images are shown. Scale bar, 150 μm. Boxed regions (numbered 1, 2 in upper panels) are magnified below. See Figure S9F for quantification of images and Figure S9G for summary. (D) Electron micrographs of Paneth cells in healthy and CD PDOs of IDICD subtypes are shown. The boxed region on the left is magnified on the right. BM, basement membranes; AV, apical villi; SG, secretory granules. Scale bar, 1 μm in top and middle panels and 2 μm in the bottom panel. (E) Violin plots show the extent of DNA damage, as determined by flow cytometry analysis of γH2AX in CD PDOs vs. healthy controls (E [left], all CD subtypes combined; E [right], separated into molecular subtypes of CD). Statistical significance was assessed by Mann-Whitney (left) or one-way ANOVA (right). Only significant p values are displayed. (F) Violin plots show the extent of oxidative DNA/RNA damage in CD PDOs vs. healthy controls. Statistical significance was assessed by Mann-Whitney. Only significant p values are displayed. See Figures S10A and S10B for the display of the findings based on clinical subtypes of CD. (G) Violin plots show the extent of BrDU incorporation over 24 h on four-day-old CD PDOs grown in 96-well plates prior to assessment by ELISA. Statistical significance was assessed by Mann-Whitney (left) and one-way ANOVA (right). Only significant p values are displayed (n = 5–8 subjects in each group; 2–3 repeats in each PDO). See Figures S10C and S10D for the display of the findings based on clinical subtypes of CD. (H) Violin plots show % cells with Ki67-positive nuclei in CD PDOs vs. healthy controls. Statistical significance was assessed by Mann-Whitney. Only significant p values are displayed (n = 2–5 subjects in each group; 2–3 repeats in each PDO). See Figures S10E and S10F for the display of the findings based on clinical subtypes of CD. See Table S2 for subjects analyzed in each assay. See also Figure S11 for cellular apoptosis in CD PDOs at baseline and upon challenge with TNF-α.
Figure 5
Figure 5
Genotyped-phenotyped CD PDOs can serve as platforms for personalized therapeutics (A) Schematic outlines the strategy for therapeutic reversal of the disease driver phenotypes in each molecular subtype of CD (B–I) and for crossover efficacy across the subtypes (J–M). (B) Mean fluorescent intensity of SA-βGal staining of PDOs by flow cytometry (B- yellow cluster CD PDOs separated into groups that responded (R) or not (NR) to anti-TNF-α biologics or were naive to that treatment). Data represents 2–4 technical repeats on 4 healthy and 6 CD PDOs. Statistical significance was assessed by one-way ANOVA. (C) Histogram (left) and violin plots (right) show the % changes in the median fluorescence intensity when CD PDOs were treated with senotherapeutics (2.5 μM PAC, pacritinib; 1 mM Met, metformin). Statistical significance was assessed by one-way ANOVA. (D–E) Inverted images displayed (D) are representative of ∼10 fields/sample of max-projected z stacks of CD PDOs stained with SPiDER-SA-β-Gal. Bar graphs (E) display the quantification of staining. Scale bar, 100 μm. Statistical significance was assessed by one-way ANOVA. (F) Schematic outlines the 3 major steps in bacterial clearance assays, and the concomitant assessment of supernatants for cytokines by multiplexed ELISA. (G) Heatmap displays the results of hierarchical agglomerative clustering of AIEC-LF82-challenged healthy and CD-EDMs using the cytokine profiles determined by mesoscale (MSD). See Table S7. (H) Bar plots show the abundance of bacteria retained within healthy (H) and IDICD EDMs at 8 h after infection. Statistical significance was assessed by t test. (I) Line plots show the pre-(UN) and post-treatment (Rx) effect of a balanced PPARα/g dual agonist (1 μM PAR5359) on the abundance of bacteria at the 8 h time point in healthy (left) and IDICD (right) EDMs. Statistical significance was assessed by t test. (J and K) Violin plots show the % change in median fluorescence intensity with PAC (J) or PAR5359 (K), as determined on S2FCD PDOs with the highest senescence in (B). Statistical significance was assessed by t test. (L and M) Line plots show the untreated and effect of PAR5359 (L) or PAC (M) treatment on the abundance of bacteria at the 8 h time point in IDICD EDMs with the highest bacterial load in H. Statistical significance was assessed by t test. See Table S2 for subjects analyzed in each assay.

Update of

References

    1. Baumgart D.C., Le Berre C. Newer Biologic and Small-Molecule Therapies for Inflammatory Bowel Disease. N. Engl. J. Med. 2021;385:1302–1315. doi: 10.1056/NEJMra1907607. - DOI - PubMed
    1. Torres J., Mehandru S., Colombel J.F., Peyrin-Biroulet L. Crohn's disease. Lancet. 2017;389:1741–1755. doi: 10.1016/s0140-6736(16)31711-1. - DOI - PubMed
    1. Torres J., Colombel J.F. Genetics and phenotypes in inflammatory bowel disease. Lancet. 2016;387:98–100. doi: 10.1016/s0140-6736(15)00464-x. - DOI - PubMed
    1. Elmentaite R., Ross A.D.B., Roberts K., James K.R., Ortmann D., Gomes T., Nayak K., Tuck L., Pritchard S., Bayraktar O.A., et al. Single-Cell Sequencing of Developing Human Gut Reveals Transcriptional Links to Childhood Crohn's Disease. Dev. Cell. 2020;55:771–783.e5. doi: 10.1016/j.devcel.2020.11.010. - DOI - PMC - PubMed
    1. Lee C., An M., Joung J.G., Park W.Y., Chang D.K., Kim Y.H., Hong S.N. TNFα Induces LGR5+ Stem Cell Dysfunction In Patients With Crohn's Disease. Cell. Mol. Gastroenterol. Hepatol. 2022;13:789–808. doi: 10.1016/j.jcmgh.2021.10.010. - DOI - PMC - PubMed