. 2024 Dec:90:102037.
doi: 10.1016/j.molmet.2024.102037. Epub 2024 Sep 26.

Identifying targetable metabolic dependencies across colorectal cancer progression

Affiliations

Identifying targetable metabolic dependencies across colorectal cancer progression

Danny N Legge et al. Mol Metab. 2024 Dec.

Abstract

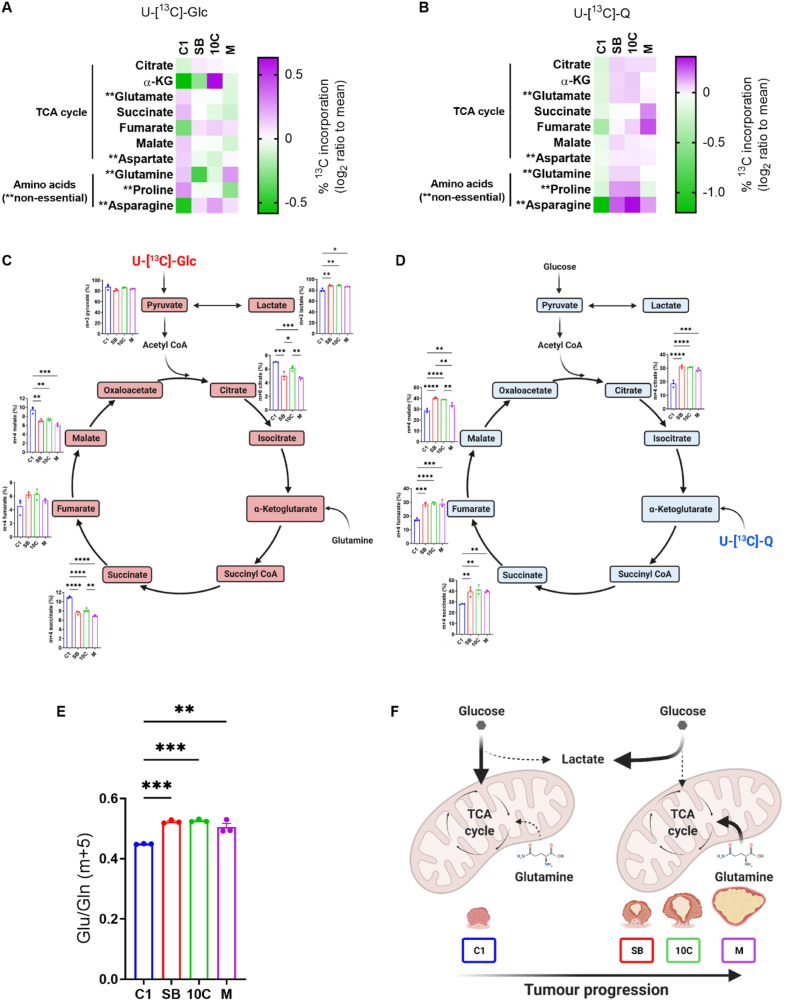
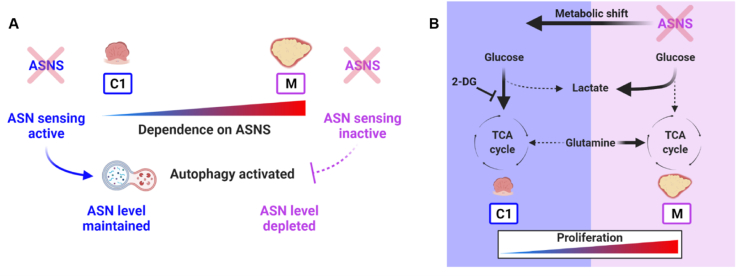
Colorectal cancer (CRC) is a multi-stage process initiated through the formation of a benign adenoma, progressing to an invasive carcinoma and finally metastatic spread. Tumour cells must adapt their metabolism to support the energetic and biosynthetic demands associated with disease progression. As such, targeting cancer cell metabolism is a promising therapeutic avenue in CRC. However, to identify tractable nodes of metabolic vulnerability specific to CRC stage, we must understand how metabolism changes during CRC development. Here, we use a unique model system - comprising human early adenoma to late adenocarcinoma. We show that adenoma cells transition to elevated glycolysis at the early stages of tumour progression but maintain oxidative metabolism. Progressed adenocarcinoma cells rely more on glutamine-derived carbon to fuel the TCA cycle, whereas glycolysis and TCA cycle activity remain tightly coupled in early adenoma cells. Adenocarcinoma cells are more flexible with respect to fuel source, enabling them to proliferate in nutrient-poor environments. Despite this plasticity, we identify asparagine (ASN) synthesis as a node of metabolic vulnerability in late-stage adenocarcinoma cells. We show that loss of asparagine synthetase (ASNS) blocks their proliferation, whereas early adenoma cells are largely resistant to ASN deprivation. Mechanistically, we show that late-stage adenocarcinoma cells are dependent on ASNS to support mTORC1 signalling and maximal glycolytic and oxidative capacity. Resistance to ASNS loss in early adenoma cells is likely due to a feedback loop, absent in late-stage cells, allowing them to sense and regulate ASN levels and supplement ASN by autophagy. Together, our study defines metabolic changes during CRC development and highlights ASN synthesis as a targetable metabolic vulnerability in later stage disease.

Keywords: Adenocarcinoma; Adenoma; Asparagine; Asparagine synthetase; Colorectal cancer; Oncometabolism.


Conflict of interest statement

Declaration of competing interest The authors declare that they have no conflict of interest.

Figures

Figure 1
Figure 1
A bioenergetic shift occurs early in colorectal tumour progression. (A) Schematic showing generation of the in vitro colorectal adenoma to carcinoma progression model. Figure created using BioRender.com. (B & C) Seahorse Extracellular Flux Analyzer traces of extracellular acidification rate (ECAR; B) and oxygen consumption rate (OCR; C). Oligo, oligomycin A; FCCP, carbonyl cyanide p-trifluoro-methoxyphenyl hydrazone; Ant, antimycin A; Rot, rotenone. (D) Rate of ATP generation via glycolysis at baseline. (E) Glycolytic index; ATP produced by glycolysis as a percentage of the total ATP produced by the cell at baseline. (F) Rate of ATP generation via oxidative phosphorylation (OxPhos) at baseline. (G) Maximal respiratory capacity (MRC); OCR following FCCP addition. (H) Spare respiratory capacity (SRC); difference between baseline OCR and MRC. (I) Bioenergetic scope of tumour cell lines detailing shift from basal to maximal ATP production from glycolytic (JATP-glycolysis) and oxidative (JATP-OxPhos) metabolism. (B–I) Data are represented as mean ± SEM of three independent cultures and normalised to cell number. (D–H) Tukey's multiple comparisons test. ∗∗p < 0.01; ∗∗∗p < 0.001; ∗∗∗∗p < 0.0001.
Figure 2
Figure 2
Central carbon metabolism changes across colorectal tumour progression. (A & B) Heatmaps showing percentage incorporation of uniformly labelled U-[13C]-Glc (A) or U-[13C]-Q (B) into downstream metabolites in each cell line. Data are represented as log2 ratio to mean for each individual metabolite from three independent cultures. (C & D) Mass isotopologue distribution (MID) analysis of TCA cycle intermediates from U-[13C]-Glc (C) or U-[13C]-Q (D). (E) Ratio of m+5 glutamate/m+5 glutamine taken from U-[13C]-Q labelling data generated in (B & D). (F) Schematic outlining early shift in central carbon metabolism across colorectal adenoma to carcinoma progression. There is an early shift to enhanced glycolytic metabolism (lactate production; Figure 1) concomitant with increased glutamine-fuelled TCA cycle anaplerosis (Figure 2) as early adenoma (C1) cells transition to intermediate adenoma (SB) cells. This is maintained through the later stages of tumour progression to late adenocarcinoma. (C, D & F) Figures created using BioRender.com. (C–E) Data are represented as mean ± SEM of three independent cultures. Tukey's multiple comparisons test. ∗p < 0.05; ∗∗p < 0.01; ∗∗∗p < 0.001; ∗∗∗∗p < 0.0001.
Figure 3
Figure 3
Adaptation to nutrient stress varies across colorectal tumour progression. (A–C) Proliferation assay in low glucose conditions. (D–G) Seahorse Extracellular Flux Analyzer oxygen consumption rate (OCR) traces in C1 (D), SB (E), 10C (F) and M (G) cells in presence (+Glc; 10 mM) or absence (-Glc; 0 mM) of glucose. Oligo, oligomycin A; FCCP, carbonyl cyanide p-trifluoro-methoxyphenyl hydrazone; Ant, antimycin A; Rot, rotenone. (H–J) Rates of maximal ATP generation via glycolysis (H), basal ATP generation via OxPhos (I) and maximal ATP generation via OxPhos (J) in the absence of glucose. (K) Spare respiratory capacity (SRC) in the absence of glucose. Data expressed as -Glc/+Glc. (L–N) Proliferation assay low glutamine conditions. (O–R) OCR traces in C1 (O), SB (P), 10C (Q) and M (R) cells in presence (+Q; 2 mM) or absence (-Q; 0 mM) of glutamine. (S–V) Rate of maximal ATP generation via OxPhos (S), spare respiratory capacity (T), and rates of basal ATP generation via glycolysis (U) and maximal ATP generation via glycolysis (V) in the absence of glutamine. Data expressed as -Q/+Q. Data are represented as mean ± SEM of three independent cultures. (B, C, M & N) Tukey's multiple comparisons test. (H–K; S–V) One sample t-test. ∗p < 0.05; ∗∗p < 0.01; ∗∗∗p < 0.001.
Figure 4
Figure 4
Amino acid metabolism is dysregulated across colorectal adenoma to carcinoma progression. (A) Volcano plot of data summarising proteomic analysis of C1 vs M cells. Significantly upregulated proteins (M/C1) are marked in red, downregulated in blue and non-significant in black (FDR<5%, -log10 p-value>1.3 and log2 fold change+/−0.48). (B & C) Gene Ontology (GO) biological process (B) and Kyoto Encyclopedia of Genes and Genomes (KEGG) pathway enrichment (C) analyses of the 2251 significantly regulated proteins identified in (A). (D) Heatmap displaying relative abundance of amino acids in each of the cell lines. Data are represented as log2 ratio to mean for each individual amino acid from three independent cultures. (E) Schematic of non-essential amino acid (NEAA) biosynthesis pathways branching off from glycolysis and the TCA cycle. Colour of enzyme (oval) represents degree of upregulation (red) or downregulation (blue) of abundance (M/C1) using proteomics data generated in (A). Significantly regulated enzymes in bold. Figure created using BioRender.com. (F–M) Relative abundance data of indicated NEAA in (D) including the proportion of U-[13C]-Glc incorporation, this represents the total amount of 13C incorporation into each metabolite. (N & O) Mass isotopologue distribution of asparagine in C1 and M cells by U-[13C]-Glc (N) or U–13C-Q (O) labelling. Student's t-test. ∗p < 0.05; ∗∗p < 0.01; ∗∗∗p < 0.001. (F–O) Data are represented as mean ± SEM of three independent cultures.
Figure 5
Figure 5
ASNS expression is increased in colorectal cancer and supports tumour cell proliferation through ASN synthesis. (A) Schematic of the asparagine biosynthesis pathway. Colour of amino acids (rectangles) represents their relative abundance in M cells (log2 ratio to mean for each amino acid) using data from heatmap in Figure 4D. Colour of asparagine synthetase (ASNS) represents significant upregulation of ASNS in M/C1 using data from Figure 4E. Figure created using BioRender.com. (B) Immunoblot of ASNS abundance in cell lines indicated. α-Tubulin serves as loading control. Representative of three independent experiments. (C) Violin plot of ASNS expression in normal (n = 377), tumour (n = 1450) and metastatic (n = 99) human colorectal tissue using TNMplot [27] and publicly available gene chip data from The Cancer Genome Atlas (TCGA). ASNS expression was significantly increased in colorectal tumours (2.64-fold; Dunn's p = 1.84 × 10−116) and metastases (2.22-fold; Dunn's p = 3.38 × 10−2) compared to normal colonic tissue. (D) Overall survival analysis in relation to ASNS expression from GSE17536 [29]. Cohort divided at median of ASNS expression. n = 174; HR 1.63; p = 0.013. (E & F) Proliferation of C1 (E) and M (F) cells following transfection with non-targeting control (Control) or ASNS-targeting siRNA, with or without 0.1 mM asparagine (ASN) supplementation. Basal ATP generation via OxPhos in C1 (G) and M (I) cells and basal ATP generation via glycolysis in C1 (H) and M (J) cells following transfection with non-targeting control (Control) or ASNS-targeting siRNA, with or without 0.1 mM ASN supplementation. (K–N) Stable isotope labelling (SIL) using uniformly labelled U-[13C]-Q (K & L) or U-[13C]-Glc (M & N). Data represent the percentage of total 13C incorporation (combining all labelled isotopologues) into TCA cycle intermediates and associated amino acids in C1 (K & M) and M (L & N) cells. (O) Proliferation of M cells following transfection with non-targeting control (Control) or ASNS-targeting siRNA, with vehicle control (VC) or 10 mM 2-Deoxy-d-Glucose (2-DG). Assay performed as in (E & F). (E–O) Data are represented as mean ± SEM of three independent cultures. (G–N) Student's t-test. (O) Tukey's multiple comparisons test ∗p < 0.05; ∗∗p < 0.01; ∗∗∗p < 0.001.
Figure 6
Figure 6
ASNS activity is required for maintaining mTORC1 signalling in adenocarcinoma cells but is dispensable in early adenomas. (A–D) Analysis of mTORC1 signalling following siRNA-mediated ASNS suppression. Immunoblots of ASNS, phosphorylated ribosomal S6 protein (S235/236) and phosphorylated ULK1 (S575) expression following transfection with non-targeting control or ASNS-targeting siRNA, with or without 0.1 mM ASN supplementation in C1 (A) and M (C) cells. α-Tubulin serves as loading control. Quantification of three independent cultures by densitometry using Image J in C1 (B) and M (D) cells. (E & F) Proliferation of C1 cells following transfection with non-targeting control or ASNS-targeting siRNA, with or without 10 μM chloroquine (CQ). Water used as vehicle control (VC). (G) Relative abundance of ASNS protein (ASNS/α-Tubulin) in C1 cells following 10 μM CQ addition. (H) Relative abundance of ASNS protein (ASNS/α-Tubulin) following 0.1 mM ASN supplementation in cell lines indicated. (G & H) Quantification of three independent cultures by densitometry using Image J. (A–H) Data are represented as mean ± SEM of three independent cultures. (B & D) One sample t-test. (F) Tukey's multiple comparisons test. (G & H) Student's t-test. ∗p < 0.05; ∗∗p < 0.01; ∗∗∗p < 0.001.
Figure 7
Figure 7
ASNS is a node of metabolic vulnerability in later stage colorectal adenocarcinoma cells. (A) Late-stage adenocarcinoma cells (M) have become addicted to ASN but have an inactive ASN-sensing mechanism. This renders them unable to sense and react to levels of ASN via autophagy activation, leaving them with insufficient ASN to maintain their high proliferative rate. Thus, M cells are vulnerable to ASNS depletion in the absence of extracellular ASN. Early adenoma cells (C1) can sense high or low ASN levels and regulate expression of ASNS accordingly to keep a check on cellular proliferation, or in the event of ASNS loss can activate autophagy to maintain intracellular ASN level (Figure 6). (B) Targeting ASNS in late adenocarcinoma (M) cells using siRNA reduces glutamine-derived carbon flux into the TCA cycle. This causes compensatory influx of glucose-derived carbon into the TCA cycle, diverting glucose carbon away from lactate production (Figure 5). This shifts the metabolic and proliferative phenotype of M cells back towards that of the early adenoma (C1) cells. Targeting this compensatory glucose shuttling into the TCA cycle with 2-DG further sensitises M cells to ASNS suppression (Figure 5O). Figure created using BioRender.com.

References

    1. Sung H., Ferlay J., Siegel R.L., Laversanne M., Soerjomataram I., Jemal A., et al. Global cancer statistics 2020: GLOBOCAN estimates of incidence and mortality worldwide for 36 cancers in 185 countries. CA A Cancer J Clin. 2021;71(3):209–249. - PubMed
    1. Bloem L.T., De Abreu Lourenço R., Chin M., Ly B., Haas M. Factors impacting treatment choice in the first-line treatment of colorectal cancer. Oncol Ther. 2016;4(1):103–116. - PMC - PubMed
    1. Chambers A.C., Dixon S.W., White P., Williams A.C., Thomas M.G., Messenger D.E. Demographic trends in the incidence of young-onset colorectal cancer: a population-based study. Br J Surg. 2020;107(5):595–605. - PMC - PubMed
    1. Fearon E.R., Vogelstein B. A genetic model for colorectal tumorigenesis. Cell. 1990;61(5):759–767. - PubMed
    1. Jackman R.J., Mayo C.W. The adenoma-carcinoma sequence in cancer of the colon. Surg Gynecol Obstet. 1951;93(3):327–330. - PubMed

Substances