. 2024 Sep 27;15(1):8334.
doi: 10.1038/s41467-024-52600-2.

USF2 and TFEB compete in regulating lysosomal and autophagy genes

Affiliations

USF2 and TFEB compete in regulating lysosomal and autophagy genes

Jaebeom Kim et al. Nat Commun. .

Abstract

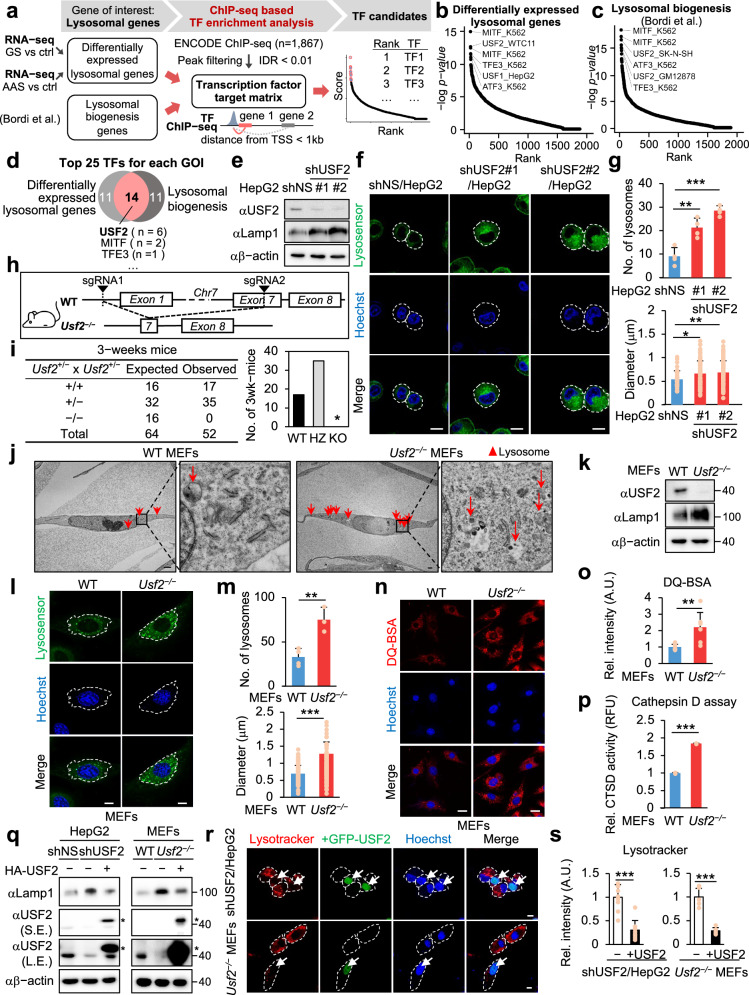
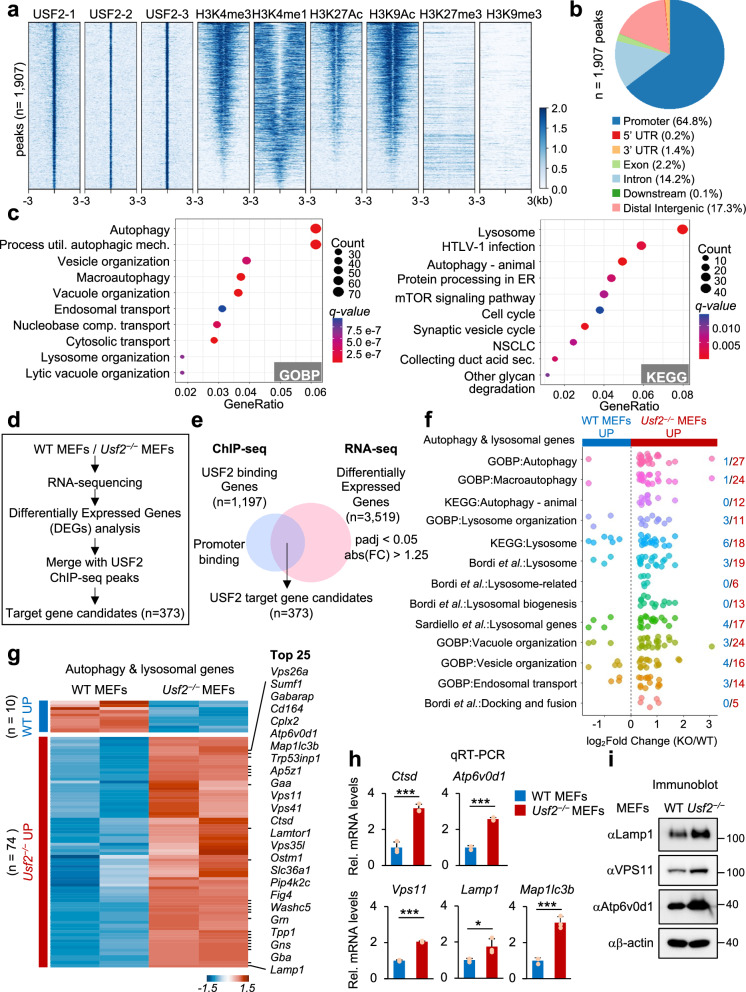
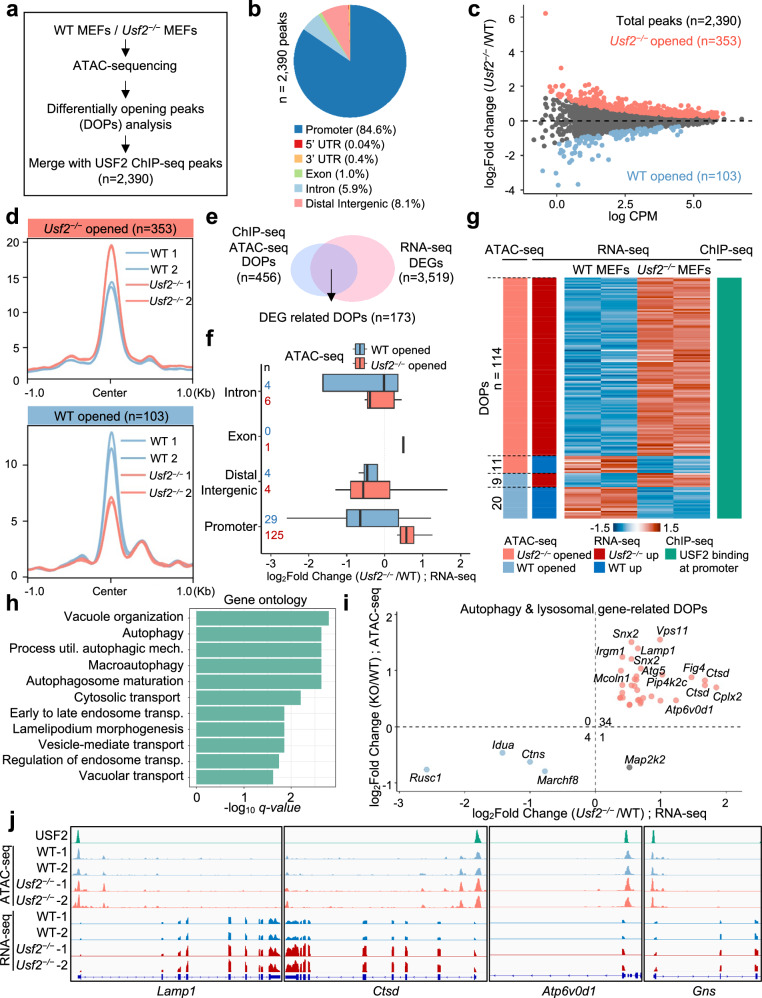
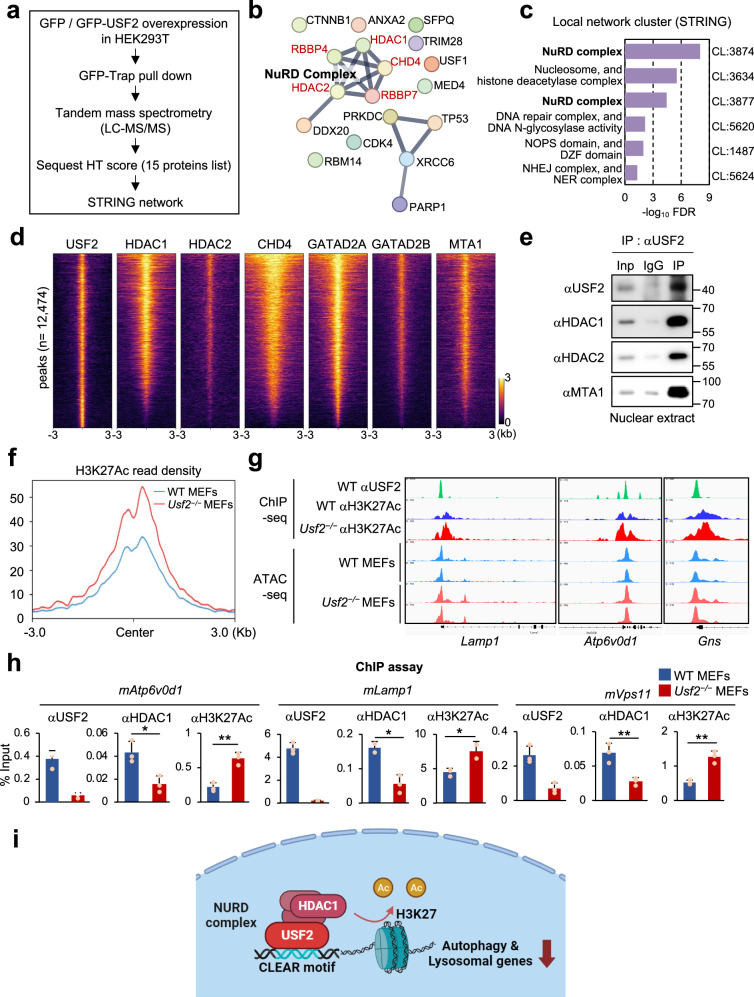
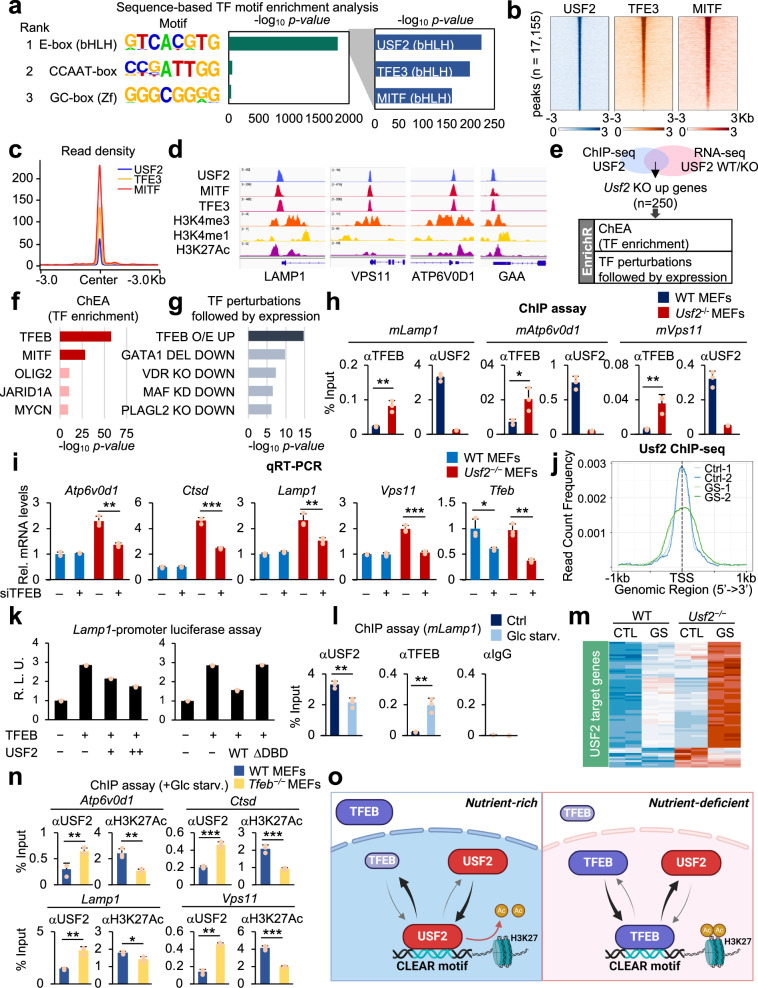
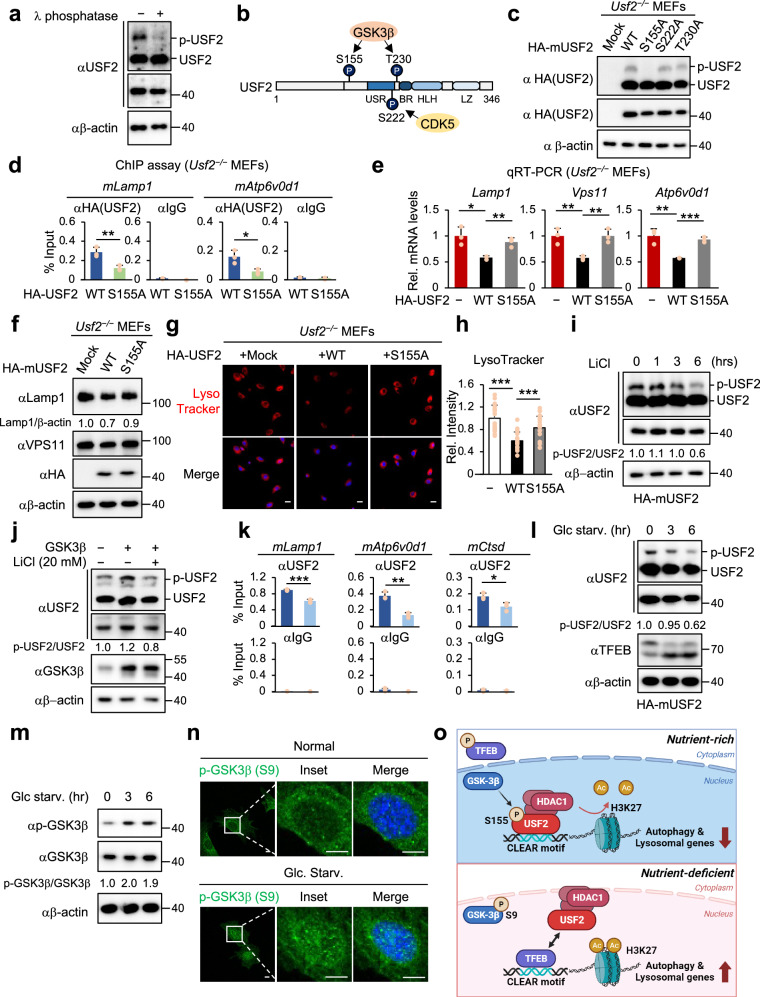
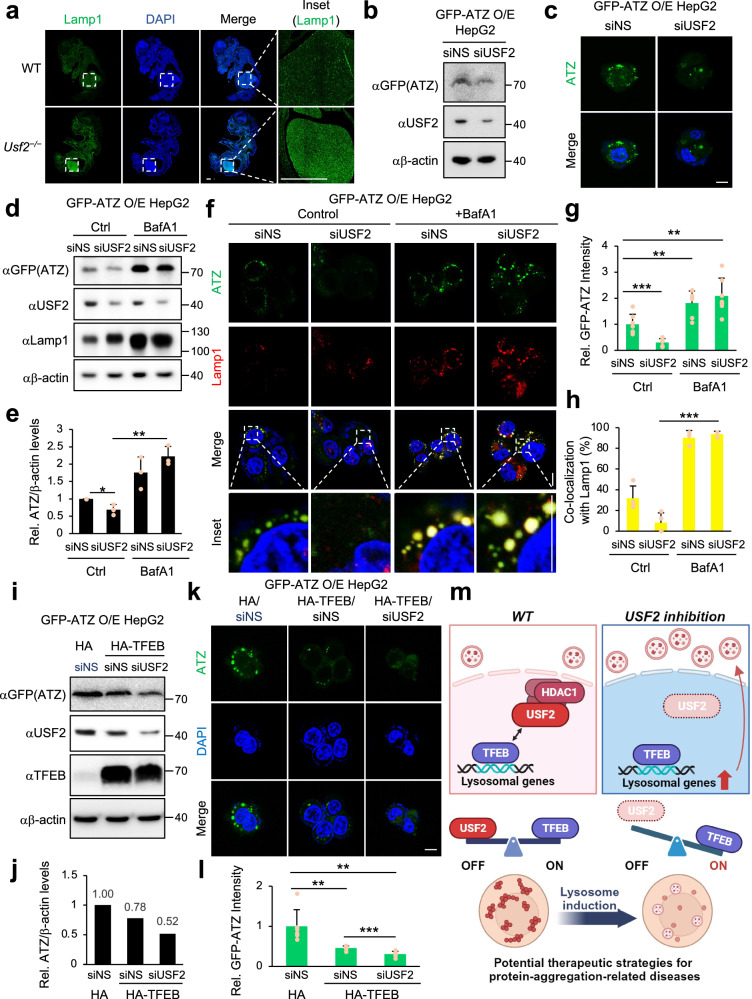
Autophagy, a highly conserved self-digestion process crucial for cellular homeostasis, is triggered by various environmental signals, including nutrient scarcity. The regulation of lysosomal and autophagy-related processes is pivotal to maintaining cellular homeostasis and basal metabolism. The consequences of disrupting or diminishing lysosomal and autophagy systems have been investigated; however, information on the implications of hyperactivating lysosomal and autophagy genes on homeostasis is limited. Here, we present a mechanism of transcriptional repression involving upstream stimulatory factor 2 (USF2), which inhibits lysosomal and autophagy genes under nutrient-rich conditions. We find that USF2, together with HDAC1, binds to the CLEAR motif within lysosomal genes, thereby diminishing histone H3K27 acetylation, restricting chromatin accessibility, and downregulating lysosomal gene expression. Under starvation, USF2 competes with transcription factor EB (TFEB), a master transcriptional activator of lysosomal and autophagy genes, to bind to target gene promoters in a phosphorylation-dependent manner. The GSK3β-mediated phosphorylation of the USF2 S155 site governs USF2 DNA-binding activity, which is involved in lysosomal gene repression. These findings have potential applications in the treatment of protein aggregation-associated diseases, including α1-antitrypsin deficiency. Notably, USF2 repression is a promising therapeutic strategy for lysosomal and autophagy-related diseases.


Conflict of interest statement

A.B. is cofounder of CASMA Therapeutics, Inc., and Advisory board member of NexGeneration Diagnostics and Avilar Therapeutics. The remaining authors declare no competing interests.

Figures

Fig. 1
Fig. 1. USF2 represses the biogenesis of functionally mature lysosomes.
a A schematic that illustrates a screening process to identify lysosome-associated transcription factors and the corresponding transcription factor (TF) enrichment ranks from the ENCODE TF ChIP-seq database. b TF enrichment rank plot in differentially expressed genes. c TF enrichment rank plot in the term of lysosomal biogenesis d Venn diagram illustrating the overlapping enriched TFs related to lysosomes. e Immunoblot analysis of USF2 and Lamp1 expression in shNS HepG2 and shUSF2 HepG2 cell lines. f Representative images depict Lysosensor staining in shNS HepG2 and shUSF2 HepG2 cell lines. These images were captured using a confocal microscope under identical settings. The white guidelines indicate the cell boundaries. Lysosensor, green; Hoechst, blue. Scale bar, 20 μm. g Quantification of lysosomal number per cell and diameter per lysosome in shNS HepG2 and shUSF2 HepG2 cell lines. n  =  4 biologically independent samples. Statistical analysis was performed using a two-tailed t-test. shUSF2 HepG2#1 and shUSF2 HepG2#2 cell lines were individually compared to shNS HepG2. h Schematic drawing of the generation of Usf2 whole-body knockout mice. i Summary of genotyping results for the offspring of Usf2 heterozygous crosses. “Expected” represents the theoretical number of offspring expected based on the Mendelian ratio for an analysis of similar size. The graph on the right represents the “Observed” in the table. j Representative TEM images of WT and Usf2−/− MEFs. Scale bar, 2 μm. High magnification of the boxed areas is shown on the right. Lysosomes (red arrows). k Immunoblot analysis of USF2 and Lamp1 expression in WT and Usf2−/− MEFs. l Representative confocal images of Lysosensor staining in WT and Usf2−/− MEFs. m Quantification of lysosomal number per cell and diameter per lysosome in WT and Usf2−/− MEFs. n  =  4 biologically independent samples. Statistics by two-tailed t-test using WT and Usf2−/− MEFs as a comparison. n Representative confocal images of DQ-BSA staining. WT and Usf2−/− MEFs were treated with DQ-BSA. DQ-BSA, red; Hoechst, blue. Scale bar, 20 μm. o Quantification of DQ-BSA intensity per cell in WT and Usf2−/− MEFs. n  =  6 biologically independent samples. Statistics by two-tailed t-test using WT and Usf2−/− MEFs as a comparison. p Analysis of the activity of lysosomal cathepsin D in WT and Usf2−/− MEFs. n  =  2 biologically independent samples. Statistics by two-tailed t-test using WT and Usf2−/− MEFs as a comparison. q Immunoblot analysis of shNS, shUSF2, and USF2 (GFP-USF2) reconstituted shUSF2 HepG2 cell lines (left), and WT, Usf2−/−, and USF2 reconstituted Usf2−/− MEFs (right). r Representative images of Lysotracker staining in shUSF2 HepG2 cell line and Usf2−/− MEFs reconstituted with GFP-USF2. Lysotracker, red; GFP, green; Hoechst, blue. Scale bar, 10 μm. s Quantification of Lysotracker intensity per cell in shUSF2 HepG2 cell line and in Usf2−/− MEFs. n  =  9 biologically independent samples for HepG2 cells and n = 5 biologically independent samples for MEFs. Statistics by two-tailed t-test using shNS and shUSF2 HepG2 cell line or WT and Usf2−/− MEFs as each comparison. Data are presented as mean ± standard error of the mean (SEM). *, p < 0.05; **, p < 0.01; ***, p < 0.001. Source data are provided as a Source Data file.
Fig. 2
Fig. 2. ChIP-sequencing and RNA-sequencing reveal that USF2-dependent genes are enriched in lysosomal genes.
a Analysis of histone markers in regions with USF2 peaks. Each row indicates a 6 kb window centered on a USF2 binding site. b Annotation of USF2 peaks based on their genomic location. c Gene ontology and KEGG pathway analysis of USF2-bound genes. d Schematic illustrating the integrated analysis of RNA-seq results from WT and Usf2−/− MEFs and ChIP-seq results for USF2. e Venn diagram showing 373 USF2 target candidates obtained by combining USF2 binding genes from USF2 ChIP-seq and differentially expressed genes (DEGs) from RNA-seq. f Fold change distribution of genes belonging to autophagy and lysosomal gene lists based on the presence or absence of USF2. Blue numbers indicate the number of genes with increased expression in WT, while red numbers indicate the number of genes with increased expression in Usf2−/−. g Heatmap of the gene expression of USF2 target genes belonging to autophagy and lysosomal genes. Top 25 significantly upregulated genes in Usf2−/− are listed on the right. h qRT-PCR assay of USF2 target genes in WT and Usf2−/− MEFs. n = 3 technical replicates. Statistics by two-tailed t-test using WT and Usf2−/− MEFs as a comparison. Data are presented as mean ± SEM. *, p < 0.05; ***, p < 0.001. i Immunoblot assay of USF2 target proteins in WT and Usf2−/− MEFs. Source data are provided as a Source Data file.
Fig. 3
Fig. 3. USF2 binding reduces chromatin accessibility and expression of autophagy and lysosomal genes.
a Schematic of the ATAC-seq analysis workflow for WT and Usf2−/− MEFs. b Annotation of ATAC-seq peaks based on their genomic location. c A scatter plot illustrating ATAC-seq results shows peaks that are more accessible in Usf2−/− depicted in red, and those more accessible in WT depicted in blue. d Read density plots for DOPs that are more accessible in Usf2−/− (upper) and WT (bottom). e Venn diagram showing 173 DEG-related DOPs obtained by combining DOPs from USF2 ChIP-seq and ATAC-seq results and DEGs obtained from RNA-seq. f Box plot illustrating the expression changes of the nearest genes to DEG-related DOPs at each genomic location. The number on the left of the box plot represents the number of DEG-related DOP used in the graph. For box plots, the vertical line represents the median value, the lower and upper quartiles represent the 25th and 75th percentile, and the whiskers show the maximum and minimum values (excluding the outliers). g Heatmap illustrating the expression of genes closest to DEG-related DOPs. h Gene ontology analysis of the genes showing DOPs in the promoters. i Graph depicting the correlation between chromatin accessibility and gene expression in DOPs associated with autophagy and lysosomal genes. j Visualization of USF2 ChIP-seq peaks, ATAC-seq signals, and RNA-seq coverage plots in USF2 target genes.
Fig. 4
Fig. 4. USF2 represses lysosomal genes along with NuRD complex through H3K27 deacetylation.
a Flowchart of the experiment to identify USF2-binding proteins. b Visualization of the binding network of USF2 binding partners obtained through LC-MS/MS using the STRING database. c Results of the local network cluster analysis in STRING using USF2 binding partners. d Heatmap depicting the enrichment of NURD complex components at USF2 binding sites. Each row indicates a 6 kb window centered on a USF2 binding site. e Binding between USF2 and NuRD complex subunits. Immunoprecipitation assay was performed by pulling down USF2, followed by immunoblotting with anti-HDAC1, anti-HDAC2, and anti-MTA1 antibodies to detect the endogenous protein expression levels. The representative images supported by the relevant statistics have been chosen from three independent preparations with similar outcomes. f Read density plots for ChIP-seq peaks of H3K27Ac in WT and Usf2−/− MEFs. g Visualization of USF2 and H3K27Ac ChIP-seq peaks, and ATAC-seq signals in USF2 target genes. h ChIP assays on USF2-dependent promoters in WT and Usf2−/− MEFs. n = 3 technical replicates. Statistics by two-tailed t-test using WT and Usf2−/− MEFs as a comparison. i Schematics of the repression mechanism of USF2-NuRD complex. Data are presented as mean ± SEM. *, p < 0.05; **, p < 0.01; ***, p < 0.001. Source data are provided as a Source Data file.
Fig. 5
Fig. 5. USF2 and TFEB antagonistically regulate lysosomal genes.
a In silico motif analysis using USF2 ChIP-seq data. b Heatmap depicting the enrichment of TFE3 and MITF at USF2 binding sites. Each row indicates a 6 kb window centered on a USF2 binding site. c Read density plots for ChIP-seq peaks of USF2, TFE3, and MITF. d Visualization of ChIP-seq peaks for USF2, MITF, TFE3, and histone modification markers H3K4me3, H3K4me1, H3K27Ac in USF2 target genes. e EnrichR gene set analysis of USF2 repressive target genes. f ChEA TF enrichment using Usf2 KO up-regulated genes. g TF perturbation analysis using Usf2 KO up-regulated genes. h ChIP assays on USF2-dependent promoters in WT and Usf2−/− MEFs using anti-TFEB and anti-USF2 antibodies. n = 3 technical replicates. Statistics by two-tailed t-test using WT and Usf2−/− MEFs as a comparison. i qRT-PCR assay of USF2 target genes in WT and Usf2−/− MEFs with or without TFEB knockdown. n = 3 technical replicates. Statistics by two-tailed t-test using WT and Usf2−/− MEFs as a comparison. j Normalized USF2 ChIP-seq peaks under normal and glucose starvation (GS) conditions. k Lamp1 promoter-luciferase reporter assays. n = 3 technical replicates. l ChIP assays on the Lamp1 promoter in WT MEFs under normal and GS conditions using anti-USF2 and anti-TFEB antibodies. n = 3 technical replicates. Statistics by two-tailed t-test using nutrient rich and glucose starved WT MEFs as comparison. m A heatmap illustrating expression of DEGs obtained from the RNA-seq results in WT and Usf2−/ − MEFs under normal and GS conditions. n ChIP assays on USF2-dependent promoters in WT and Tfeb−/− MEFs under normal and GS conditions. n = 3 technical replicates. Statistics by two-tailed t-test using WT and Tfeb−/− MEFs as a comparison. o Schematics of the repression mechanism of USF2-NuRD complex. Data are presented as mean ± SEM. *, p < 0.05; **, p < 0.01; ***, p < 0.001. Figure 5/panel o Created with BioRender.com released under a Creative Commons Attribution-NonCommercial-NoDerivs 4.0 International license. Source data are provided as a Source Data file.
Fig. 6
Fig. 6. Phosphorylation of USF2 at S155 by GSK3β enhances DNA-binding activity.
a Immunoblot analysis in the presence or absence of λ-phosphatase treatment in WT MEFs. b Schematic representation of well-characterized phosphorylation sites on USF2 and the associated kinases responsible for this modification. c Immunoblot analysis using phos-tagTM gel conducted after reconstituting WT, S155A, S222A, and T230A mutants in Usf2−/− MEFs. d ChIP assay on the promoters of lysosomal genes following the reconstitution of WT and S155A mutant in Usf2−/− MEFs. n = 3 technical replicates. Statistics by two-tailed t-test using USF2 WT and S155A mutant expressed Usf2−/− MEFs as comparison. e qRT-PCR assay of lysosomal genes conducted after reconstituting mock, WT, and S155A mutant in Usf2−/− MEFs. n = 3 technical replicates. Statistical analysis performed using a two-tailed t-test. Mock and USF2 S155A mutant rescued cells were individually compared to USF2 WT rescued cells. f Immunoblot analysis of lysosomal proteins conducted after reconstituting mock, WT, and S155A mutant in Usf2−/− MEFs. g Representative images of Lysotracker staining. Lysotracker assay was performed after reconstituting mock, WT, and S155A mutant in Usf2−/− MEFs. Lysotracker, red; Hoechst, blue. Scale bar, 20 μm. h Quantification of Lysotracker intensity per cell. Lysotracker assay was performed after reconstituting mock, WT, and S155A mutant in Usf2−/− MEFs. n = 18 biologically independent samples. Statistical analysis performed using a two-tailed t-test. Mock and USF2 S155A mutant rescued cells were individually compared to USF2 WT rescued cells. i Immunoblot analysis using phos-tagTM gel under normal and LiCl treated conditions at different time points. j Immunoblot analysis using phos-tagTM gel under normal, GSK3β-overexpressed, and LiCl treated conditions. k ChIP assay on the promoters of lysosomal genes in WT MEFs under normal and LiCl treated condition. n = 3 technical replicates. Statistics by two-tailed t-test using normal and LiCl treated WT as comparison. l Immunoblot analysis using phos-tagTM gel for USF2 immunoblotting under normal and GS conditions. m Immunoblot analysis under normal and GS conditions in WT MEFs. n Representative confocal microscopic images using GSK3β Ser9 phosphorylation antibody under normal and GS conditions. p-GSK3β (Ser9), green; DAPI, blue. Scale bar, 10 μm. o Schematics of the regulation of autophagy and lysosome genes by USF2 and TFEB under nutrient-rich or deficient condition. Data are presented as mean ± SEM. *, p < 0.05; **, p < 0.01; ***, p < 0.001. Figure 6/panel o Created with BioRender.com released under a Creative Commons Attribution-NonCommercial-NoDerivs 4.0 International license. Source data are provided as a Source Data file.
Fig. 7
Fig. 7. Inhibition of USF2 stimulates clearance of α1-Antitrypsin Mutant Z.
a Immunofluorescence staining to detect the expression of lysosomal proteins, such as Lamp1, in 16.5-day-old WT and Usf2−/− embryos. Lamp1, green; Hoechst, blue. Scale bar, 1 mm. b Immunoblot analysis of GFP-ATZ following the transfection of siNS or siUSF2 into HepG2 cell lines stably expressing GFP-ATZ (GFP-ATZ O/E HepG2). c Representative confocal microscopic images of GFP-ATZ in cells as in b. Scale bar, 10 μm. d Immunoblot analysis of GFP-ATZ O/E HepG2 cell lines with and without USF2 knockdown and in the presence or absence of Bafilomycin A1 (BafA1) treatment. e Quantification of GFP-ATZ protein levels relative to β-actin. n = 3 biologically independent samples. Statistical analysis performed using a two-tailed t-test. siNS and siUSF2+BafA1 cells were individually compared to siUSF2 cells. f Representative confocal microscopic images of GFP-ATZ O/E HepG2 cell lines with and without USF2 knockdown and in the presence or absence of BafA1 treatment. ATZ, green; Lamp1, red; DAPI, blue. Scale bar, 10 μm. g Quantification of GFP-ATZ intensity. n = 7 biologically independent samples. Statistical analysis performed using a two-tailed t-test. siUSF2, siNS+BafA1 and siUSF2+BafA1 cells were individually compared to siNS cells. h Quantification of co-localization of Lamp1 and GFP-ATZ. n = 3 biologically independent samples. Statistical analysis performed using a two-tailed t-test. siUSF2 treated cells were compared to siUSF2+BafA1 treated cells. i Immunoblot analysis of GFP-ATZ O/E HepG2 cell lines after overexpression of TFEB and knockdown of USF2. j Quantification of GFP-ATZ protein levels relative to β-actin. k Representative confocal images of GFP-ATZ O/E HepG2 cell lines after overexpression of TFEB and knockdown of USF2. Scale bar, 10 μm. l Quantification of GFP-ATZ intensity. n = 5 biologically independent samples. Statistical analysis performed using a two-tailed t-test. siNS, siNS+HA-TFEB cells were individually compared to siUSF2+HA-TFEB cells. m Schematics of therapeutic strategies for α1-antitrypsin deficiency by enhancing autophagy and lysosomal function through the inhibition of USF2 and the activation of TFEB. Data are presented as mean ± SEM. **, p < 0.01; ***, p < 0.001. Figure 7/panel m Created with BioRender.com released under a Creative Commons Attribution-NonCommercial-NoDerivs 4.0 International license. Source data are provided as a Source Data file.

Similar articles

Cited by

References

    1. Klionsky, D. J. & Emr, S. D. Autophagy as a regulated pathway of cellular degradation. Science290, 1717–1721 (2000). - PMC - PubMed
    1. Mizushima, N., Levine, B., Cuervo, A. M. & Klionsky, D. J. Autophagy fights disease through cellular self-digestion. nature451, 1069–1075 (2008). - PMC - PubMed
    1. Ballabio, A. & Bonifacino, J. S. Lysosomes as dynamic regulators of cell and organismal homeostasis. Nat. Rev. Mol. cell Biol.21, 101–118 (2020). - PubMed
    1. Parenti, G., Andria, G. & Ballabio, A. Lysosomal storage diseases: from pathophysiology to therapy. Annu. Rev. Med.66, 471–486 (2015). - PubMed
    1. Platt, F. M., d’Azzo, A., Davidson, B. L., Neufeld, E. F. & Tifft, C. J. Lysosomal storage diseases. Nat. Rev. Dis. Prim.4, 27 (2018). - PubMed

Publication types

MeSH terms

Substances

Associated data