. 2024 Sep 27;15(1):8338.
doi: 10.1038/s41467-024-52285-7.

Proteogenomic characterization of skull-base chordoma

Affiliations

Proteogenomic characterization of skull-base chordoma

Qilin Zhang et al. Nat Commun. .

Abstract

Skull-base chordoma is a rare, aggressive bone cancer with a high recurrence rate. Despite advances in genomic studies, its molecular characteristics and effective therapies remain unknown. Here, we conduct integrative genomics, transcriptomics, proteomics, and phosphoproteomics analyses of 187 skull-base chordoma tumors. In our study, chromosome instability is identified as a prognostic predictor and potential therapeutic target. Multi-omics data reveals downstream effects of chromosome instability, with RPRD1B as a putative target for radiotherapy-resistant patients. Chromosome 1q gain, associated with chromosome instability and upregulated mitochondrial functions, lead to poorer clinical outcomes. Immune subtyping identify an immune cold subtype linked to chromosome 9p/10q loss and immune evasion. Proteomics-based classification reveals subtypes (P-II and P-III) with high chromosome instability and immune cold features, with P-II tumors showing increased invasiveness. These findings, confirmed in 17 paired samples, provide insights into the biology and treatment of skull-base chordoma.


Conflict of interest statement

The authors declare no competing interests.

Figures

Fig. 1
Fig. 1. Multi-omics landscape of skull-base chordoma (SBC).
A Schematic overview of the number of tumors profiled and various data types data acquired for this cohort. B Genetic profile of genes that were mutated in at least 4% of the cases (upper) or known chordoma-related genes. C Comparisons of tumor mutational burden (TMB) between SBC cohort and other cancer cohorts included in The Cancer Genome Atlas (TCGA). D Significant GISTIC arm-level copy number alterations (CNAs) in primary SBC tumors (q < 0.1). E The percentage of arm-level CNA gain and loss events in primary SBC tumors. F Distribution of chromosome instability (CIN) status and GISTIC CNAs in SBC tumors. Samples are ordered by CIN score. G Survival Kaplan–Meier curves of primary SBC patients with CIN-high (CIN + , n = 43) or CIN-low (CIN-, n = 61) status (p-value from log rank test). Left panel, overall survival (OS); right panel, progression-free survival (PFS). H CIN score among primary tumors, recurrent tumors without radiotherapy and recurrent tumors after radiotherapy in SBC (Wilcoxon rank-sum test, p = 0.0024, p = 0.0004). Primary tumor, n = 107; recurrent tumor without radiotherapy, n = 36; recurrent tumor after radiotherapy, n = 23. The middle bar represents the median, and the box represents the interquartile range; bars extend to 1.5 × the interquartile range. Source data are provided with this paper.
Fig. 2
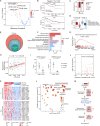
Fig. 2. Proteogenomic analysis of CIN + SBC on mRNA, protein, and phosphoprotein expressions levels.
A Enrichment analysis of differential expressed proteins (FDR < 0.05) between CIN+ and CIN- SBCs. B Scatterplot showing the Spearman’s correlation coefficient and p-value of the MGPS score versus CIN score (two-sided, 95% CI for the regression band), n = 163. C The proliferation curve of the CIN+ cells and the control cells (n = 3, mean ± SEM, biological replicates). D The flow cytometry analysis showing cell cycle progression of the CIN+ cells compared with the control cells. E ssGSEA scores of known CIN cause pathways between CIN+ (n = 86) and CIN- (n = 77) SBC samples (Student’s t-test, two-sided). The middle bar represents the median, and the box represents the interquartile range; bars extend to 1.5 × the interquartile range. F The heatmap of CIN score and protein abundance of DNA replication stress (RS) markers, n = 163. The Spearman’s correlation p-values between the CIN score and the protein/pathway, and the Student’s t-test p-values (two-sided) between CIN+ and CIN- samples were displaying in asterisks. The significance is defined as: n.s., not significant; *p < 0.05; **p < 0.01; ***p < 0.001. G Scatterplot showing the Spearman’s correlation (two-sided) between the ssGSEA scores of the DNA RS pathway and hallmark pathways. H Scatterplot showing the Spearman’s correlation coefficients (two-sided) of the CIN score versus mRNA expression levels (x axis) and transcription factor (TF) activities (y axis) of E2Fs. I Scatterplot showing the Spearman’s correlation coefficients (two-sided) between the E2F3 TF activity and kinase activities, n = 157. J Heatmap of the multi-omics features related to regulation of cell cycle in CIN + SBC. K Apoptosis pathway expression score are negatively correlated with CIN score in SBC. Spearman’s correlation and p-value are shown (two-sided, 95% CI), n = 163. L The flow cytometry analysis showing decreased apoptosis in the CIN+ cells compared with the control cells. Annexin V-positive cells (early apoptotic cells, Q4) and Annexin V and PI double-positive cells (late apoptotic cells, Q2) are shown.
Fig. 3
Fig. 3. Impacts of chromosome 1q gain in SBC.
A Volcano plot showing significant arm-level CNA events in primary SBCs (n = 106) and their associations with prognosis (Hazard ratio, 95% CI). B Survival Kaplan–Meier curves of primary SBC patients with 1q gain (n = 38) or others (n = 66) (p-value from log rank test). Upper panel, OS; lower panel, PFS. C Stacked bar plot showing the proportions of tumors with or without 1q gain in CIN+ and CIN- SBC (Fisher’s exact test, two-sided, n = 163). D Boxplot showing differential CIN score among primary/recurrent SBC tumors with/without 1q gain (Wilcoxon rank-sum test): primary with 1q gain (n = 35), primary without 1q gain (n = 71), recurrent with 1q gain (n = 25), and recurrent without 1q gain (n = 31). The middle bar represents the median, and the box represents the interquartile range; bars extend to 1.5 × the interquartile range. E Venn diagram showing the significant cis events on chromosome 1q (Spearman’s correlation, two-sided, p < 0.05, Rho > 0.2), n = 163. F Pathways enriched for significant 1q cis-effect genes (q value < 0.05), n = 163. G GSEA plot showing upregulated mitochondrial gene expression in the tumors with 1q gain versus the others. H Scatterplot showing the Spearman’s correlation coefficient and p-value (two-sided) of the CIN score versus the ssGSEA score of mitochondrion gene set (95% CI for the regression band), n = 163. I The histochemistry scores (H-scores) of ATP5A1 (n = 5) and TOMM20 (n = 3) between tumors with 1q gain and tumors with 1q WT (Student’s t-test, two-sided, mean ± SEM). J Scatterplot showing the Spearman’s correlation coefficients (two-sided) of mitochondrial gene set scores versus 1q copy number (x axis, n = 163) and the associations with prognosis (y axis, n = 119). K Heatmap of representative significant cis- and trans-event genes associated with 1q gain in SBC. L Scatterplot showing the p-values for PFS (x-axis, n = 106) and the Spearman’s correlation coefficients (two-sided) of the metabolism-related pathways(n = 187). M A model depicting the multi-level regulation of chromosome 1q copy number alteration.
Fig. 4
Fig. 4. RPRD1B expression predicts response to radiotherapy in SBC.
A Heatmap of differentially regulated (FDR < 0.05, log2FC > 0.3) DNA repair-related proteins between radio-resistant (n = 26) and radio-sensitive groups (n = 47). B CIN scores among high-dose resistant (n = 7), low-dose resistant (n = 19), high-dose sensitive (n = 21), and low-dose sensitive (n = 26) groups. C Proteins significantly correlated with both radio-resistance degree and CIN score, n = 96. D Protein expression levels of RPRD1B among high-dose resistant (n = 7), low-dose resistant (n = 19), high-dose sensitive (n = 21), and low-dose sensitive (n = 26) groups. E, F Chordoma cell viability assays with knockdown of RPRD1B or/and exposure to 32 Gy (E) or 64 Gy (F) of irradiation. Scrambled siRNA: treated with 32 Gy or 64 Gy of irradiation. A: treated with 32 Gy or 64 Gy of irradiation and RPRD1B siRNA1-knockdown. B: treated with irradiation and RPRD1B siRNA2-knockdown. C: treated with RPRD1B siRNA1-knockdown. D: treated with RPRD1B siRNA2-knockdown (n = 6 for each group, biological replicates; mean ± SEM; Student’s t-test, two-sided). G HDR and MMR pathways significantly correlated with CIN score and RPRD1B. H Heatmap showing the copy number/mRNA/proteins/phosphoproteins levels of HDR and MMR related genes (top panel), the ssGSEA score of cell cycle pathway, and the radio-resistance degree (bottom panel), n = 96. I ssGSEA scores of HDR, MMR, G1 phase and S phase, n = 96. J Correlations of cell cycle-related proteins with HDR and MMR, n = 96. K Heatmap showing abundance/kinase activities of MCM2 phosphoprotein, MCM2_S27, CSNK2A1, CDK7, CDK2 and CDC7, n = 96. L A brief model depicting the G1 and S phase genes most affected by CIN score, HDR and MMR (n = 96). The p-values in (C) and (GK) were calculated by Spearman’s correlation test (two sided). For boxplots in (B) and (D) the middle bar represents the median, and the box represents the interquartile range; bars extend to 1.5 × the interquartile range. Anova and Kruskal−Wallis test were used for comparisons among four groups, Wilcoxon rank-sum test were used for comparisons between two groups. n.s., not significant; *p < 0.05; **p < 0.01; ***p < 0.001.
Fig. 5
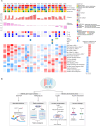
Fig. 5. Immune-cold SBCs associated with 9p and 10q loss.
A Heatmap illustrating cell type compositions and abundance of selected key genes/proteins and pathways across the three immune subtypes. The heatmap in the first section illustrates the immune/stromal signatures from xCell (n = 180). The mRNA and protein abundance of key immune-related markers and ssGSEA scores of common pathways and protein-only pathways upregulated in different immune subtypes are illustrated in the remaining sections. B Contour plot of two-dimensional density based on stromal core (y-axis) and immune scores (x-axis) for different immune subtypes. C Kaplan-Meier curve of PFS for six subgroups based on the CIN status (p-value from log-rank test). Hot CIN- = 32, Hot CIN + = 26, Cold CIN- = 16,Cold CIN + = 45, Mix CIIN- = 28, and Mix CIN + = 14. D The scatter plot illustrating the correlation between arm-level copy number and CIN score (x-axis, n = 163), as well as immune score (y-axis, n = 161). E Chromosome arms significantly correlated with immune scores and CIN scores (n = 161). F GSEA plot showing the chromosome 9p had significant positive correlation with inflammatory response and IL6/JAK/STAT3 signaling based on proteomic data (n = 163). G GSEA plot showing chromosome 10q had significant positive correlation with TNF-α signaling via NF-KB and interferon (IFN) alpha response based on proteomic data (n = 163). H Heatmap of copy number loss of chromosomes 9p and the copy number(CN)/mRNA/protein abundance of key interferon receptors genes, IL6/JAK/STAT signaling pathway genes and key immune checkpoints (n = 163). I Heatmap of copy number loss of chromosomes 10q and the copy number(CN)/mRNA/protein abundance of NF-KB related genes and key cytokines (n = 163). J A brief model depicting that combined effect of 9p loss and 10q loss enabled CIN + tumors to escape the immune surveillance. The p-values in (DF) and (I) were calculated using Spearman’s correlation (two-sided).
Fig. 6
Fig. 6. Consensus clustering analysis of the SBC cohort identified four proteomic subtypes.
A Heatmap illustrating the characterizations of four proteomic subtypes (Kruskal–Wallis test), annotated with clinical features (Fisher’s exact test), n = 187. Fisher’s exact test was used for categorical variables. B Pathways significantly enriched in the proteomic subtypes (FDR < 0.05). C, D Boxplots illustrating CIN score (C) and immune score (D) across proteomic subtypes (Wilcoxon rank-sum test used for comparisons between two subtypes, Anova test and Kruskal–Wallis test used for comparisons among four subtypes; P-I: n = 54; P-II: n = 38; P-III: n = 50; P-IV: n = 45). E Heatmap illustrating the overlap of immune clusters with proteomic subtypes. F, G Survival Kaplan–Meier curves showing (F) OS and (G) PFS of primary tumors within the four proteomic subtypes (log-rank test). P-I = 40, P-II = 19, P-III = 31, and P-IV = 31. H Heatmap of PROGENy pathway scores between P-II and P-III subtypes (Wilcoxon rank-sum test). The p-value is displayed in asterisks. I Boxplot showing lower TRAIL pathway score in P-II subtype compared with P-III subtype (Wilcoxon rank-sum test; P-II: n = 38, P-III: n = 50). J Boxplot showing lower IRF1 TF activity score in P-II subtype compared with P-III subtype (Wilcoxon rank-sum test; P-II: n = 38; P-III: n = 50). K Scatterplot showing the Spearman’s correlation (two-sided) of the IRF1 TF activity score versus TRAIL pathway score, n = 180. L Heatmap showing representative TRAIL pathway related genes significantly downregulated in P-II subtype compared with P-III subtype. M Plot showing qPCR result of IRF1 gene between the IRF1 KD cells and the control cells (n = 2 for each group, biological replicates). N Boxplot showing apoptosis pathway score between the IRF1 KD cells and the control cells (Paired t-test, two-sided; n = 3 for each group, biological replicates). For boxplot in (C, D, I, J, and N) the middle bar represents the median, and the box represents the interquartile range; bars extend to 1.5 × the interquartile range.
Fig. 7
Fig. 7. Pairwise comparison of pre- and post-recurrent SBC tumors.
A Clinical sample types and genomic characterization of 17 pairs of pre- and post-recurrent tumors (top panel). Differences in ssGSEA scores between pre- and post-recurrent tumors (i.e., ssGSEA score of post-recurrent tumor subtracted from ssGSEA score of pre-recurrent tumor) of key molecular pathways at mRNA and protein levels associated with difference of CIN score (i.e., CIN score of post-recurrent subtracted from CIN score of pre-recurrent) (bottom panel). The coefficients and p-values were calculated by Spearman’s correlation test (two-sided). B A brief model showing that hyperactivation of E2F target genes promoted DNA RS. DNA RS tolerance resulted in CIN+, which in turn elevated DNA RS (top panel). The four dashed boxes showing the four major effects of CIN+ (bottom panel), namely, affecting mitochondrial protein homeostasis, making SBC resistant to radiotherapy, causing immune escape, and could be further subdivided into two proteomic subtypes, P-II had worse prognosis due to downregulation of TRAIL pathways.

References

    1. Walcott, B. P. et al. Chordoma: current concepts, management, and future directions. Lancet Oncol.13, e69–e76 (2012). - PubMed
    1. Crockard, H. A. et al. A multidisciplinary team approach to skull base chordomas. J. Neurosurg.95, 175–183 (2001). - PubMed
    1. Santegoeds, R. G. C. et al. Ectopic recurrence of skull base chordoma after proton therapy. Curr. Oncol.29, 2364–2375 (2022). - PMC - PubMed
    1. Stacchiotti, S. & Sommer, J. Building a global consensus approach to chordoma: a position paper from the medical and patient community. Lancet Oncol.16, e71–e83 (2015). - PubMed
    1. Groschel, S. et al. Defective homologous recombination DNA repair as therapeutic target in advanced chordoma. Nat. Commun.10, 1635 (2019). - PMC - PubMed

Publication types

LinkOut - more resources