. 2024 Sep 27;15(1):8268.
doi: 10.1038/s41467-024-52463-7.

A cell type-aware framework for nominating non-coding variants in Mendelian regulatory disorders

Affiliations

A cell type-aware framework for nominating non-coding variants in Mendelian regulatory disorders

Arthur S Lee et al. Nat Commun. .

Abstract

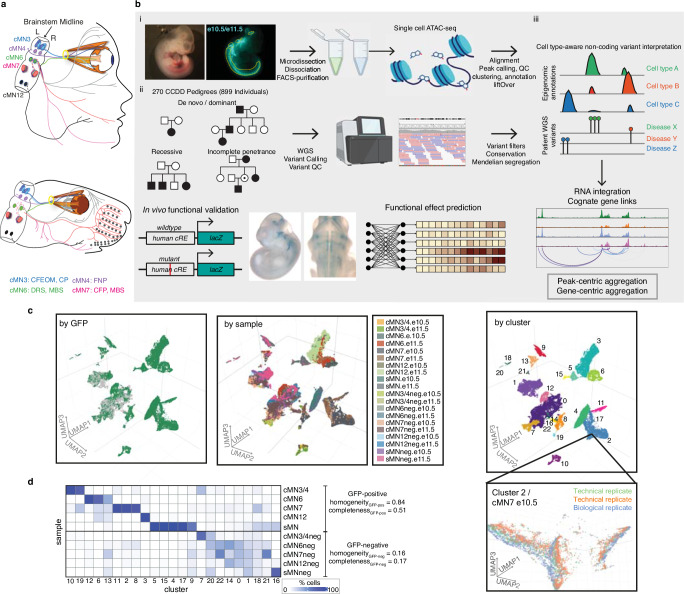
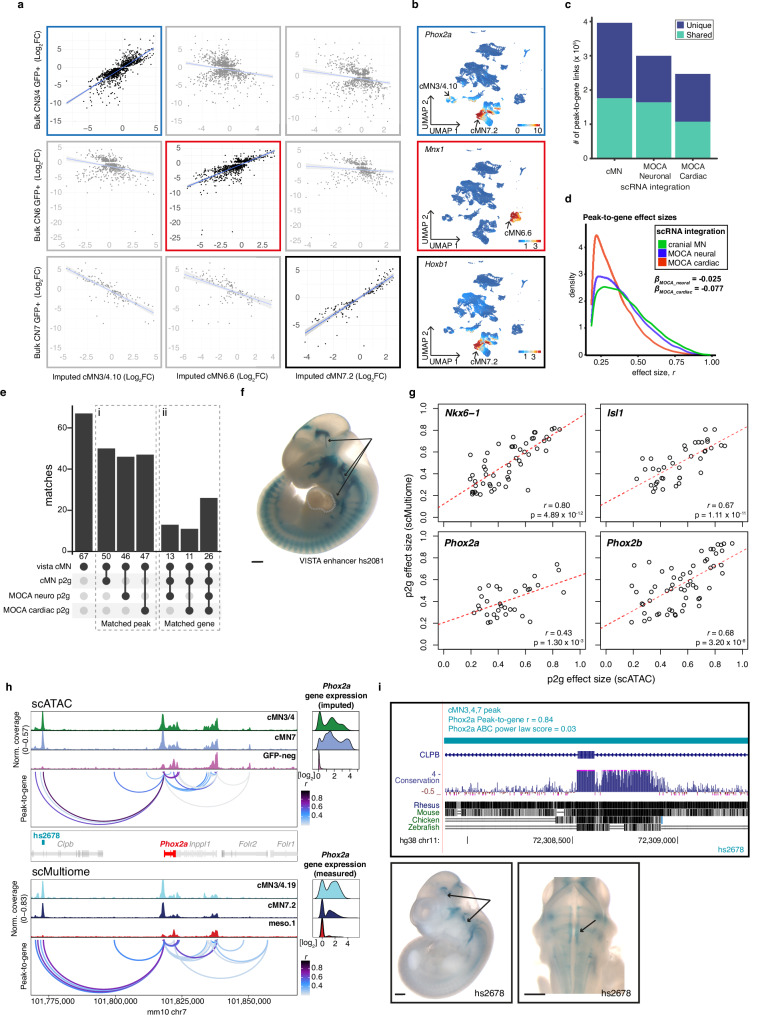
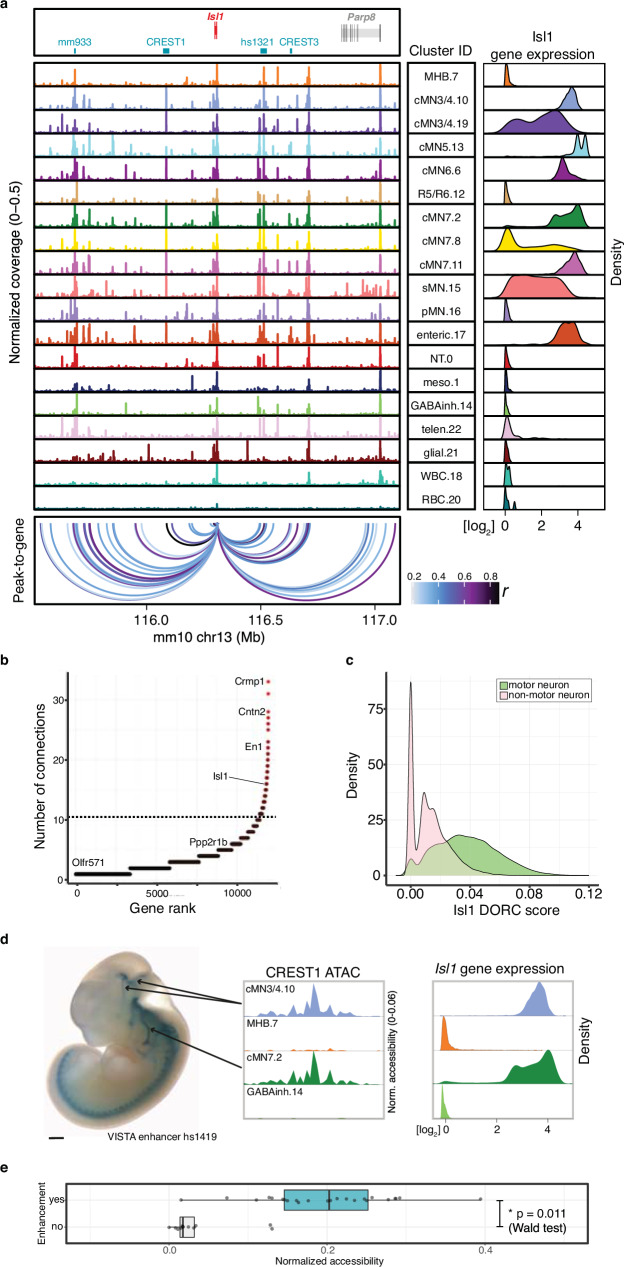
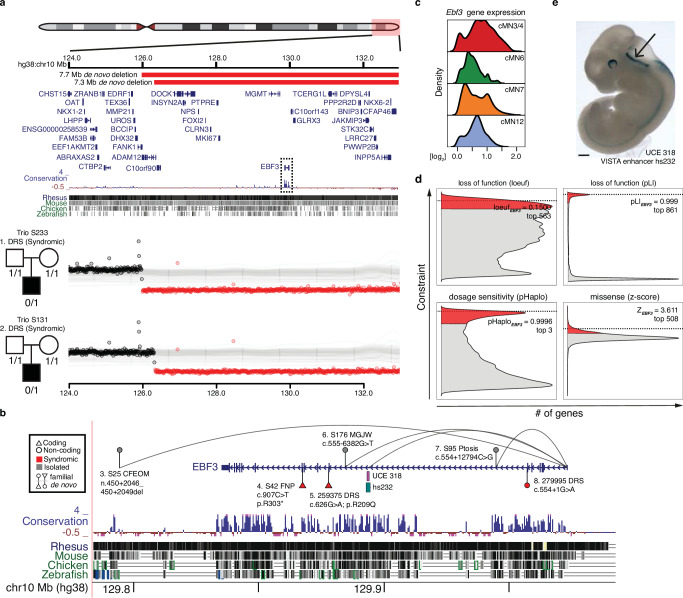
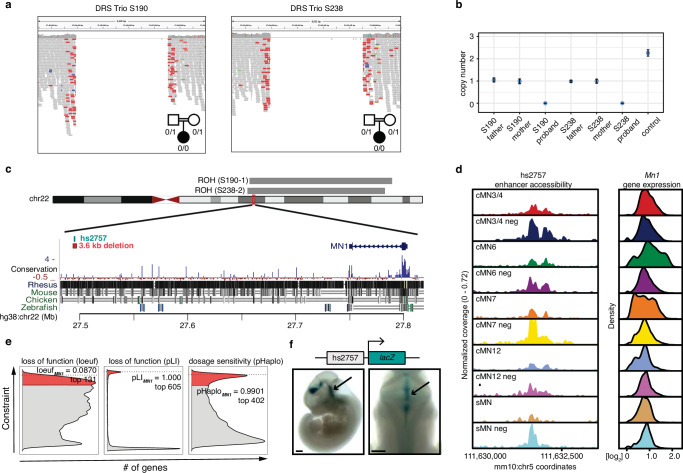
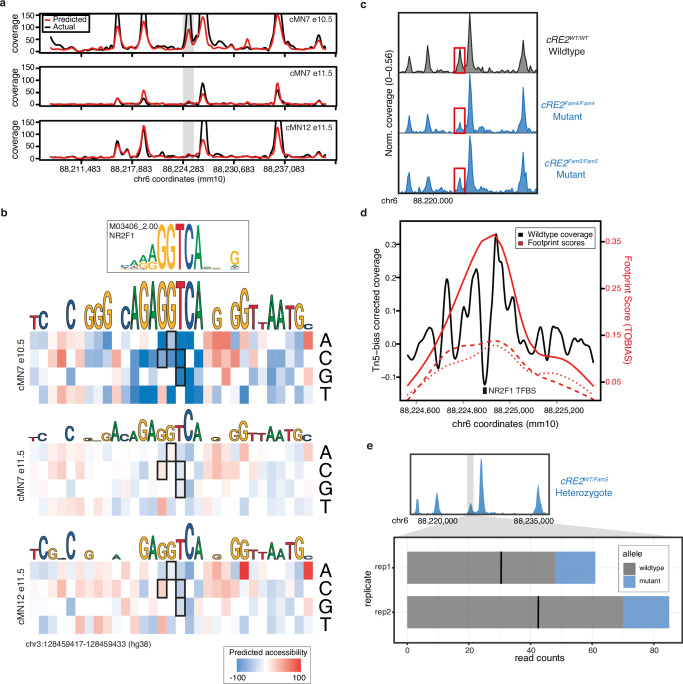
Unsolved Mendelian cases often lack obvious pathogenic coding variants, suggesting potential non-coding etiologies. Here, we present a single cell multi-omic framework integrating embryonic mouse chromatin accessibility, histone modification, and gene expression assays to discover cranial motor neuron (cMN) cis-regulatory elements and subsequently nominate candidate non-coding variants in the congenital cranial dysinnervation disorders (CCDDs), a set of Mendelian disorders altering cMN development. We generate single cell epigenomic profiles for ~86,000 cMNs and related cell types, identifying ~250,000 accessible regulatory elements with cognate gene predictions for ~145,000 putative enhancers. We evaluate enhancer activity for 59 elements using an in vivo transgenic assay and validate 44 (75%), demonstrating that single cell accessibility can be a strong predictor of enhancer activity. Applying our cMN atlas to 899 whole genome sequences from 270 genetically unsolved CCDD pedigrees, we achieve significant reduction in our variant search space and nominate candidate variants predicted to regulate known CCDD disease genes MAFB, PHOX2A, CHN1, and EBF3 - as well as candidates in recurrently mutated enhancers through peak- and gene-centric allelic aggregation. This work delivers non-coding variant discoveries of relevance to CCDDs and a generalizable framework for nominating non-coding variants of potentially high functional impact in other Mendelian disorders.


Conflict of interest statement

D.G.M. is a paid advisor to GlaxoSmithKline, Insitro, and Overtone Therapeutics, and has received research support from AbbVie, Astellas, Biogen, BioMarin, Eisai, Google, Merck, Microsoft, Pfizer, and Sanofi-Genzyme. M.E.T. has received research support and/or reagents from Microsoft, Illumina Inc., Pacific Biosciences, and Ionis Pharmaceuticals. Otherwise, the authors declare that they have no competing interests as defined by Nature Research, or other interests that might be perceived to influence the interpretation of this article.

Figures

Fig. 1
Fig. 1. Integrating Mendelian pedigrees with single-cell epigenomic data.
a Schematic depicting a subset of human (top) and mouse (bottom) cMNs and their targeted muscles. cMN3 (blue) = oculomotor nucleus which innervates the inferior rectus, medial rectus, superior rectus, inferior oblique, and levator palpebrae superior muscles; cMN4 (purple) = trochlear nucleus which innervates the superior oblique muscle; cMN6 (green) = abducens nucleus which innervates the lateral rectus muscle (bisected); cMN7 (pink) = facial nucleus which innervates muscles of facial expression; cMN12 (black) = hypoglossal nucleus which innervates tongue muscles. Corresponding CCDDs for each cMN are listed under the diagram and color coded. CFEOM congenital fibrosis of the extraocular muscles, CP congenital ptosis, FNP fourth nerve palsy. b Overview of the experimental and computational approach. (i) Generating cell type-specific chromatin accessibility profiles. Brightfield and fluorescent images of e10.5 Isl1MN:GFP embryo (left) from which cMNs are microdissected (yellow dotted lines, dissociated, FACS-purified (middle), followed by scATAC and data processing. (ii) WGS of 270 CCDD pedigrees (left; 899 individuals; sporadic and inherited cases) followed by joint variant calling, QC, and Mendelian variant filtering (right). (iii) Integrating genome-wide non-coding variant calls with epigenomic annotations for variant nomination (top). To inform variant interpretation, we identify cognate genes (second row), aggregate candidate variants, generate functional variant effect predictions (third row), and validate top predictions in vivo (bottom). c UMAP embedding of single-cell chromatin accessibility profiles from 86,089 GFP-positive cMNs, sMNs, and their surrounding GFP-negative neuronal tissue colored by GFP reporter status (left, GFP-positive green, GFP-negative gray), sample (middle) and cluster (right). Gridlines in middle UMAP apply to left and right UMAPs as well. The inset shows the relative proximity of Cluster 2 cells dissected from the same cell type (cMN7 e10.5) from different technical and biological replicates. d Heatmap depicting proportions of dissected cells within each of the 23 major clusters. Homogeneity/completeness metrics are shown for GFP-positive versus -negative clusters. Figure 1b was created with BioRender.com and released under a Creative Commons Attribution-NonCommercial-NoDerivs 4.0 International license.
Fig. 2
Fig. 2. Motif enrichment and aggregate footprint analyses distinguish cell type-specific TF binding motifs.
a Heatmap depicting enriched transcription factor binding motifs within differentially accessible peaks by cluster. Each entry is defined by its cluster identity (clusterID.clusterNumber). Corresponding cluster IDs and annotations are depicted. Color scale represents one-sided hypergeometric-enrichment p values adjusted for multiple testing for each cluster and motif. Specific motifs and motif families vary significantly amongst clusters. Cluster annotations are defined in Supplementary Data 2. b Aggregated subtraction-normalized footprinting profiles for a subset of cluster-enriched transcription factors (OTX1, ONECUT2, JunD, and GATA1) from (a), centered on their respective binding motifs. Specific clusters display positive evidence for TF motif binding for each motif. Corresponding motif position weight matrices from the CIS-BP database are depicted above each profile. Cluster IDs with corresponding colors are below. c Motif enrichment comparing broad classes of neuronal subtypes. P values are from one-sided hypergeometric-enrichment testing adjusted for multiple testing. Midbrain subtype contains motifs from cMN3/4neg cells; hindbrain from cMN6neg, cMN7neg, and cMN12neg cells; somatic MN from cMN3/4, cMN6, and cMN12 GFP-positive cells; branchial MN are from cMN7 GFP-positive cells; midbrain MN are cMN3/4 GFP-positive cells; hindbrain MN are cMN6, cMN7, and cMN12 GFP-positive cells; ocular MN are cMN3/4 and cMN6 GFP-positive cells; lower MN are cMN7, cMN12, and sMN GFP-positive cells. For each graph, the first listed subtype is enriched relative to the second listed subtype.
Fig. 3
Fig. 3. Effects of RNA input data on peak-to-gene accuracy.
a Imputed gene expression values projected onto scATAC clusters cMN3/4.10, cMN6.6, and cMN7.2 versus measured gene expression values from bulk RNA-seq samples. Error bands represent 95% confidence intervals for each fitted model. b Feature plots depicting imputed gene expression for cMN marker genes Phox2a, Mnx1, and Hoxb1. c Total number of unique and shared peak-to-gene links using different scRNA integration datasets (cMN, MOCA Neuronal, MOCA Cardiac) against the common scATAC cMN peakset. d Distribution of peak-to-gene effect sizes using different scRNA integration datasets. Estimated effect sizes are significantly stronger for cMN scRNA integration relative to MOCA neuro (βMOCA_neuro = −0.077, p < 2 × 10−16, linear regression) and cardiac (βMOCA_cardiac = −0.025, p < 2 × 10−16, linear regression) integrations. e Barplot depicting peak-to-gene elements from different scRNA integrations overlapping experimentally validated cMN enhancers (vista cMN). (i) Matched peak indicates intersect overlapping peaks irrespective of predicted cognate gene. (ii) The matched gene indicates distinct overlapping peaks and identical cognate genes. f In vivo enhancer assay for VISTA enhancer hs2081 (n = 4 embryos) overlapping a predicted peak-to-gene link using cMN versus MOCA cardiac scRNA input. Enhancer activity is positive in cranial nerves 3, 7, and 12 (arrows); negative in heart (dotted lines). g Comparing scATAC versus scMultiome peak-to-gene effect sizes for marker genes Nkx6-1, Isl1, Phox2a, and Phox2b. Linear regression coefficients and nominal p values are shown. h scATAC and scMultiome accessibility profiles with peak-to-gene connections for a 100 kb window centered around Phox2a. hs2678 (n = 5 embryos) is accessible in cMN3/4 and cMN7 and is predicted to enhance Phox2a by scATAC (r = 0.84) and scMultiome (r = 0.69). i (Top) hs2678 is 70.3 kb distal to human PHOX2A and is embedded in the coding and intronic sequence of CLPB. (Bottom) In vivo enhancer assay using human hs2678 (n = 5 embryos) sequence is positive in cMN3 and cMN7 (arrows). Reporter expression views are shown as lateral (left) and dorsal through the fourth ventricle (right). Scale bars in f and i = 500 μm and are approximate measurements based on E11.5 embryo average crown-rump length of 6 mm. Source data are provided as a Source Data file.
Fig. 4
Fig. 4. Exceptional gene regulation of cranial motor neuron master regulator Isl1.
a Pseudobulked chromatin accessibility profiles for all annotated clusters over a 1.5 Mb window centered about Isl1. Imputed gene expression profiles for each cluster are shown to the right. Isl1 is located within a gene desert with the nearest up- and downstream flanking genes 1.2 and 0.7 Mb away, respectively. Peak-to-gene predictions match known Isl1 enhancers CREST1 and CREST3 (10.1016/j.ydbio.2004.11.031); mm933 in multiple cranial motor nerves, dorsal root ganglion, and nose; hs1321 in multiple cranial motor nerves and forebrain) and identify additional putative enhancers surrounding Isl1. b The number of normalized regulatory connections for each rank-ordered gene. Isl1 ranks in the top 1% of all genes with at least one regulatory connection. The inflection point of the plotted function is demarcated with a dotted line. c Per-cell domain of regulatory chromatin (DORC) scores for Isl1 gene. DORC scores are significantly higher for cells from motor neuron clusters relative to non-motor neuron clusters (p value <1 × 10−15, ANOVA). d (Left) Lateral whole mount In vivo reporter assay testing CREST1 (VISTA enhancer hs1419; n = 7 embryos) enhancer activity. CREST1 drives expression in cranial nerves 3, 4, and 7 (black lines). (Right) Single-cell ATAC profiles and imputed gene expression for a subset of corresponding clusters. CREST1 accessibility and Isl1 gene expression are positively correlated with in vivo expression patterns. e Boxplot depicting normalized accessibility levels for enhancers CREST1, CREST3, mm933, and hs1321 within nine scATAC clusters corresponding to distinct anatomic regions. Manually scored enhancer activity is significantly correlated with normalized accessibility (p value = 0.011, Wald test, two-sided). Center line: median; box limits: upper and lower quartiles; whiskers – 1.5 × interquartile range. Scale bar in d = 500 μm and are approximate measurements based on E11.5 embryo average crown-rump length of 6 mm. Source data are provided as a Source Data file.
Fig. 5
Fig. 5. An integrated coding/non-coding candidate allelic series for EBF3.
a Window depicting the terminal arm of chr10q (top). Large de novo deletions in two trios (middle, bottom) with simplex syndromic DRS (S233 and S131) overlap multiple coding genes including EBF3 (boxed), an exceptionally conserved gene at the coding and non-coding level. b Nominated coding and non-coding SNVs and indels connected to EBF3. For each variant, the subject’s WGS ID code, CCDD phenotype, and the variant coordinate in NG_030038.1 (and if coding or noncoding and if familial or de novo) is indicated. Variants 5 and 8 are reported previously in DECIPHER and elsewhere (10.1016/j.ajhg.2016.11.020). Peak-to-gene links containing variants connected to EBF3 are depicted by curved lines. EBF3 contains highly conserved non-coding intronic elements, including ultraconserved element UCE318 in intron 6, whose sequence drives strong expression in the embryonic hindbrain. c Imputed gene expression profiles for Ebf3. d EBF3 is exceptionally intolerant to loss-of-function, gene dosage, and missense variation. Density plots depict the genome-wide distribution of loss-of-function constraint (loeuf, pLI) (10.1038/s41586-020-2308-7; 10.1038/nature19057), probability of haploinsufficiency (pHaplo) (10.1016/j.cell.2022.06.036), and missense constraint (z-score) (10.1038/ng.3050). Respective scores exceeding thresholds of 0.35, 0.9, 0.84, and 2.0 are colored red. EBF3 (dotted lines) ranks as the 563rd, 861st, 3rd, and 508th most constrained gene in the genome, respectively. Distributions are rescaled for consistent signs and ease of visualization. e Lateral view of in vivo reporter assay testing UCE318 (VISTA enhancer hs232; n = 7 embryos), a putative EBF3 enhancer (peak-to-gene r = 0.42, FDR = 6.72 × 10−22). Strong reporter expression is observed in the embryonic hindbrain (arrow). Scale bar in e = 500 μm and is approximate based on E11.5 embryo average crown-rump length of 6 mm.
Fig. 6
Fig. 6. MN1 enhancer deletions across multiple CCDD pedigrees.
a IGV screenshot depicting 3.6 kb non-coding deletions in two probands with DRS from separate consanguineous pedigrees (S190, S238). b ddPCR copy number estimates of deletions. For each pedigree, the affected proband is homozygous recessive for the deletion with one heterozygous allele inherited from each parent. Error bars denote 95% confidence intervals about the mean value estimated from two technical replicates per data point. c Genomic context of the non-coding deletions. The deletions (red bar below chr22 ideogram) fall within extended runs of homozygosity (gray bars above ideogram, 19.5 Mb, 18.8 Mb, respectively, of which 16 kb surrounding the deletion is shared between the probands) and eliminate putative enhancer hs2757 (green bar below ideogram) located 307 kb from nearest gene MN1. d hs2757 chromatin accessibility (left) and Mn1 imputed gene expression (right) profiles in the cMNs and surrounding cell types. Mn1 is widely expressed across multiple midbrain/hindbrain cell types, and hs2757 is accessible across multiple cell types, including cMN6. e Density plots depicting genome-wide distribution of loss-of-function constraint (loeuf, pLI) (10.1038/s41586-020-2308-7; 10.1038/nature19057), and probability of haploinsufficiency (pHaplo) (10.1016/j.cell.2022.06.036) metrics. Respective scores exceeding thresholds of 0.35, 0.9, 0.84, and 2.0 are colored red. MN1 (dotted lines) ranks as the 131st, 605th, and 402nd most constrained gene in the genome, respectively. Distributions are rescaled for consistent signs and ease of visualization. f In vivo reporter assay testing hs2757 enhancer activity (humanized sequence, n = 6 embryos). Lateral (left) and dorsal (right) whole mount lacZ staining reveals that hs2757 consistently drives expression in midbrain and hindbrain tissue, including the anatomic territory of cMN6. Scale bar = 500 μm and are approximate measurements based on E11.5 embryo average crown-rump length of 6 mm. Scale bars in f = 500 μm and are approximate measurements based on E11.5 embryo average crown-rump length of 6 mm. Source data are provided as a Source Data file.
Fig. 7
Fig. 7. scATAC-trained convolutional neural network accurately predicts cell type-specific accessibility status and human mutation effects in a transiently developing cell type.
a Neural net predicted chromatin accessibility profiles (red) compared to actual scATAC sequencing coverage (black) for a region of mouse chromosome 6 in three cell types (cMN7 e10.5, cMN7 e11.5, and cMN12 e11.5). The gray box highlights a transient 678 bp peak (cRE2) that is accessible in cMN7 e10.5, but not cMN7 e11.5 or cMN12 e11.5. SNVs within the human orthologous peak cRE2 cause congenital facial weakness, a disorder of cMN7. b Neural net-trained in silico saturation mutagenesis predictions for specific nucleotide changes in human cRE2 for cMN7 e10.5, cMN7 e11.5, and cMN12 e11.5. Predicted loss-of-function nucleotide changes are colored in blue and gain-of-function in red. Predictions for four known loss-of-function pathogenic variants (chr3:128178260 G > C, chr3:128178261 G > A, chr3:128178262 T > C, chr3:128178262 T > G) are boxed. All four pathogenic variants are predicted loss-of-function for cMN7 e10.5, but not cMN7 e11.5 or cMN12 e11.5. c Pseudobulk accessibility profiles of cRE2 (red box) CN7 e10.5 for wildtype and two CRISPR-mutagenized mouse lines (cRE2Fam4/Fam4 and cRE2Fam5/Fam5) show a qualitative reduction in cRE2 scATAC sequencing coverage, consistent with in silico saturation mutagenesis predictions. Each pseudobulk profile represents normalized sequencing coverage across two biological replicates. d Locus-specific footprinting evidence overlapping cRE2. A 792 bp window showing sequencing coverage for cMN7 e10.5 after correcting for Tn5 insertion bias. The NR2F1 transcription factor binding site is mutated in individuals with HCFP1-CFP and overlaps a local minimum in scATAC coverage. TOBIAS footprinting scores for cRE2 wildtype, cRE2Fam4/Fam4, and cRE2 Fam5/Fam5 are depicted in solid, dashed, and dotted lines, respectively. e. Stacked barplot depicting wildtype (gray) versus mutant (blue) scATAC read counts over a 7.7 kb window for cMN7 e10.5 in cRE2WT/Fam5 heterozygote embryos. cRE2 mutant alleles are consistently depleted across two biological replicates (countsWT / countsMUTANT = 4.21; p value = 2.4 × 10−14, binomial test). The mean expected value under the null is depicted by a solid black line for each experiment. Scale bars in f and i = 500 μm and are approximate measurements based on E11.5 embryo average crown-rump length of 6 mm. Source data are provided as a Source Data file.

Update of

References

    1. Smedley, D. et al. A whole-genome analysis framework for effective identification of pathogenic regulatory variants in Mendelian disease. Am. J. Hum. Genet.99, 595–606 (2016). - PMC - PubMed
    1. Amberger, J. S. & Hamosh, A. Searching online Mendelian inheritance in man (OMIM): a knowledgebase of human genes and genetic phenotypes. Curr. Protoc. Bioinformatics58, 1.2.1–1.2.12 (2017). - PMC - PubMed
    1. Visscher, P. M. et al. 10 years of GWAS discovery: biology, function, and translation. Am. J. Hum. Genet.101, 5–22 (2017). - PMC - PubMed
    1. Hekselman, I. & Yeger-Lotem, E. Mechanisms of tissue and cell-type specificity in heritable traits and diseases. Nat. Rev. Genet.21, 137–150 (2020). - PubMed
    1. Short, P. J. et al. De novo mutations in regulatory elements in neurodevelopmental disorders. Nature555, 611–616 (2018). - PMC - PubMed

Publication types