. 2024 Sep 27;15(1):8376.
doi: 10.1038/s41467-024-52371-w.

A hierarchical atlas of the human cerebellum for functional precision mapping

Affiliations

A hierarchical atlas of the human cerebellum for functional precision mapping

Caroline Nettekoven et al. Nat Commun. .

Abstract

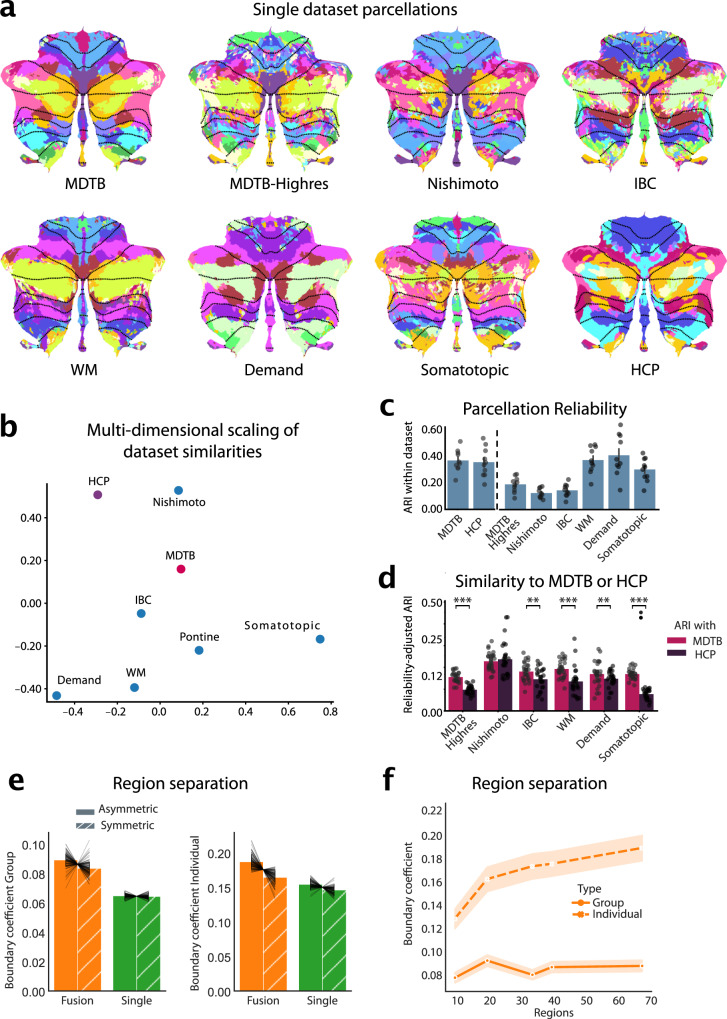
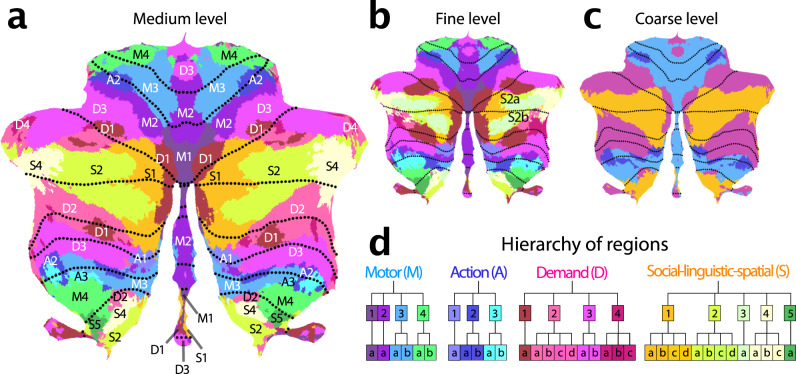
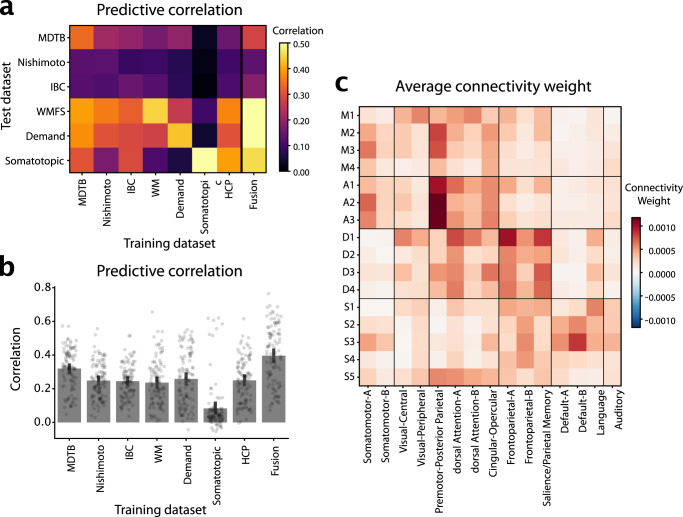
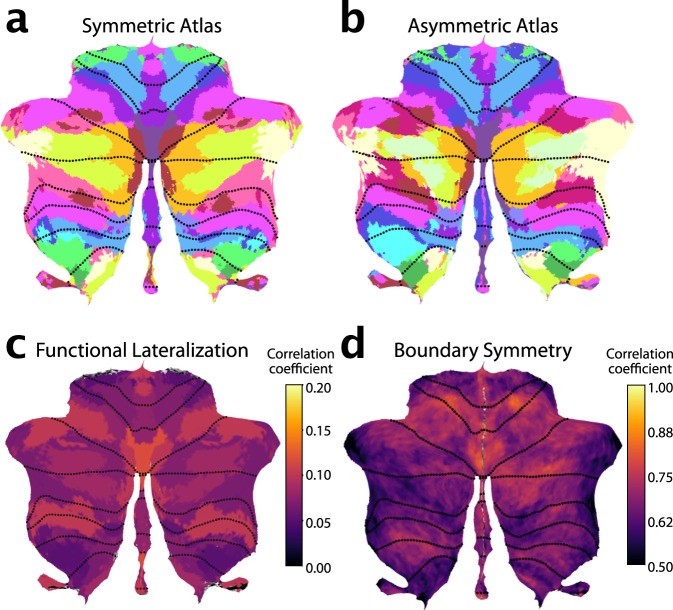
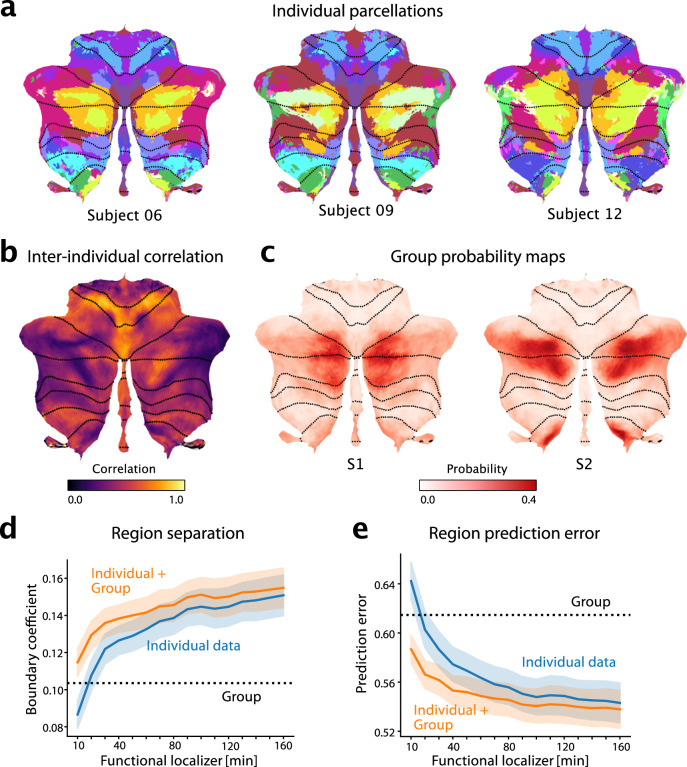
The human cerebellum is activated by a wide variety of cognitive and motor tasks. Previous functional atlases have relied on single task-based or resting-state fMRI datasets. Here, we present a functional atlas that integrates information from seven large-scale datasets, outperforming existing group atlases. The atlas has three further advantages. First, the atlas allows for precision mapping in individuals: the integration of the probabilistic group atlas with an individual localizer scan results in a marked improvement in prediction of individual boundaries. Second, we provide both asymmetric and symmetric versions of the atlas. The symmetric version, which is obtained by constraining the boundaries to be the same across hemispheres, is especially useful in studying functional lateralization. Finally, the regions are hierarchically organized across three levels, allowing analyses at the appropriate level of granularity. Overall, the present atlas is an important resource for the study of the interdigitated functional organization of the human cerebellum in health and disease.


Conflict of interest statement

The authors declare no competing interests.

Figures

Fig. 1
Fig. 1. Building a functional atlas of the cerebellum across datasets.
a, Parcellations (K = 68) derived from each single dataset (multi-domain task battery dataset, MDTB; high-resolution multi-domain task battery dataset, Highres-MDTB; Nishimoto dataset, individual brain charting dataset, IBC; working memory dataset, WM; demand dataset, Demand; somatotopic dataset, Somatotopic; Human Connectome Project dataset, HCP). The probabilistic parcellation is shown as a winner-take-all projection onto a flattened representation of the cerebellum. Functionally similar regions are colored similarly within a parcellation (see methods: parcel similarity) and spatially similar parcels are assigned similar colors across parcellations. Dotted lines indicate lobular boundaries. b, Projection of the between-dataset adjusted Rand Index (ARI) of single-dataset parcellations into a 2d-space through multi-dimensional scaling (see methods: Single-dataset parcellations and similarity analysis of parcellations). c, Within-dataset reliability of parcellation, calculated as the mean ARI across the 5 levels of granularity (10, 20, 34, 40 and 68 regions). Errorbars indicate SE of the mean across the five granularity pairs. Dots show individual reliability values (n = 10). d, Reliability-adjusted ARI between each single-dataset parcellations and the multi-domain task battery (MDTB; task-based) and Human Connectome Project (HCP; resting parcellation) parcellation. Errorbars indicate standard error of the mean across the five levels of granularity. Dots show individual similarity values (n = 25). Paired two-tailed t-tests were calculated between the ARI of each single-dataset to the MDTB parcellation and to the HCP parcellation at each granularity: MDTB-Highres: t24=16.404,p=1.523×10¹⁴; IBC: t24=3.513,p=.0017; WM: t24=4.727,p=8.318×10⁵; Demand: t24=3.262,p=.0033; Somatotopic: t24=12.538,p=5.015×10¹². ** p<0.01, *** p<0.0001. e, Distance-Controlled Boundary Coefficient (DCBC) evaluation of the symmetric and asymmetric atlas averaged across granularities evaluated on the group map (left) or on individual maps derived with that atlas (right). Errorbars indicate SE of the mean across subjects. Gray connecting lines show individual subjects (n = 111). For visualization purposes of the subject data, the subject mean was subtracted and the group mean added. f, DCBC evaluation of the symmetric group map and of individual maps derived from the model with 10, 20, 34, 40, and 68 regions. Shaded area indicates SE of the mean across subjects. Source data are provided as a Source Data file.
Fig. 2
Fig. 2. Cerebellar functional atlas at three levels of granularity.
a Medium granularity with 32 regions; 16 per hemisphere. The colormap represents the functional similarity of different regions (see methods: parcel similarity and clustering). b Fine granularity with 68 regions; 34 per hemisphere. c Coarse granularity with four functional domains. The symmetric version of the atlas is shown, for the asymmetric version, see Fig. 4. d Hierarchical organization based on the functional similarity of regions, depicted as a dendrogram. The label of each region indicates the functional domain (M,A,D,S), followed by a region number (1-4), and a lower-case letter for the subregion (ad).
Fig. 3
Fig. 3. Cerebro-cerebellar connectivity models.
a Matrix shows the correlation between observed and predicted cerebellar activity patterns for each test dataset (rows). Connectivity models were trained on each training datasets (columns) separately. Evaluation was cross-validated across subjects when training- and test-dataset were identical. b Correlation between observed and predicted activity patterns, averaged across test-datasets. The Fusion model used the average connectivity weights across all task-based datasets (excluding the HCP resting-state data). c Average connectivity weights between each cerebellar region (row), and each of the 15 resting-state networks as described indu2023?. Source data are provided as a Source Data file.
Fig. 4
Fig. 4. Functional lateralization and Boundary asymmetry in the cerebellum.
a Symmetric atlas winner-take-all map. b Asymmetric atlas winner-take-all map. c Functional lateralization quantified as the correlations of the functional responses of anatomically corresponding voxel of the left and right hemisphere, averaged across subjects and within each functional region. d Boundary symmetry calculated as the correlations of the probabilistic voxel assignments between the symmetric and asymmetric version of the atlas.
Fig. 5
Fig. 5. The functional atlas improves individual precision mapping.
a Individual parcellations from three participants, using 320min of individual data. The region colors correspond to the atlas at medium granularity (32 regions). b Map of the average inter-subject correlations of functional profiles. Correlations are calculated between any pair of subjects in the MDTB dataset, corrected for the reliability of the data (see methods: Inter-individual variability). c Group probability map for regions S1 and S2 (left and right combined) show the overlap of regions. d DCBC evaluation (higher values indicate better performance) on individual parcellations (blue line) derived on 10–160min of individual functional localizing data, compared to group parcellation (dashed line) or the combination of group map and individual data (orange line). Shaded area indicates SE of the mean across subjects. e Equivalent analysis using prediction error (see methods, lower is better). Shaded area indicates SE of the mean across subjects for all datasets apart from MDTB-Highres (n = 103 for each bar). Source data are provided as a Source Data file.

Update of

Similar articles

Cited by

References

    1. Strick, P. L., Dum, R. P. & Fiez, J. A. Cerebellum and nonmotor function. Annu. Rev. Neurosci.32, 413–434 (2009). - PubMed
    1. Schmahmann, J. D. Disorders of the cerebellum: Ataxia, dysmetria of thought, and the cerebellar cognitive affective syndrome. J. Nurse Pract.16, 367–378 (2004). - PubMed
    1. King, M., Hernandez-Castillo, C. R., Poldrack, R. A., Ivry, R. B. & Diedrichsen, J. Functional boundaries in the human cerebellum revealed by a multi-domain task battery. Nat. Neurosci.22, 1371–1378 (2019). - PMC - PubMed
    1. Schmahmann, J. D. et al. Three-dimensional MRI atlas of the human cerebellum in proportional stereotaxic space. Neuroimage10, 233–260 (1999). - PubMed
    1. Diedrichsen, J., Balsters, J. H. H., Flavell, J., Cussans, E. & Ramnani, N. A probabilistic MR atlas of the human cerebellum. Neuroimage46, 39–46 (2009). - PubMed

Publication types

LinkOut - more resources