. 2024 Sep 27;15(1):8320.
doi: 10.1038/s41467-024-52474-4.

ParSE-seq: a calibrated multiplexed assay to facilitate the clinical classification of putative splice-altering variants

Affiliations

ParSE-seq: a calibrated multiplexed assay to facilitate the clinical classification of putative splice-altering variants

Matthew J O'Neill et al. Nat Commun. .

Abstract

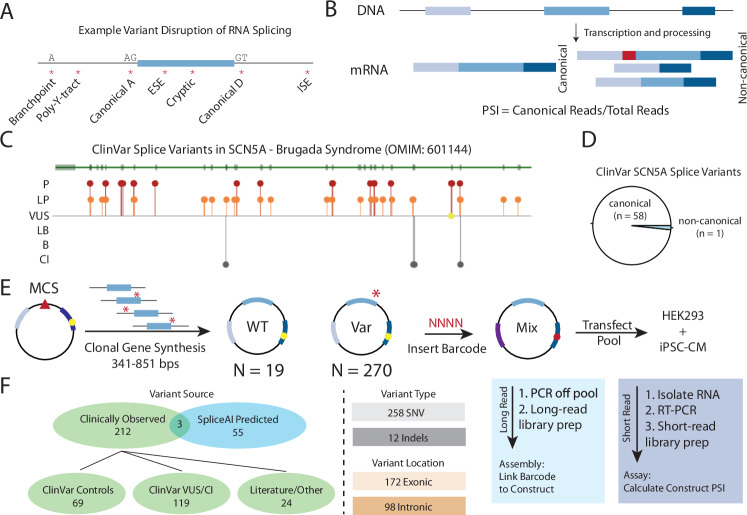
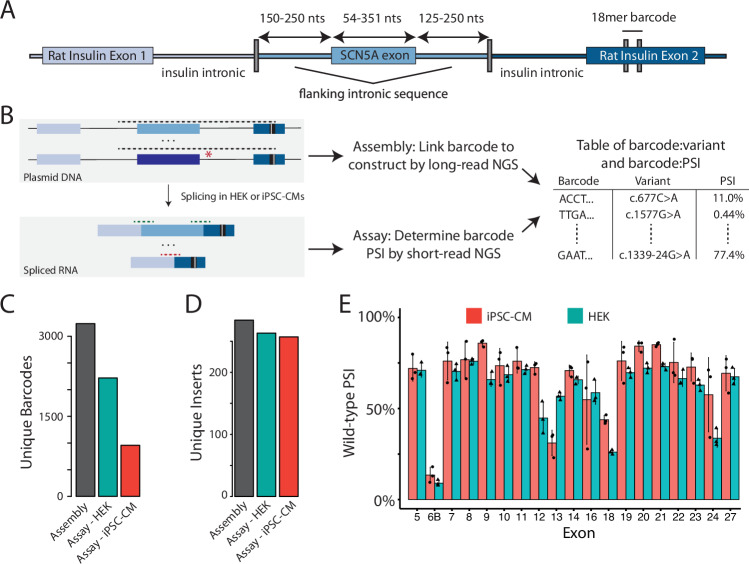
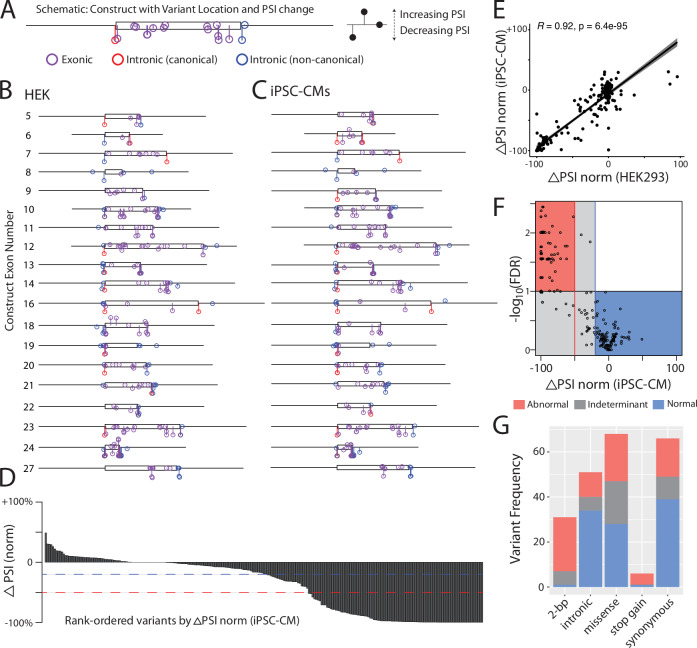
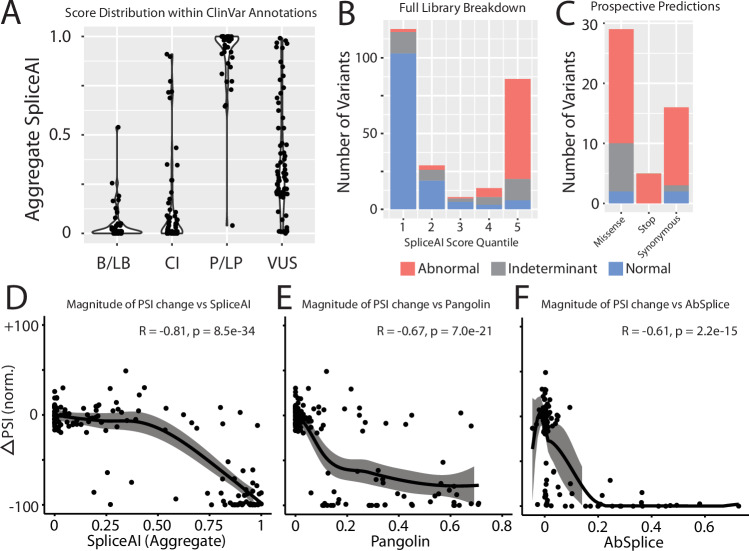
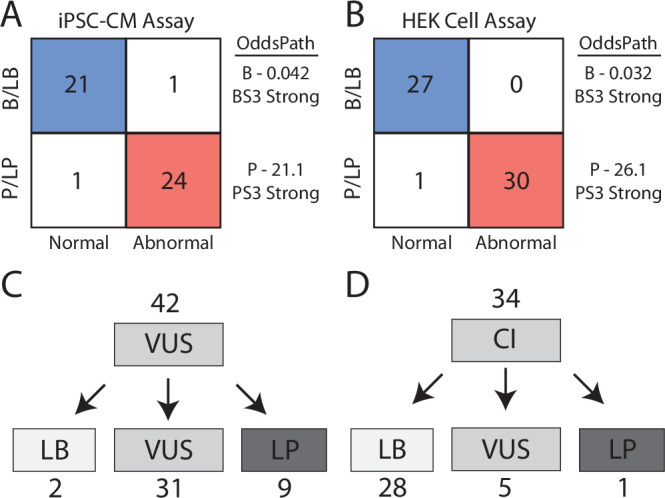
Interpreting the clinical significance of putative splice-altering variants outside canonical splice sites remains difficult without time-intensive experimental studies. To address this, we introduce Parallel Splice Effect Sequencing (ParSE-seq), a multiplexed assay to quantify variant effects on RNA splicing. We first apply this technique to study hundreds of variants in the arrhythmia-associated gene SCN5A. Variants are studied in 'minigene' plasmids with molecular barcodes to allow pooled variant effect quantification. We perform experiments in two cell types, including disease-relevant induced pluripotent stem cell-derived cardiomyocytes (iPSC-CMs). The assay strongly separates known control variants from ClinVar, enabling quantitative calibration of the ParSE-seq assay. Using these evidence strengths and experimental data, we reclassify 29 of 34 variants with conflicting interpretations and 11 of 42 variants of uncertain significance. In addition to intronic variants, we show that many synonymous and missense variants disrupted RNA splicing. Two splice-altering variants in the assay also disrupt splicing and sodium current when introduced into iPSC-CMs by CRISPR-Cas9 editing. ParSE-seq provides high-throughput experimental data for RNA-splicing to support precision medicine efforts and can be readily adopted to study other loss-of-function genotype-phenotype relationships.


Conflict of interest statement

A.M.G. is a consultant for BioMarin, Inc. All remaining authors declare no competing interests.

Figures

Fig. 1
Fig. 1. Splice-altering variants and ParSE-seq assay schematic.
A Splicing regulatory sequences disrupted or introduced by cis-genetic variants. A acceptor site. D donor site. ESE exonic splicing enhancer. ISE intronic splicing enhancer. Y pyrimidine. B Quantification of percent spliced in (PSI) from transcripts associated with WT- or variant-containing transcripts. Canonical reads are divided by the total amount of reads for a given exon triplet cassette. C Lollipop diagram of ClinVar reported SCN5A splice-altering variant locations. Green track shows SCN5A exons (rectangles) and introns (narrow line). Most pathogenic (red) and likely pathogenic (orange) variants are located near the canonical splice sites, and are distributed throughout the gene product. There is only one variant of uncertain significance (yellow) and four conflicting interpretation variants (CI; gray) that are annotated as “splice-altering”. OMIM indicates Online Mendelian Inheritance of Man. Annotated genetrack obtained from https://www.ncbi.nlm.nih.gov/clinvar/. D Most SCN5A splice variants in ClinVar are associated with canonical splice sites, with only one ClinVar example of a non-canonical splice variant. Data in Source Data. E Schematic of ParSE-seq assay. A clonal gene library is cloned into a minigene vector (modified pET01), pooled, and barcoded. MCS indicates “multiple cloning site” for construct insertion (red triangle). Barcode are inserted into the downstream exon (purple); yellow circle represents restriction site for barcode in downstream exon. Barcodes (NNNN) are then assigned to the WT or variant (Var; red asterisk) inserts by long-read sequencing through assembly, and the splicing outcomes are determined with short-read sequencing after transfection into two cell types—human embryonic kidney cells (HEK) and induced pluripotent stem cell-cardiomyocytes (iPSC-CM). F The ParSE-seq SCN5A variant library was designed to evaluate three categories of variants: assay calibration, classification of clinically relevant variants, and testing of exonic variants with high SpliceAI scores. VUS variant of uncertain significance. CI conflicting interpretation. SNV single nucleotide variants. Complete descriptions of all variants studied are available in Supplementary Data 2.
Fig. 2
Fig. 2. ParSE-seq assay in HEK cells and iPSC-CMs.
A Detailed schematic of the ParSE-seq barcodable minigene plasmid. A previously used minigene vector was mutagenized to introduce a restriction site into the 3′ rat insulin exon 2. After digestion of a pool of minigene plasmids with SCN5A WT and variant inserts (middle), an 18-mer barcode was subcloned into the downstream exon (see Supplementary Fig. 2 for complete barcoding steps). Nts nucleotides. B Overview schematic of assembly and assay steps, and subsequent integration. Dashed lines represent amplicons for long- and short-read next generation sequencing (NGS). Following barcode insertion into the digested plasmid pool, a long-read PCR amplicon was used to link the barcode to the SCN5A insert (assembly). The pool was transfected into HEK cells and iPSC-CMs, after which short-read RNA-seq was used to link the barcode to splicing outcomes (assay; PSI percent spliced in). Assembly and assay data were merged by barcode for subsequent analysis steps (Supplementary Fig. 3). C Barcode counts for the assembly, and recovered barcodes present across three replicates in HEK and iPSC-CM assays. More barcodes were detected from the more easily transfected HEK cells than iPSC-CMs. Raw data available in Source Data and Supplementary Data 3. Black (library, pretransfection), red (iPSC-CMs), green (HEK). D Unique WT or variant inserts covered by barcodes in (C). Despite lower total barcode recovery in (C), most inserts are still recovered with the high stoichiometry of barcodes: inserts. Raw data available in Source Data and Supplementary Data 3. E PSI for all WT exons in iPSC-CMs and HEK cells. Data are averaged across three replicates and error bars represent the standard error of the mean. Red indicates iPSC-CMs, green indicates HEK cells. Raw data available in Source Data.
Fig. 3
Fig. 3. ParSE-seq results for a library of SCN5A variants.
A Example lollipop diagram showing variants superimposed along construct. iPSC-CM results for Exon 23 are shown. The y-axis represents mean ΔPSI_norm across three biological replicates, and the x-axis represents genomic position along the exonic (box) and intronic (line) segments of the synthetic insert. Purple indicates exonic variants, blue intronic variants outside the 2-bp canonical splice sites, and red canonical splice site variants. PSI percent spliced in. B Lollipop diagram showing distribution of ParSE-seq investigated variants in HEK cells. Axes are defined as in (A). An average of three experimental replicates is shown. C Lollipop diagram showing distribution of ParSE-seq investigated variants in iPSC-CMs. Axes are defined as in (A). An average of three experimental replicates is shown. D Waterfall plot of mean ΔPSI_norm by variant (N = 243). Red dashed line corresponds to −50% normalized ΔPSI, and blue to −20% normalized ΔPSI. E Spearman correlation (two-sided test) of mean ΔPSI_norm between HEK and iPSC-CMs (N = 207). Error bars refer to 95% confidence interval. F Volcano plot of normalized ΔPSI and −log10(FDR). Each dot represents a variant studied in iPSC-CMs (N = 243). Most variants fall within normal (blue) or abnormal (red) quadrants, but some remain indeterminant due to statistical or biological ambiguity (gray). FDR indicates false discovery rate. G Barplot of ParSE-seq variant outcomes by variant mutation type in iPSC-CMs, 2-bp indicates the conserved 2-base pair canonical splice sites AG-GT. Raw data for plots available in Source Data.
Fig. 4
Fig. 4. Comparison of experimental data and in silico splicing predictors.
A Aggregate SpliceAI scores for each ClinVar variant class (N = 269). Raw scores available in Supplementary Data 2. B/LB benign and likely benign, CI conflicting interpretation, P/LP pathogenic likely pathogenic, VUS variant of uncertain significance. B Categorical distribution of variant effect in ParSE-seq stratified by SpliceAI score quintiles. Raw scores available in Supplementary Data 3. Red indicates abnormal assay result, gray indeterminate result, and blue normal result (for B and C). C Results of prospectively identified exonic variants by SpliceAI score >0.8 stratified by mutation type and ParSE-seq outcome. Raw data available in Supplementary Data 3. Correlation of normalized ΔPSI for non-canonical splice site variants against aggregate SpliceAI scores (N = 140; D), Pangolin scores (N = 141; E), and ABSplice scores (N = 137; F). Confidence interval fit using LOESS (see “Methods” section). P values were determined using a Pearson correlation. Raw data available in Source Data.
Fig. 5
Fig. 5. Assay calibration and evidence-based variant classification.
ParSE-seq results for B/LB and P/LP controls in iPSC-CMs (A) and HEK cells (B). We calculated two OddsPath values (B benign, P pathogenic) to implement BS3 and PS3 (ACMG benign and pathogenic functional evidence codes), both at a strong level of evidence. More barcodes were recovered for HEK cells, enabling additional control sample size (N = 47) vs (N = 58). Blue indicates concordant benign annotation and assay result, and red concordant pathogenic annotation and assay result. C Variants of uncertain significance (VUS) were reclassified using functional data from ParSE-seq at the strong level of evidence. BS3 evidence was applied exclusively to synonymous and intronic VUS. PS3 evidence is applied to all VUS. Evidence weights for classification provided in Supplementary Table 5. LB likely benign and LP likely pathogenic. D Classifications of conflicting interpretation (CI) variants using functional evidence. BS3/PS3 applied as for VUS in (C). Calibration control outcomes and ClinVar classifications in Source Data.
Fig. 6
Fig. 6. A missense variant disrupts NaV1.5 function through a splice-altering mechanism.
A Schematic showing that assays using complementary DNA (cDNA) do not account for splice-altering variant effects. Left: Schematic of genomic locus with large intronic sequences; right: cDNA-based sequence without introns used in many SCN5A functional assays. Adjacent exons are annotated in green and blue in an alternating pattern for clarity. B Molecular analysis of the ParSE-seq assay showed activation of an upstream cryptic splice donor site, resulting in a 31-bp exon truncation. Raw data in Supplementary Data 3. Red portion of exon indicates truncated exon section. C Quantification of mean canonical PSI among reads for the WT exon construct and variant construct. Error bar corresponds to standard error of the mean across three biological replicates. P values were calculated from a two-tailed t-test. Raw data in Supplementary Data 3. D Quantification of mean sodium channel current densities for WT NaV1.5 and variant NaV1.5 using the SyncroPatch automated patch clamping system (cDNA assay), in stably expressing HEK293 cells. Error bar corresponds to standard error of the mean across biological replicate cells. N = 90 cells (WT) and N = 46 cells (c.4220C > G/p.Ala1407Gly). P values were calculated from a two-tailed t-test. Data are available in Source Data and Supplementary Table 6. E Representative single-cell sodium current traces for a WT and variant HEK cell. cDNA assessment of this missense variant did not show an effect on protein function when assessed by automated patch clamping, a system that cannot assess splicing impact. Currents are measured in nano amperes (nA). Raw data are available in Source Data. F CRISPR editing of a population control induced pluripotent stem cell (iPSC) line was performed to make a heterozygous edit of the line. G The WT and heterozygote variant iPSCs were chemically differentiated into cardiomyocytes (iPSC-CMs). H Differentiated iPSC-CMs were treated with dimethylsulfoxide (DMSO) or the nonsense-mediated decay (NMD) inhibitor cycloheximide (CHX), followed by RNA-isolation and RNA-seq (N = 3 for each condition). We observed aberrant splicing consistent with the ParSE-seq molecular event (exon truncation) in the variant, but not WT lines. Notably, treatment with cycloheximide increases the ratio of WT splicing to exon truncation, consistent with NMD degradation of the aberrant transcript. Raw counts are available from NIH BioProject accession #1106089. I Manual patch clamp of the WT and variant iPSC-CMs was performed to test the effect of aberrant splicing on protein function. Sodium currents were abrogated in the presence of the variant compared to WT, consistent with haploinsufficiency from loss-of-splicing in (F). Error bars represent standard error of the mean across biological replicate cells (N = 10, WT and N = 12, variant). Raw data is presented in Supplementary Table 7.

Update of

References

    1. Green, E. D. et al. Strategic vision for improving human health at The Forefront of Genomics. Nature586, 683–692 (2020). - PMC - PubMed
    1. Truty, R. et al. Spectrum of splicing variants in disease genes and the ability of RNA analysis to reduce uncertainty in clinical interpretation. Am. J. Hum. Genet.108, 696–708 (2021). - PMC - PubMed
    1. Sibley, C. R., Blazquez, L. & Ule, J. Lessons from non-canonical splicing. Nat. Rev. Genet.17, 407–421 (2016). - PMC - PubMed
    1. Vaz-Drago, R., Custódio, N. & Carmo-Fonseca, M. Deep intronic mutations and human disease. Hum. Genet.136, 1093–1111 (2017). - PubMed
    1. Jaganathan, K. et al. Predicting splicing from primary sequence with deep learning. Cell176, 535–548.e524 (2019). - PubMed

Publication types

MeSH terms

Substances

LinkOut - more resources