. 2024 Sep 27;15(1):8349.
doi: 10.1038/s41467-024-52609-7.

Selective regulation of macrophage lipid metabolism via nanomaterials' surface chemistry

Affiliations

Selective regulation of macrophage lipid metabolism via nanomaterials' surface chemistry

Junguang Wu et al. Nat Commun. .

Abstract

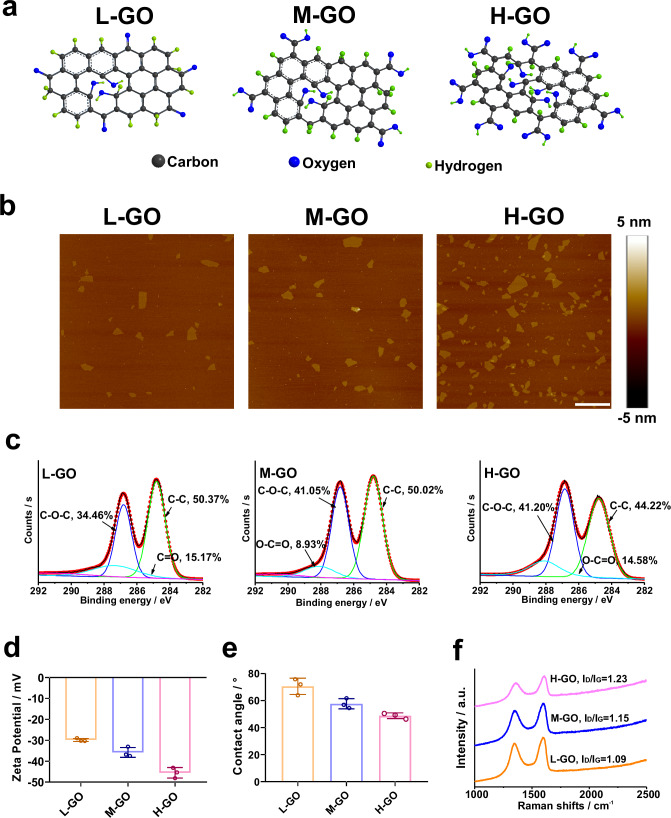
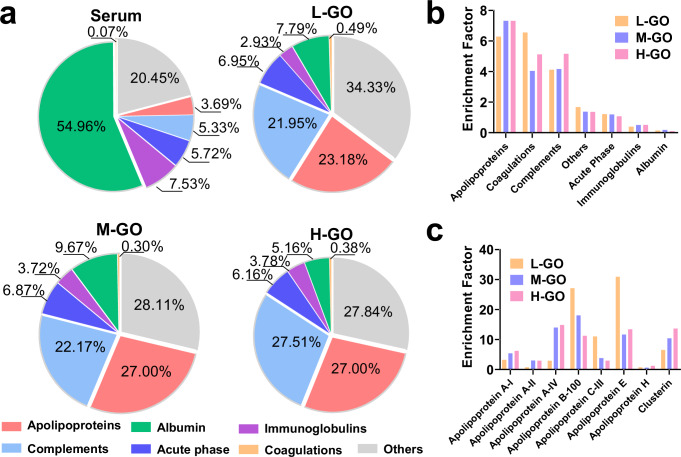
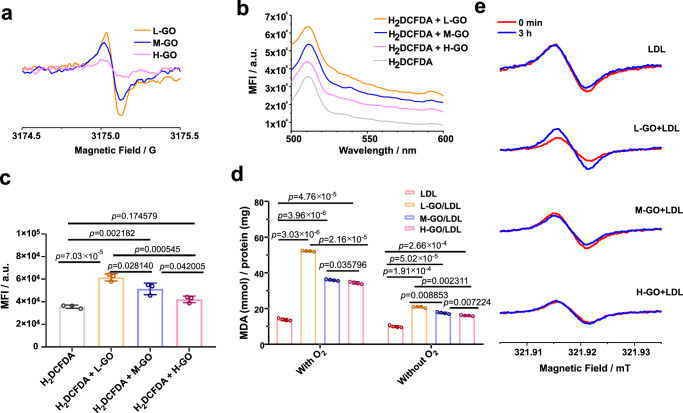
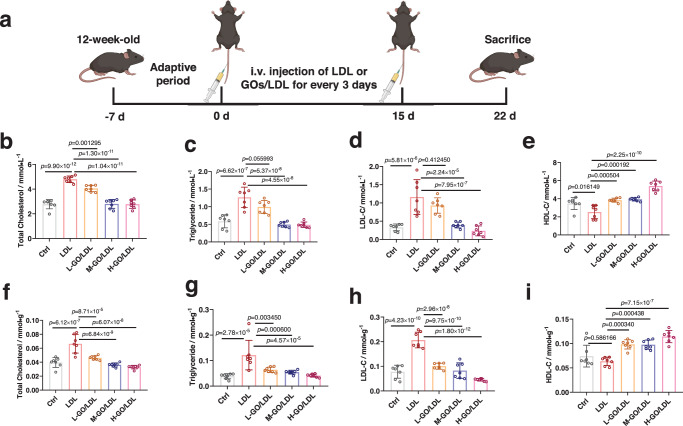
Understanding the interface between nanomaterials and lipoproteins is crucial for gaining insights into their impact on lipoprotein structure and lipid metabolism. Here, we use graphene oxide (GOs) nanosheets as a controlled carbon nanomaterial model to study how surface properties influence lipoprotein corona formation and show that GOs have strong binding affinity with low-density lipoprotein (LDL). We use advanced techniques including X-ray reflectivity, circular dichroism, and molecular simulations to explore the interfacial interactions between GOs and LDL. Specifically, hydrophobic GOs preferentially associate with LDL's lipid components, whereas hydrophilic GOs tend to bind with apolipoproteins. Furthermore, these GOs distinctly modulate a variety of lipid metabolism pathways, including LDL recognition, uptake, hydrolysis, efflux, and lipid droplet formation. This study underscores the importance of structure analysis at the nano-biomolecule interface, emphasizing how nanomaterials' surface properties critically influence cellular lipid metabolism. These insights will inspire the design and application of future biocompatible nanomaterials and nanomedicines.


Conflict of interest statement

The authors declare no competing interests.

Figures

Fig. 1
Fig. 1. Physicochemical properties of graphene oxide nanosheets (GOs).
a Schematic illustrating the ball-and-stick model of three types of GOs with varying degrees of oxidation: low (L-GO), medium (M-GO), and high (H-GO). Carbon, oxygen and hydrogen are presented in black, blue and green, respectively. b AFM images showing GOs with different oxidation degrees. Scale bar represents 1 μm. c Quantitative analysis of oxidation levels and functional groups (C-O-C, C = O, O-C = O, and C-C) determined by XPS. d Surface charges of GOs evaluated by zeta potential measurements. e Hydrophilicity of the three types of GOs measured by contact angle analysis. Data are presented as mean ± standard deviation for three replicates (n = 3). f Raman spectra for the three types of GOs. Source data are provided as a Source Data file.
Fig. 2
Fig. 2. Protein composition of the serum protein corona adsorbed on GOs.
a Classification of components on three types of GOs (L-GO, M-GO and H-GO) by biological function. The pie chart indicates the relative abundance of coronal proteins in six categories: apolipoproteins, complements, acute phase, immunoglobulins, coagulation factors, and others. Albumin, due to its highest abundance in serum, is classified as an individual category. b Comparison of functional protein groups on the surface of graphene oxides. c Enrichment factor of apolipoproteins on different graphene oxide nanosheets. The enrichment factors (b, c) represent the comparison of protein or protein group abundance on GOs to that in the serum (coronal complex of GOs/serum). Protein compositions are identified through manual search using the Human Database via the UniProt website. Data are presented as mean ± standard deviation of triplicate biological samples (n = 3). Proteomics data are presented in Supplementary Data 1. Source data are provided as a Source Data file.
Fig. 3
Fig. 3. Cellular uptake of GO/LDL complexes, intracellular localization, and influence on macrophage lipid droplet formation.
a Cellular uptake of GO/LDL complexes assessed by Raman mapping of GOs, showing D-band (red color) and G-band (green color) signal intensity. Scale bar represents 10 μm. b Confocal images depicting the uptake of GO/LDL complexes using laser reflectivity microscopy. Fluorescent signals in red, green, and blue correspond to cytoplasmic membrane, GOs, and the nucleus, respectively. Scale bars represent 7.5 μm. c Subcellular localization of GOs and lipid droplets observed through TEM images. Red arrows indicate lipid droplets, while blue arrows indicate GOs. Scale bar represents 1 μm. Cells are treated with 50 μg/mL LDL and a mixture of 50 μg/mL LDL with 20 μg/mL GOs for 24 h. d Accumulation of lipid droplets in macrophages when treated with LDL and GO/LDL complexes, visualized by confocal imaging. Red color indicates lipid droplets, while blue indicates nucleus. Scale bar represents 10 μm. e Quantitative analysis of total lipid droplet mean fluorescent intensity (MFI) per cell using high-content analysis. Data are presented as mean ± standard deviation of n = 3 biological replicates. Statistical significance is calculated by one-way ANOVA with Tukey’s multiple comparisons test. *p < 0.05; **p < 0.01; ***p < 0.001; ****p < 0.0001; n.s., not significant (p > 0.05). f, g Soft X-ray cryo-tomographic images of lipid droplets in macrophages before and after exposure to LDL and GO/LDL, obtained through soft X-ray transmission microscopic imaging and 3D reconstruction (nano-CT). Cells are treated with 50 μg/mL LDL or a mixture of 50 μg/mL LDL with 20 μg/mL GOs for 24 h, and wet samples are frozen in liquid nitrogen for nano-CT imaging. f Soft X-ray transmission cryo-microscopic and 3D tomographic imaging of frozen cells and lipid droplets at 520 eV and −80 °C. Red stars indicate lipid droplets, while purple stars represent organelles. g Spatial distribution of lipid droplets (in yellow) and organelles (in red) based on 3D reconstruction of the macrophages. Scale bar represents 5 μm. Source data are provided as a Source Data file.
Fig. 4
Fig. 4. Interfacial interaction between GOs and Apolipoprotein B-100 on the outer layer of LDL.
ac Changes in the secondary structure of apolipoprotein, ApoB-100, after incubating LDL with three types of GOs, as determined by SR-CD. Time-dependent studies are conducted in a mixture of 20 μg/mL GOs with 50 μg/mL LDL, dispersed in phosphate buffer at pH 7.4. d Alterations in the relative content of LDL protein secondary structure treated with GOs at different time points. e Schematic diagram of the LDL receptor binding domain stained by RED-NHS protein labeling kit. Figure 4e Created in BioRender. Wu, J. (2024) BioRender.com/w06z982 released under a CC-BY-4.0 license. f Quantitative analysis of MFI of LDL labeling in the supernatant after incubation with 20 μg/mL GOs for 1 h. Data are presented as mean ± standard deviation of n = 3 biological replicates. Statistical significance is calculated by one-way ANOVA with Tukey’s multiple comparisons test. *p < 0.05; **p < 0.01; ***p < 0.001; ****p < 0.0001; n.s., not significant (p > 0.05). Source data are provided as a Source Data file.
Fig. 5
Fig. 5. Interfacial interaction between GOs and the phospholipids on the outer layer of LDL.
a Morphological images of LDL and GO/LDL complexes observed by AFM. Scale bar represents 500 nm. b, c X-ray liquid interface scattering results of structures between phospholipid (SOPC) and GOs. b XRR data of GOs adsorption and the SOPC thickness. c Electron density profiles derived from the XRR data in b. POPC self-assembles to form a monolayer on the air-water surface and GOs at 20 μg/mL are incubated with SOPC monolayer under a surface pressure of 20 mN/m for XRR characterization. df Molecular interaction between graphene or GO nanosheets and a model lipid droplet (representing LDL particles) based on coarse-grained molecular dynamics. d Schematic diagrams showing the structure of a lipid droplet. The outer layer of the lipid droplet includes POPC monolayer (in cyan) and free cholesteryl (in orange). The inner components contain cholesteryl ester (in yellow) and triglyceride (in red). e Snapshots of the lipid droplet structure depositing on graphene and GOs. For the GO models, the hydrophilic carbon is assigned as carbonyl groups, while the hydrophobic carbon is assigned as sp2 and sp3 carbon. For graphene (GRA), GO1, and GO2, the percentage of carbonyl carbon among all carbons is assigned as 0, 30%, and 50% beads, correlating to the hydrophilicity of pristine graphene, L-GO, and H-GO, respectively. f Illustration of POPC lipids at the edge of lipid droplet bound to graphene/GOs. Each panel contains 40 POPC molecules. gj Density profiles of the lipids along the vertical direction to graphene/GOs. kn Interaction energy between the lipid components and the graphene/GOs. Each simulation is performed for at least 2 μs when the interaction energy between POPC and the graphene/GOs increases slowly, indicating that no more POPC molecules spread on the surface. Source data are provided as a Source Data file.
Fig. 6
Fig. 6. Chemical mechanism of LDL oxidation after absorption on the surface of GOs.
a Detection of carbon radicals present in the GOs using Electron Spin Resonance (ESR). b, c Comparison of the pro-oxidant capacity of three GOs in promoting oxidation reactions. b Measurement of the MFI of ROS using DCF fluorescence spectra. c Quantitative analysis of DCF fluorescence intensity to assess ROS generation by three types of GO suspensions. Data are presented as mean ± standard deviation of n = 3 biological replicates. d Impact of three GOs on the lipid peroxidation of LDL under oxygenated or deoxidated conditions. Malondialdehyde (MDA). Data are presented as mean ± standard deviation of n = 4 biological replicates. e Oxygen consumption determined by ESR after incubating GOs and LDL for 0 min and 3 h. Statistical significance was calculated by one-way ANOVA with Tukey’s multiple comparisons test (c) and two-way ANOVA with Tukey’s multiple comparisons test (d). *p < 0.05; **p < 0.01; ***p < 0.001; ****p < 0.0001; n.s., not significant (p > 0.05). Source data are provided as a Source Data file.
Fig. 7
Fig. 7. The change in lipid metabolism pathway of macrophages after treatment with LDL and GOs.
a The change in mRNA level of lipid metabolism when macrophages are treated with LDL, L-GO/LDL, M-GO/LDL, and H-GO/LDL for 6 h according to the fatty acid metabolism PCR Array. b Effects of LDL and the GOs/LDL complexes on protein levels of cholesterol metabolism. All blots are performed with three independent replicates for biological experiments. Original and uncropped blots are shown in Supplementary Fig. 20. Binding affinity of GOs/LDL complexes with CD36 receptors (c) and with LDL receptors (d) in vitro by BLI. e Schematic illustration of the different pathways of cellular uptake and export of cholesterol when macrophages are treated with LDL and hydrophilic GO/LDL complexes. Figure 7e Created in BioRender. Wu, J. (2024) BioRender.com/j78q721 released under a CC-BY-4.0 license. Accumulation of lipid droplets in macrophages after knockdown of the expression of ABC transporter using ABCA1 siRNA (f) and ABCG1 siRNA (g) when treated with LDL and GO/LDL complexes, visualized by confocal imaging. Red color indicates lipid droplets, while blue indicates nucleus. Three biological experiments are repeated independently. The scale bar represents 35 μm. Source data are provided as a Source Data file.
Fig. 8
Fig. 8. Effects of GOs/LDL on lipid metabolism in vivo.
a Overview of timeline for treatment with LDL or GOs/LDL in C57 BL/6 J mice. Figure 8a Created in BioRender. Wu, J. (2021) BioRender.com/n18b700 released under a CC-BY-4.0 license. Effects of LDL or GOs/LDL on serum total cholesterol (TC) levels (b), triglyceride (TG) levels (c), LDL-C levels (d), and HDL-C levels (e). Effects of LDL or GOs/LDL on liver TC levels (f), TG levels (g), LDL-C levels (h), and HDL-C levels (i). Data represent mean ± standard deviation of n = 7 biological replicates. Statistical significance was calculated by one-way ANOVA with Tukey’s multiple comparisons test. *p < 0.05; **p < 0.01; ***p < 0.001; ****p < 0.0001; n.s., not significant (p > 0.05). Source data are provided as a Source Data file.
Fig. 9
Fig. 9. Schematic illustration of how surface hydrophilicity/hydrophobicity of nanomaterials determines lipid metabolism in macrophages.
a Schematic illustration of how graphene oxide nanosheets determine lipid metabolism in macrophages. b Influence of surface properties of GOs on the structure and physiological function of bound LDL. GOs with distinct surface hydrophilicity/hydrophobicity exhibit preferred modes of binding the components of LDL such as lipoprotein ApoB-100 and phospholipids, which ultimately affect lipid metabolism in macrophages. Upon absorption of LDL, hydrophobic GOs preferentially bind lipid components, disrupting the integrity of LDL phospholipid monolayer, accelerating the fusion of LDL and lipid peroxidation, and inducing foam cell formation. In comparison, hydrophilic GOs prefers to bind ApoB-100, altering its secondary structures, which effectively blocks LDL receptor binding and cellular uptake, preventing the abnormal lipid metabolism in macrophages. Figure 9a Created in BioRender. Wu, J. (2024) BioRender.com/r16c552 released under a CC-BY-4.0 license. Figure 9b Created in BioRender. Wu, J. (2024) BioRender.com/o28z461 released under a CC-BY-4.0 license.

References

    1. Cedervall, T. et al. Understanding the nanoparticle-protein corona using methods to quantify exchange rates and affinities of proteins for nanoparticles. Proc. Natl Acad. Sci. USA104, 2050–2055 (2007). - PMC - PubMed
    1. Ke, P. C. et al. A decade of the protein corona. ACS Nano11, 11773–11776 (2017). - PubMed
    1. Walkey, C. D. & Chan, W. C. Understanding and controlling the interaction of nanomaterials with proteins in a physiological environment. Chem. Soc. Rev.41, 2780–2799 (2012). - PubMed
    1. Hadjidemetriou, M. & Kostarelos, K. Nanomedicine: evolution of the nanoparticle corona. Nat. Nanotechnol.12, 288–290 (2017). - PubMed
    1. Ngo, W. et al. Identifying cell receptors for the nanoparticle protein corona using genome screens. Nat. Chem. Biol.18, 1023–1031 (2022). - PubMed

Publication types

LinkOut - more resources