. 2024 Sep 27;15(1):8354.
doi: 10.1038/s41467-024-52079-x.

Crosslinking of Ly6a metabolically reprograms CD8 T cells for cancer immunotherapy

Affiliations

Crosslinking of Ly6a metabolically reprograms CD8 T cells for cancer immunotherapy

Avishai Maliah et al. Nat Commun. .

Abstract

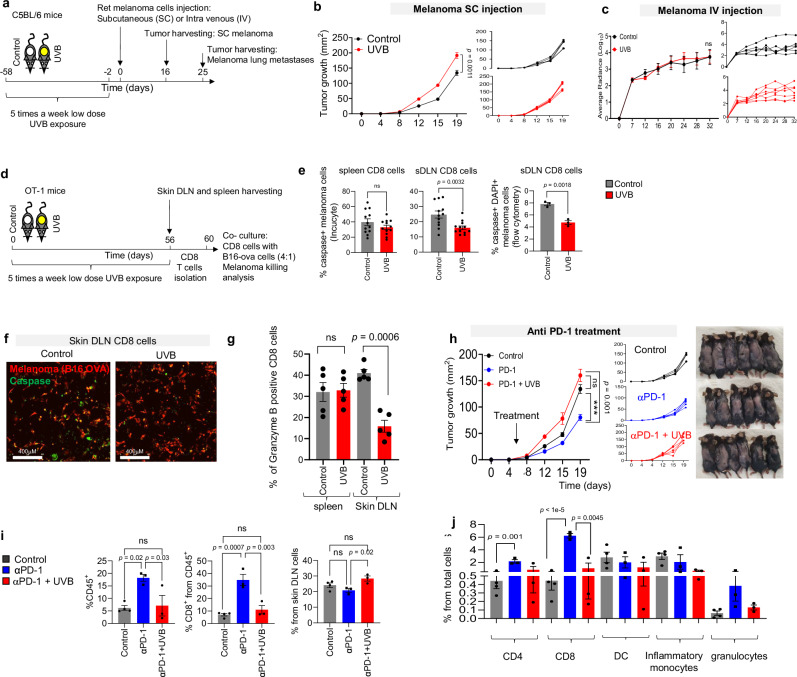
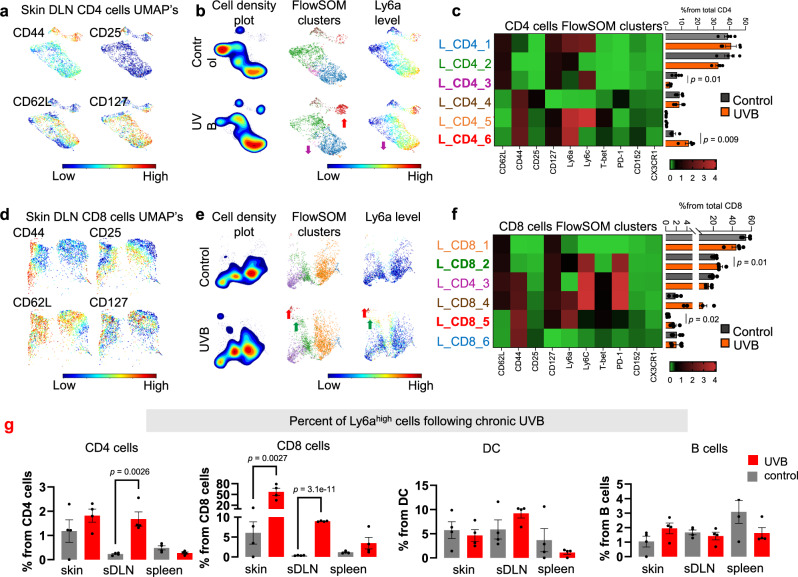
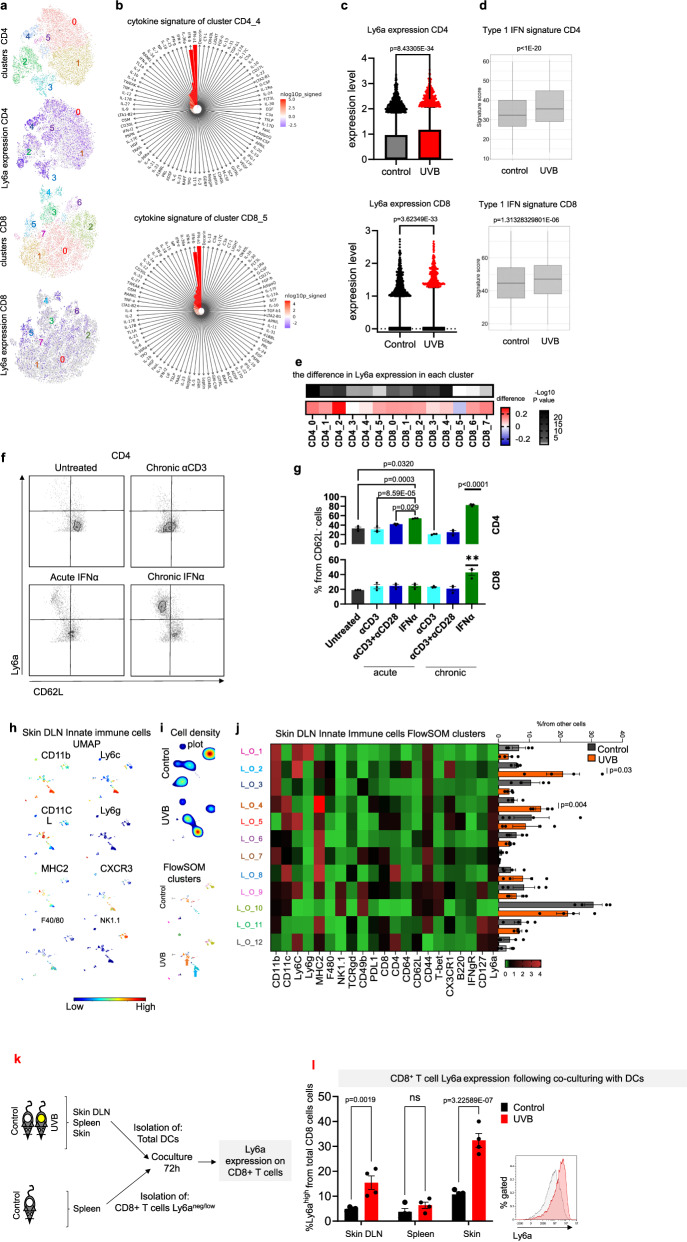
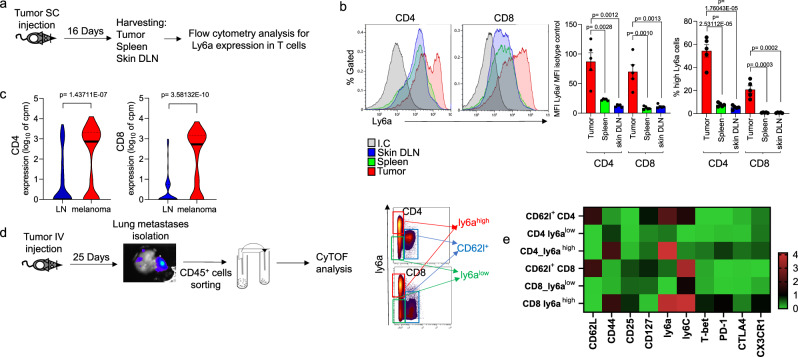
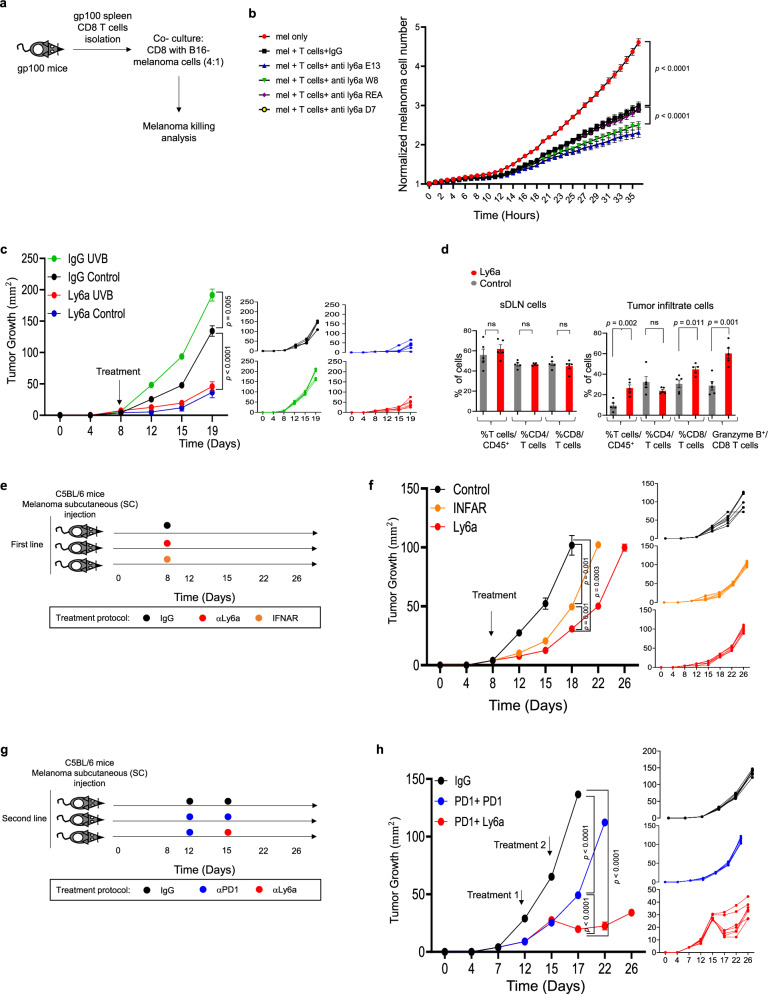
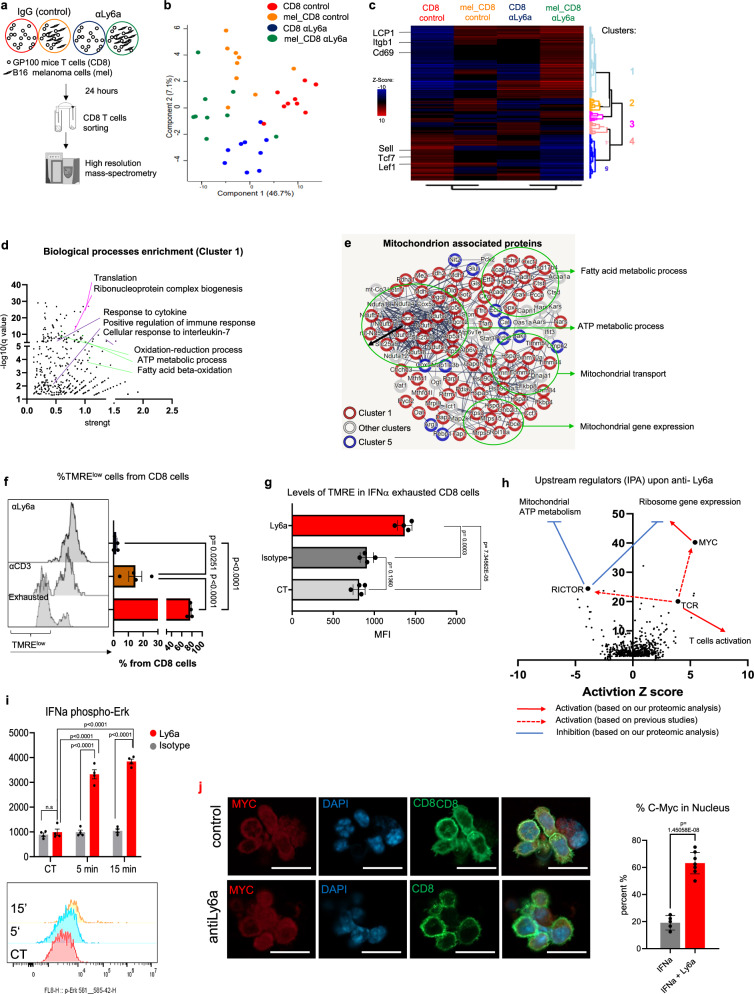
T cell inhibitory mechanisms prevent autoimmune reactions, while cancer immunotherapy aims to remove these inhibitory signals. Chronic ultraviolet (UV) exposure attenuates autoimmunity through promotion of poorly understood immune-suppressive mechanisms. Here we show that mice with subcutaneous melanoma are not responsive to anti-PD1 immunotherapy following chronic UV irradiation, given prior to tumor injection, due to the suppression of T cell killing ability in skin-draining lymph nodes. Using mass cytometry and single-cell RNA-sequencing analyzes, we discover that skin-specific, UV-induced suppression of T-cells killing activity is mediated by upregulation of a Ly6ahigh T-cell subpopulation. Independently of the UV effect, Ly6ahigh T cells are induced by chronic type-1 interferon in the tumor microenvironment. Treatment with an anti-Ly6a antibody enhances the anti-tumoral cytotoxic activity of T cells and reprograms their mitochondrial metabolism via the Erk/cMyc axis. Treatment with an anti-Ly6a antibody inhibits tumor growth in mice resistant to anti-PD1 therapy. Applying our findings in humans could lead to an immunotherapy treatment for patients with resistance to existing treatments.


Conflict of interest statement

The authors declare that they have no competing interests.

Figures

Fig. 1
Fig. 1. Chronic UVB exposure suppresses sDLN CD8+ T cell-mediated killing and induces resistance to melanoma immunotherapy.
a Experimental flowchart. b Mean tumor diameter (left) and individual plots (right) of SC Ret melanoma tumors growth in UVB- and mock-treated mice (n = 4 per group). c Average radiances (left) and data for individual UVB- and mock-treated mice (right) with Ret melanoma lung metastases (n = 7 per group). d Experimental flowchart. e, f B16-OVA melanoma cells were incubated with OT-I CD8+ T cells isolated from UVB- or mock-irradiated mice. e Mean percentages of caspase 3/7+ melanoma cells based on Incucyte data (n = 10 per group) (left) and flow cytometry (n = 3 per group) (right). f Representative images (out of n = 10) of Caspase 3/7 staining. g Mean percentages of Granzyme B expression in T cells isolated from sDLN (Skin Drained Lymph Nodes) of UVB- or mock-irradiated (control) mice (n = 6 per group). hj Mice treated with UVB or mock-irradiated were injected subcutaneously with Ret melanoma cells and treated with anti-PD1 antibody or IgG control. Arrows indicate time of antibody injections. h Mean tumor diameters with arrow indicating time of antibody injection (n = 6 per group) (left), data for individual mice (middle), and representative images of the mice described (right). i Flow cytometry analysis of tumor-infiltrating CD45+ cells (left), tumor-infiltrating CD8+ cells (middle), and CD8+ cells (right) in sDLNs (n = 4 control group and n = 3 UVB, UVB PD1 groups). j Flow cytometry analysis of percent of immune infiltrate cell types (n = 4 control group and n = 3 UVB, UVB PD1 groups). Shown are means ± SEM from one experiment out of three performed. Statistical significance was determined by two-way ANOVA test with Tukey correction (b, c, h), one-way ANOVA test with Tukey correction (i and j), or two-tailed t test (e, g). n.s. not significant. Error bars represent standard errors. Source data are provided as a Source Data file.
Fig. 2
Fig. 2. UVB induces a Ly6ahigh T cell subpopulation in the skin drain lymph nodes.
a Representative UMAPs for CD4+ subset markers levels (red, high; blue, low) in sDLNs (skin Drained Lymph Nodes) of UVB- or mock-irradiated mice (n = 4 per condition). b Cell density plots (left), FlowSOM clusters indicated by different colors (middle), and Ly6a levels (red, high; blue, low) in CD4+ clusters from sDLNs of UVB- or mock-irradiated mice. Arrows, colored by cluster, indicate significantly higher or lower levels in UVB-irradiated versus mock-irradiated mice (n = 4 per condition). c Left: Heatmap of median expression levels of the indicated markers in CD4+ clusters of sDLNs. Colors reflect the transformed ratio relative to the minimum expression of the indicated marker in CD4+ cells. Right: Percentage of each cluster from the total population of CD4+ cells (n = 4 per condition). df Analyzes for sDLNs CD8+ cells analysis as done for CD4+ T cells in (ac). g Mean percent of Ly6ahigh cells in various organs from UVB- and mock-treated mice (n = 4 per group). Statistical significance was determined in a two-tailed t test. n.s. not significant. Error bars represent standard errors. Source data are provided as a Source Data file.
Fig. 3
Fig. 3. Ly6ahigh T cells are induced by type 1 IFN secreted by DCs following UVB.
ae Single-cell RNA-seq analyzes of sDLNs isolated from UVB- and mock-irradiated (control) mice (n = 3 and n = 4, respectively). a t-SNE projection of all 14,783 CD4+ T cells (upper panel) and all 14,020 CD8+ T cells (lower panel) with subsets indicated by colors and numbers, accompanied by t-SNE projections colored by the expression levels of Ly6a (purple) in each cell. b Prediction of the active cytokines within the clusters that express high levels of Ly6a (CD4_4- upper panel; and CD8_5- lower panel). Red indicates a significant level of the activation signature. c Box plot (box represents percentile 25–75 and the median and whiskers represent the range between 10–90; points above the whiskers are drawn as individual points) of Ly6a expression in CD4+ T cells (upper) and CD8+ T cells (lower) following chronic UVB or mock irradiation (control) treatments. d Box plots (box represents percentile 25–75 and the median and whiskers represent the range between minima and maxima) of type 1 IFN signature of CD4+ T cells (upper) and CD8+ T cells (lower) following chronic UVB or mock irradiation (control) treatment. e Heatmap of difference (and significance level in Ly6a expression in UVB-treated mice versus mock-irradiated controls in each cluster of CD4+ and CD8+ T cells. f Representative flow cytometry images of Ly6a expression in splenic T cells activated ex vivo as indicated. g Mean percentages of Ly6a expression in splenic T cells activated ex vivo as indicated (n = 3 per condition). h Representative UMAP plots of non-T and non-B cells in sDLNs (skin Drained Lymph Nodes) from UVB- or mock-irradiated (control) mice (n = 4 per condition). i FlowSOM clusters in sDLNs from UVB- or mock-irradiated (control) mice (n = 4 per condition). j Left: Heatmap of median expression levels of the indicated markers in clusters of sDLNs. Colors reflect the transformed ratio relative to the minimum expression of the indicated marker in CD4+ cells. Right: Percentage of each cluster from the total innate cell population (n = 4 per condition). k Experimental flowchart. l Mean percentages of Ly6a levels in Ly6aneg/low/CD4+ cells after 72 h of co-culture with spleen or sDLN CD11b+ cells from UVB irradiated mice (n = 4 mice per group). Statistical significance was determined by two-tailed t test (ce, h, i, j, l) or one-way ANOVA test with Tukey correction (g). n.s. not significant. Error bars represent standard errors. Source data are provided as a Source Data file.
Fig. 4
Fig. 4. Ly6ahigh T cells are enriched in the tumor microenvironment independently of UVB exposure.
a Experimental flowchart. b Left: Representative flow cytometry analyzes of Ly6a expression levels in CD4+ (left) and CD8+ (right) T cells from inguinal lymph nodes, spleens, and tumors. Right: MFI of Ly6a normalized to isotype control (left) and percentage of Ly6ahigh cells in total CD4+ or CD8+ compartments (right) (n = 5 per condition). c Violin plots of Ly6a expression in CD4+ (left) and CD8+ (right) cells in lymph nodes and tumors. Single-cell RNA-seq data from Davidson et al.. d Experimental flowchart: Melanoma metastases were isolated from mouse lungs, and CD45+ cells were isolated and analyzed using CyTOF. CD4+ cells and CD8+ cells are divided into three groups: CD62l+ (blue gate), Ly6ahigh (red gate), and Ly6alow (green gate). e Heatmap of median expression levels of T cell markers in indicated cells. The colors reflect the transformed ratio relative to the minimum expression of the marker (n = 4 per group). Statistical significance was determined by one-way ANOVA test with Tukey correction (b) or two-tailed t test (c). n.s. not significant. Error bars represent standard errors. Source data are provided as a Source Data file.
Fig. 5
Fig. 5. Anti-Ly6a antibody has a strong immunotherapeutic effect even in mice resistant to anti-PD1 antibody treatment.
a Experimental flowchart. b Normalized mean numbers of B16F10 melanoma cells following co-culture with splenic CD8+ T cells from transgenic mice bearing gp100-reactive T cells in the presence of various clones of anti-Ly6a antibody or IgG control (n = 10 per group). c Mean tumor diameters (left) and data from individual mice (right) treated with UVB or mock-irradiated (control) and injected subcutaneously with Ret melanoma cells then treated with anti-Ly6a antibody or IgG control. Arrow indicates time of antibody injection (n = 6 per group). d Mean percentages of Granzyme B expression in tumor-infiltrating (left) or sDLN (skin Drained Lymph Nodes) (right) CD45+ cells (n = 5 per group). e Experimental flowchart. f Mean tumor diameters (left) and data for individual mice (right) injected with Ret melanoma cells and treated with anti-IFNR1, anti-Ly6a, or IgG (control) antibodies. The arrow indicates the day of treatment. (n = 6 per group). g Experimental flowchart. h Mean tumor diameters (left) and individual data (right) for mice injected with Ret melanoma cells and treated with anti-PD1, anti-PD-1, anti-Ly6a, or IgG (control) antibodies (n = 6 per group). Arrows indicate days of treatment. Statistical significance was determined by two-way ANOVA test with Tukey correction (b, c, f, h) or two-tailed t test (d). Error bars represent standard errors. Source data are provided as a Source Data file.
Fig. 6
Fig. 6. Anti-Ly6a antibody treatment enhances CD8+ T cell activity and prevents loss of mitochondrial function through effect on cMyc-mediated signaling.
a Experimental flowchart. b Principal component analysis of the proteins that significantly changed across indicated conditions (n = 9 per condition). c Heatmap of the average Z scores for each group. Selected proteins in cluster 1 and cluster 5 are indicated. d GO terms significantly associated with proteins of cluster 1. Shared colors indicate related GO terms. e String protein networks of significantly changed proteins in all samples that are associated with the GO term “mitochondrion”. Selected GO terms are indicated. Clusters are indicated by circle colors (red and blue). f Representative flow cytometry (left) and mean percentages (right) of TMRE expression in CD8+ cell (n = 4 per condition). g MFI of TMRE expression in IFNα exhausted CD8+ T cells (n = 3 per group). h Predicted upstream regulators of the significantly changed proteins in all samples. Arrows represent the predicted effect of anti-Ly6a crosslinking. i Mean intensity (upper) and representative flow cytometry (lower) of phosphorylated Erk1/2 in CD8+ T cells incubated with anti-Ly6a antibodies (n = 5 per group). j Representative confocal images (left) and mean percentages of T cells with nuclear c-Myc (right) following exhaustion with IFNα and incubation with anti-Ly6a antibodies (n = 10). Shown is one representative experiment out of at least three independent experiments performed. The scale bar is 20 µM. Statistical significance was calculated using one way ANOVA with Tukey’s correction for multiple comparisons (f, g, i, j) or FDR correction with FDR < 0.1 significant (c, d). n.s. not significant. Error bars represent standard errors. Source data are provided as a Source Data file.

References

    1. Roelandts, R. The history of phototherapy: something new under the sun? J. Am. Acad. Dermatol.46, 926–930 (2002). - PubMed
    1. Romerdahl, C. A., Donawho, C., Fidler, I. J. & Kripke, M. L. Effect of ultraviolet-B radiation on the in vivo growth of murine melanoma cells. Cancer Res48, 4007–4010 (1988). - PubMed
    1. Donawho, C. K. & Kripke, M. L. Evidence that the local effect of ultraviolet radiation on the growth of murine melanomas is immunologically mediated. Cancer Res51, 4176–4181 (1991). - PubMed
    1. Hart, P. H. et al. Dermal mast cells determine susceptibility to ultraviolet B-induced systemic suppression of contact hypersensitivity responses in mice. J. Exp. Med.187, 2045–2053 (1998). - PMC - PubMed
    1. Damiani, E. & Ullrich, S. E. Understanding the connection between platelet-activating factor, a UV-induced lipid mediator of inflammation, immune suppression and skin cancer. Prog. Lipid Res.63, 14–27 (2016). - PMC - PubMed

Publication types

MeSH terms

Associated data