. 2024 Sep 27;15(1):8381.
doi: 10.1038/s41467-024-50986-7.

The microprotein HDSP promotes gastric cancer progression through activating the MECOM-SPINK1-EGFR signaling axis

Affiliations

The microprotein HDSP promotes gastric cancer progression through activating the MECOM-SPINK1-EGFR signaling axis

Yuli Chen et al. Nat Commun. .

Abstract

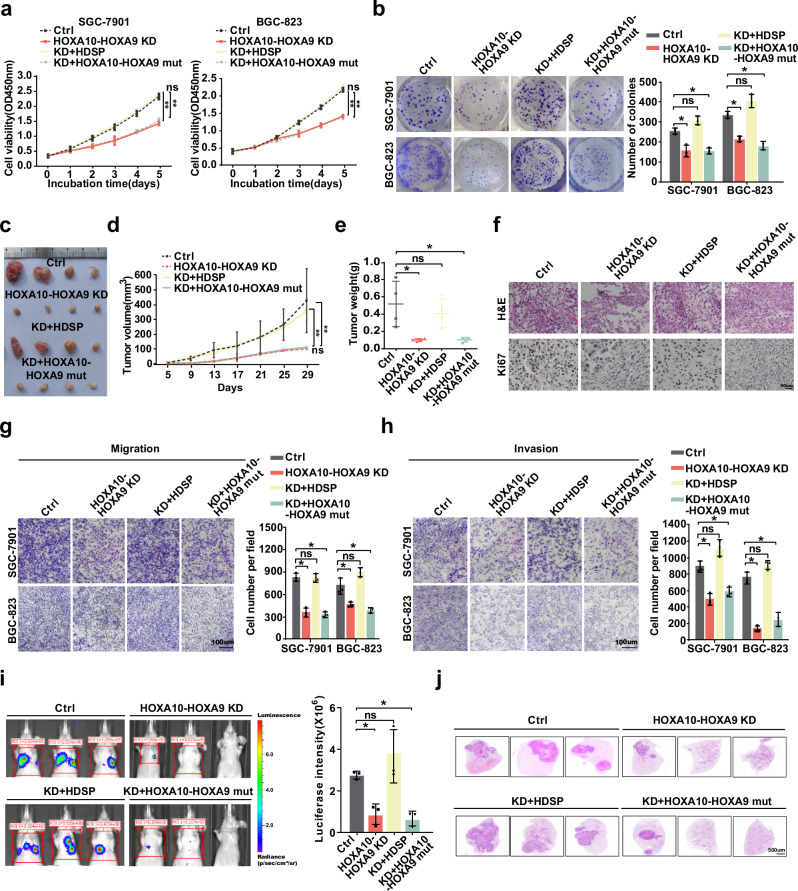
The presence of noncanonical open reading frames within lncRNAs (long non-coding RNAs) suggests their potential for translation, yielding various functional peptides or proteins. However, the existence and specific roles of these products in gastric cancer remain largely unclear. Here we identify the HOXA10-HOXA9-derived small protein (HDSP) in gastric cancer through comprehensive analysis and experimental validation, including mass spectrometry and western blotting. HDSP exhibits high expression and oncogenic roles in gastric cancer. Mechanistically, HDSP blocks TRIM25-mediated ubiquitination and degradation by interacting with MECOM, leading to MECOM accumulation and enhanced SPINK1 transcription-a gene promoting cancer via the EGFR signaling pathway. Furthermore, MECOM fosters HOXA10-HOXA9 transcription, establishing a feedback loop activating SPINK1-EGFR signaling. HDSP knockdown inhibits tumor growth in a PDX (patient-derived xenograft) model, and infusion of an artificially synthesized HDSP peptide as a neoantigen enhances immune cell-mediated anti-tumor efficacy against gastric cancer in vitro and in vivo. These findings propose HDSP as a potential therapeutic target or neoantigen candidate for gastric cancer treatment.


Conflict of interest statement

The authors declare no competing interests.

Figures

Fig. 1
Fig. 1. HOXA10-HOXA9 encodes a microprotein HDSP in GC.
a Analyzing GC datasets from TCGA, GC-related datasets from GEO, and ribosome sequencing datasets, the differentially expressed lncRNAs in various datasets were intersected to create a Venn diagram. b Polysome-bound RNA isolation and qRT-PCR were used to analyze the enrichment of the five candidate lncRNAs on polyribosomes in SGC-7901 cells. Mean ± SD, n = 3 biologically independent experiments. c QRT-PCR analysis of HOXA10-HOXA9 expression in 70 paired GC tissues. Mean ± SD, Paired samples, 2-sided Student’s t test. ****P < 0.0001. d QRT-PCR analysis of HOXA10-HOXA9 expression levels in 7 GC cell lines and normal gastric mucosal epithelial cells (GES-1). Mean ± SD, Unpaired two‐tailed Student’s t test. n = 3 biologically independent experiments. *P < 0.05, **P < 0.01, ***P < 0.001, ****P < 0.0001. e A schematic diagram shows the HOXA10-HOXA9 ORF2 encoding a 112aa small protein. f Schematic representation of the structures of HDSP-GFP, HDSP-Flag, and their respective mutant variants. g The expression vector depicted in (f) was separately transfected into GC cells. After 48 h, the expression of the HDSP-GFP fusion protein (left) and HDSP-Flag fusion protein (right) were assessed using western blot analysis. The experiment was repeated 3 times independently with similar results. h Following transfection of GFP, HDSP-GFP, and their respective mutant plasmids into GC cells, the green fluorescence emitted by GFP was visualized using a fluorescence microscope. The experiment was repeated 3 times independently with similar results. i After transfecting GC cells with HDSP-Flag and its mutant vector, the subcellular localization of the fusion protein was examined using immunofluorescence. The experiment was repeated 3 times independently with similar results. j The sequences of HOXA10-HOXA9 were cloned into overexpression vectors containing T7 promoters, and their coding potential was validated through in vitro translation experiments. The experiment was repeated 3 times independently with similar results. k The schematic diagram illustrates the Flag Knock-In Strategy. The insertion of the Flag tag after the start codon of HDSP represents a fusion expression. l Western blot was employed to ascertain the successful integration of the Flag tag into GC cells. The experiment was repeated 3 times independently with similar results. m After introducing Flag via knock-in in GC cells, HOXA9 was subsequently knocked out, followed by the assessment of HOXA9 and HDSP expression levels using western blot analysis. The experiment was repeated 3 times independently with similar results. Source data are provided as a Source data file.
Fig. 2
Fig. 2. High levels of endogenous HDSP correlate with poor prognosis for GC patients.
a Western blot detected endogenous HDSP expression in seven cell lines and normal gastric mucosal epithelial cells (GES-1). The experiment was repeated 3 times independently with similar results. b SGC-7901 cell protein was separated using SDS-PAGE and stained with Coomassie Blue. Specific bands corresponding to HDSP were identified by MS. c Western blot detection of HDSP expression in 70 pairs of GC patients (12 pairs were shown). The experiment was repeated 3 times independently with similar results. d Endogenous HDSP in GC tissue was detected by MS after Coomassie brilliant blue staining. e The grayscale values of HDSP/β-actin in 70 pairs of GC tissues were quantitatively analyzed. Paired samples, 2-sided Student’s t test. ****P < 0.0001. f Combined with the clinicopathological data analysis of 70 patients with GC, the expression of HDSP was examined in relation to tumor size, stage, and lymph node metastasis. Mean ± SD, 2-sided Student’s t test. ***P < 0.001, ****P < 0.0001. g 70 GC patients were stratified into two groups based on the expression levels of HDSP, n(HDSP Low) = 33, n(HDSP High) = 37, and Kaplan–Meier analysis was employed to plot the overall survival curve. A log-rank test. h Plotting the GC patients’ Receiver Operating Characteristic (ROC) curve according to the expression of HDSP. Data are presented as AUC  ±  95% CI. AUC area under the curve, CI confidence interval. i HDSP expression correlated with the prognosis of GC patients, univariate and multivariate COX analysis, n = 70. NT non-tumor, T tumor. Source data are provided as a Source data file.
Fig. 3
Fig. 3. HDSP exerts oncogenic effects in gastric cancer.
a, b The HDSP or HOXA10-HOXA9 mut expression plasmids was reintroduced into GC cells with stable low HDSP levels. Thus, the GC cells were divided into four groups: Ctrl, HOXA10-HOX9KD, KD + HDSP, and KD + HOXA10-HOXA9 mut. Proliferative activity of above four groups of GC cells were evaluated using CCK-8 (a) and colony formation (b) assays. Mean ± SD, two-tailed Student’s t test, n = 3 biologically independent experiments. ns, not significant; *P < 0.05, **P < 0.01. c Subcutaneous injection of above four groups GC of cells into nude mice was performed and representative images of tumors in xenograft model were shown. d Absolute tumor volume presented as a mean ± SD, n  =  4 biologically independent animals. ns, not significant; **P < 0.01. e Tumor weight was measured after 29 days. Mean ± SD, two-tailed Student’s t test, n  =  4. ns, not significant; *P < 0.05. f Representative H&E staining of xenograft tissues and IHC staining of Ki67 are shown. Scale bar: 50 μm. g, h Transwell assays were conducted to analyze the migration and invasion ability of above four groups of GC cells. Scale bar: 100 μm. Mean ± SD, two-tailed Student’s t test. n = 3 biologically independent experiments. ns, not significant; *P < 0.05. i BLI showing lung metastasis in vivo. Mean ± SD, two-tailed Student’s t test. n = 3 biologically independent animals. ns, not significant; *P < 0.05. j H&E staining to detect the number and size of nodule production in the lung metastasis model. Scale bar: 500 μm. NC negative control, KD knock down. Source data are provided as a Source data file.
Fig. 4
Fig. 4. HDSP interacts with MECOM and prevents it from ubiquitination-mediated degradation.
a In SGC-7901 cells with stable overexpression of HDSP-Flag, the IP enrichment of the target protein interacting with HDSP was assessed by silver staining. b Bidirectional Co-IP was employed to investigate the interaction between HDSP and MECOM in GC cells. c The interaction between HDSP and MECOM in GC cells was detected by PLA. The experiment was repeated 3 times independently with similar results. Scale bar: 10 μm. d The swMATH software provides the most likely docking method for HDSP and MECOM. e Schematic diagram of HDSP and MECOM truncation. HDSP is evenly divided into N-terminal and C-terminal segments, while MECOM is divided into four segments corresponding to its four domains. f The binding sites between HDSP and MECOM were verified through Co-IP experiments using their different truncated forms. g After the expression and protein purification of MECOM-His and HDSP-GST, the interaction between HDSP and MECOM in vitro was detected using a GST pull-down assay. h Western blot analysis was conducted to assess MECOM expression levels in GC cells with stable low or overexpression of HDSP. i GC cells were treated with cycloheximide (CHX, 10 µM), and MECOM protein levels were assessed by western blot at 0, 6, 12, and 18 h. j GC cells were treated with either MG132 (10 mM) or CQ (20 µM) for 6 h, following which the expression levels of MECOM were evaluated using western blot. k After co-transfection of HA-Ub and MECOM-Flag, HEK-293T cells were treated with MG132, and the ubiquitination level of MECOM was assessed using the Co-IP. l Co-IP was employed to identify the type of ubiquitination modification of MECOM mediated by HDSP. m, n Co-IP was utilized to assess the ubiquitination modification level of MECOM following knockdown or overexpression of HDSP. All western blot assay was repeated 3 times independently with similar results. Source data are provided as a Source data file.
Fig. 5
Fig. 5. TRIM25 interacts with MECOM to mediate its ubiquitination which could be competitively blocked by HDSP.
a In SGC-7901 cells with stable overexpression of MECOM-Flag, the proteins interacting with MECOM were enriched using IP, and the enrichment efficiency was evaluated by silver staining. b A mass spectrum displaying a unique peptide of TRIM25 identified in MECOM-IP/MS results. c Bidirectional Co-IP was performed to verify the interaction of MECOM with TRIM25 in GC cells. The experiment was repeated 3 times independently with similar results. d After the expression and protein purification of MECOM-His and TRIM25-GST, the interaction between TRIM25 and MECOM in vitro was detected using a GST pull-down assay. e Western blot analysis was performed to assess the levels of MECOM protein expression in two different TRIM25-depleted GC cells. f GC cells with TRIM25 knockdown were treated with CHX (10 µM), and protein samples were collected at 0, 6, 12, and 18 h for western blot analysis to determine MECOM expression levels. Mean ± SD, two-tailed Student’s t test. n = 3 biologically independent experiments. ***P < 0.001, ***P < 0.0001. g Following the knockdown of TRIM25, Co-IP was utilized to assess the level of ubiquitination modification of MECOM in GC cells. h After expressing and purifying MECOM-Flag and TRIM25-GST, E2 binding enzymes potentially involved in MECOM ubiquitination were identified using the E2Select Ubiquitin Conjugation Assay. i After co-transfecting HEK-293T cells with four truncated MECOM expression plasmids and TRIM25 expression plasmids, the regions where TRIM25 and MECOM interacted were detected using Co-IP. j Co-IP was utilized to determine whether the competitive binding of HDSP and TRIM25 to MECOM is dose-dependent on the quantity of HDSP. k Co-IP was utilized to ascertain the interaction between MECOM and TRIM25 following either the knockdown or overexpression of HDSP. l The interaction between TRIM25 and MECOM following HDSP knockdown in GC cells was assessed using a PLA. All experiments were repeated 3 times independently with similar results. Source data are provided as a Source data file.
Fig. 6
Fig. 6. SPINK1 is a transcriptional target co-regulated by HDSP/MECOM axis.
a After knocking down MECOM in SGC-7901 cells, RNA-seq identified differentially expressed genes for GO and KEGG pathway analysis. b RNA sequencing in SGC-7901 cells, post HDSP knockdown or MECOM interference, intersected with MECOM’s ChIP-seq data to generate a Venn diagram. c, d The expression of SPINK1 were examined by qRT-PCR and western blot upon HDSP or MECOM knockdown. Two-way ANOVA analysis. *P < 0.05, **P < 0.01. e Prediction of MECOM binding site in the promoter region of SPINK1 by JASPAR. f The effect of MECOM on SPINK1 promoter activity was tested using a dual luciferase reporter assay with wild-type and mutant plasmids containing predicted binding sites. Two-way ANOVA analysis. ns, not significant; *P < 0.05, **P < 0.01. g, h The enrichment of MECOM binding at the SPINK1 promoter was assessed using ChIP-PCR. Two-sided Student’s t test. *P < 0.05, **P < 0.01. i The RNA expression of SPINK1 protein was measured after the knockdown of AP-1 complex. Two-way ANOVA analysis. *P < 0.05, **P < 0.01. j ChIP-PCR assay detected the enrichment of c-FOS and c-JUN in the promoter region of SPINK1. Two-sided Student’s t test. *P < 0.05, **P < 0.01. k The transcriptional activity of c-FOS and c-JUN on the SPINK1 promoter was evaluated using a dual luciferase reporter gene assay. One-way ANOVA analysis. *P < 0.05, **P < 0.01. l A linear regression model was used to assess the correlation between MECOM abundance and SPINK1, HDSP, and SPINK1 proteins in 70 pairs of GC tissues. Two-sided chi-square test. m Representative image of SPINK1 immunohistochemical staining in 90 paired GC tissue microarrays. Scale bar: 50 μm. n GC patients were categorized into 2 groups based on SPINK1 expression, n(SPINK1 Low) = 31, n(SPINK1 High) = 53, and overall survival curves were generated using Kaplan-Meier analysis. o Bidirectional Co-IP verifies the interaction between SPINK1 and EGFR in GC cells. The experiment was repeated 3 times independently with similar results. p Western blot was used to measure EGFR phosphorylation levels and downstream signaling molecules after either HDSP knockdown or SPINK1 overexpression. The experiment was repeated 3 times independently with similar results. sh-NC, control shRNA; EV, empty vector; OE, overexpression. Data are means ± SD, n = 3 biologically independent experiments. Source data are provided as a Source data file.
Fig. 7
Fig. 7. MECOM/HOXA10-HOXA9-HDSP/MECOM form a positive feedback regulatory circuit.
a Diagram illustrating the binding of MECOM to the HOXA10-HOXA9 promoter. b, c QRT-PCR and western blot analyses were conducted to detect the effect of MECOM or AP-1 complex interference on HOXA10-HOXA9 in GC cells. The western blot assay was repeated 3 times independently with similar results. Mean ± SD, one-way ANOVA analysis. n = 3 biologically independent experiments. **P < 0.01, ***P < 0.001. df ChIP-PCR assay detected the enrichment of MECOM or AP-1 complex in the promoter region of HOXA10-HOXA9. Mean ± SD, one-way ANOVA analysis. n = 3 biologically independent experiments. *P < 0.05, **P <0.01. g, h Transcriptional activity of MECOM or AP-1 complex on the HOXA10-HOXA9 promoter was assessed via dual luciferase reporter gene assay. Mean ± SD, one-way ANOVA analysis. n = 3 biologically independent experiments. ns, not significant; *P < 0.05, **P < 0.01. i The mechanism diagram illustrates a positive feedback regulatory loop involving MECOM/HOXA10-HOXA9-HDSP, which continuously promotes the proliferation and metastasis of GC cells. This mechanism diagram was created using BioRender.com and is licensed under the Creative Commons Attribution-NonCommercial-NoDerivatives 4.0 International License (https://creativecommons.org/licenses/by-nc-nd/4.0/deed.en). Source data are provided as a Source data file.
Fig. 8
Fig. 8. HDSP is a valuable therapeutic target and neoantigen for gastric cancer vaccine development.
a A schematic of the PDX GC model construction is depicted. Mice were intratumorally injected with either shRNA-HDSP vector (purple arrows) or empty pLV6 vector (green arrows) with delivery buffer for 3 weeks. This schematic was created using BioRender.com and is licensed under the Creative Commons Attribution-NonCommercial-NoDerivatives 4.0 International License. bd Representative tumor tissue image post-HDSP knockdown in the PDX model (b). Following intratumoral sh-HDSP plasmid injection, tumor volume (c) and weight (d) were assessed. Two-way/One-way ANOVA analysis. n = 5 biologically independent animals. *P < 0.05, **P < 0.01. e The conformation of HDSP, as predicted by trRosetta, is shown along with the bisection of HDSP into 6 peptides. f, g GC cells were treated with PBMC and 6 peptides, respectively. The apoptosis rate of GC cells was assessed using flow cytometry (f), and the LDH release rate was measured with an LDH release assay (g). One-way ANOVA analysis. n = 3 biologically independent experiments. *P < 0.05, **P < 0.01. h After co-incubating GC cells with PBMCs and different HDSP peptides, the ELISpot assay quantified IFN-γsecretion by PBMCs stimulated with these peptides. One-way ANOVA analysis. n = 3 biologically independent experiments. i HLA immunopeptitomic analysis revealed the presentation of HDSP peptide-3 on cell membranes by HLA-1. j Schematic of HSC-humanized model construction: PDX model established, HSC-humanized mice divided into three groups. Group 1: DPBS injections; Group 2: HDSP peptide-3 injections for 4 weeks; Group 3: T cell depletion with TCRβmonoclonal antibody before HDSP peptide-3 administration. This schematic was created using BioRender.com and is licensed under the Creative Commons Attribution-NonCommercial-NoDerivatives 4.0 International License. k Representative tumor image from euthanized HSC-humanized mice. l, m The tumor volume and weight of the above HSC-humanized model mice were measured. Two-way ANOVA analysis. n  =  4 biologically independent animals. *P < 0.05, **P < 0.01,***P < 0.001. n Flow cytometry evaluated CD3-positive T cell percentage in HSC-humanized mice plasma. One-way ANOVA analysis. n = 3 biologically independent animals. ***P < 0.001. o The serum levels of IFN-γ, CD25, and CD40L in the aforementioned mice were measured using ELISA. One-way ANOVA analysis. n = 3 biologically independent animals. *P < 0.05, **P < 0.01. p The levels of CD25 and CD69 expression in the serum of the mentioned mice were analyzed using flow cytometry. One-way ANOVA analysis. n = 3 biologically independent animals. *P < 0.05. Data are means ± SD. Source data are provided as a Source data file.

References

    1. Siegel, R. L., Miller, K. D. & Jemal, A. Cancer statistics, 2020. CA Cancer J. Clin.70, 7–30 (2020). - PubMed
    1. Xia, C. et al. Cancer statistics in China and United States, 2022: profiles, trends, and determinants. Chin. Med. J.135, 584–590 (2022). - PMC - PubMed
    1. Siegel, R. L., Miller, K. D., Fuchs, H. E. & Jemal, A. Cancer statistics, 2022. CA Cancer J. Clin.72, 7–33 (2022). - PubMed
    1. Sung, H. et al. Global cancer statistics 2020: GLOBOCAN estimates of incidence and mortality worldwide for 36 cancers in 185 countries. CA Cancer J. Clin.71, 209–249 (2021). - PubMed
    1. Mudge, J. M. et al. Standardized annotation of translated open reading frames. Nat. Biotechnol.40, 994–999 (2022). - PMC - PubMed

Publication types

MeSH terms