Observational Study
. 2024 Sep 27;15(1):8323.
doi: 10.1038/s41467-024-52561-6.

Gut microbiota wellbeing index predicts overall health in a cohort of 1000 infants

Affiliations
Observational Study

Gut microbiota wellbeing index predicts overall health in a cohort of 1000 infants

Brandon Hickman et al. Nat Commun. .

Abstract

The human gut microbiota is central in regulating all facets of host physiology, and in early life it is thought to influence the host's immune system and metabolism, affecting long-term health. However, longitudinally monitored cohorts with parallel analysis of faecal samples and health data are scarce. In our observational study we describe the gut microbiota development in the first 2 years of life and create a gut microbiota wellbeing index based on the microbiota development and health data in a cohort of nearly 1000 infants using clustering and trajectory modelling. We show that infants' gut microbiota development is highly predictable, following one of five trajectories, dependent on infant exposures, and predictive of later health outcomes. We characterise the natural healthy gut microbiota trajectory and several different dysbiotic trajectories associated with different health outcomes. Bifidobacterium and Bacteroides appear as early keystone organisms, directing microbiota development and consistently predicting positive health outcomes. A microbiota wellbeing index, based on the healthy development trajectory, is predictive of general health over the first 5 years. The results indicate that gut microbiota succession is part of infant physiological development, predictable, and malleable. This information can be utilised to improve the predictions of individual health risks.


Conflict of interest statement

The authors declare no competing interests.

Figures
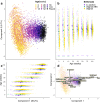
Fig. 1
Fig. 1. Infant gut microbiota in 984 infants ranging from 3 weeks to 2 years.
a Principal coordinates (PC) analysis on Pearson correlation distances of log-transformed relative abundances of microbial genera. Colour shows the infant age from 3 to 104 weeks. Parent microbiota is represented as black. b PC Component 2 score against age and birth mode. Group median values are represented by the large circles. c PC Component 1 score against age and birth mode. Comparisons of birthmodes (C-section and Vaginal ABX to vaginally born infants) are represented with P-values are provided are colour-coded by comparison at the bottom (b) / left (c) of the panel based on a two-sided T-test. d Significant associations between the PC ordination and factors influencing gut microbiota according to envfit.
Fig. 2
Fig. 2. Impact of exposures and priority effects.
a Variance in principal component (PC) scores partitioned to different types of early exposures at each time point according to multivariate regression. b Variance in PC scores attributable to early exposures (Other variables) and the previous time points’ PC scores. c Variance in PC scores attributable to early exposures (Other variables) and the first time point’s PC scores. d Associations between abundant microbial families, birth mode, breastfeeding, and siblings. Comparisons of Birthmode (C-section and Vaginal ABX to Vaginal), Diet (Breastmilk and Mixed to Formula) and Siblings (No Siblings to Siblings) are represented with P-values denoted by colour-coded asterisks at the bottom of the panel based on generalised linear models: ***p < 0.001; **p < 0.01; *p < 0.05. The data are presented as mean values +/− SEM.
Fig. 3
Fig. 3. Microbiota community types.
a Principal coordinates (PC) analysis on Pearson correlation distances of log-transformed relative abundances of microbial genera. Circle colour represents community type: C1: 2033 (green), C2: 1016 (blue), C3: 1100 (orange), and C4: 1932 (red). Histograms show distribution by community type for corresponding PC. b Average genus-level microbiota composition by community type (“C”) in infants. Unallocated percentages are due to additional genera not shown. c Microbial richness (number of species). Significance of the difference to C1 is indicated by the asterisks:***p < 0.001; **p < 0.01; *p < 0.05. All p-values < 2.26e-16. d Relative abundance of pathobionts by community type. Significance of the difference to C1 is indicated by the asterisks: ***p < 0.001; **p < 0.01; *p < 0.05 (p < 2.26e-16 (C1-C2), p = 0.023(C1-C3), p < 2.2e-16 (C1-C4)). Box plots show the median as centre line and interquantile range, and whiskers show the minimum and maximum quantile range Comparisions for (c, d) were done using a two-sided Wilcox rank sum test, and no adjustments were made for multiple testing.
Fig. 4
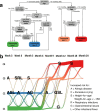
Fig. 4. Community type determinants and health associations.
a Partitioning tree of the determinants of microbiota community types. P-values from χ2 test for the split and percentages (shown in brackets) of infants following the rule are shown. b Transitions between community types over time and the associations with health outcomes by 5 years (p < 0.05) at different ages using a negative generalized linear model (Supplementary Fig. 5, Supplementary Data 6). Lines representing < 5 infants are omitted. Adjustments are made for multiple comparisions.
Fig. 5
Fig. 5. Microbiota development trajectories, determinants, and associations with health outcomes.
Transitions between microbiota community types (C1:green, C2:blue, C3: orange, C4: red) by trajectory (ae). Comparison between the trajectories (T1: blue, T2:green T3: violet, T4: yellow, T5: red) and average gut microbiota composition in global reference data representing 30 studies from 5732 infants divided into the normal (born vaginally, not exposed to antibiotics, and breastfed), and the compromised group (C-section born, antibiotic exposed or not breastfed). The trend line amd 95% confidence interval (shaded area) are obtained from a regression model with the third degree polynomial of log-transformed age, weighted by the size of the cohort. f The global data are cross-sectional averages, and thus represent very broad general patterns. Associations between trajectories and infant exposures, based on c2 test on contingency tables (g), and between trajectories and health outcomes using logistic regression model (h). P-values denoted by asterisks at the bottom of each panel: ***p < 0.001; **p < 0.01; *p < 0.05. Adjustments were made for multiple comparisons for g, h.
Fig. 6
Fig. 6. Microbiota wellbeing index (MWI).
a Wellbeing index and microbial associations, measured as estimates from a logistic regression model predicting membership to the reference group. Top bar colours represent the bacterial class. b Wellbeing index values over time for Reference (green;) defined as children with no diagnosed allergic diseases or growth below or above the 2 sd during the first 5 years of life in T1, Growth differences (orange) defined as those children with weight below/above the 2 sd and height <2 sd during the first 5 years of life, and Allergic diseases (purple) defined as those children with allergy, atopy, rhinitis or asthma during the first 5 years of life, showing the means (lines) and the percentage (0.5,0.8,0.95) of the population within the scale. c Area under the curve (AUC) values from logistic regression models predicting health outcomes with MWI measured at different ages: ***p < 0.001, **p < 0.01, *p < 0.05, · p < 0.1. Only prospective associations are included. d Associations between MWI and infant exposures. No adjustments were made for multiple comparisions.

References

    1. Sharon, G., Sampson, T. R., Geschwind, D. H. & Mazmanian, S. K. The central nervous system and the gut microbiome. Cell167, 915–932 (2016). - PMC - PubMed
    1. Martin, R. et al. Early life: gut microbiota and immune development in infancy. Benef. Microbes4, 367–382 (2010). - PubMed
    1. Nguyen, Q. P. et al. Associations between the gut microbiome and metabolome in early life. BMC Microbiol.21, 238 (2021). - PMC - PubMed
    1. Korpela, K. & de Vos, W. M. Infant gut microbiota restoration: state of the art. Gut Microbes14, 2118811 (2022). - PMC - PubMed
    1. Korpela, K. et al. Selective maternal seeding and environment shape the human gut microbiome. Genome Res.28, 561–568 (2018). - PMC - PubMed

Publication types

LinkOut - more resources