. 2024 Sep 27;15(1):8329.
doi: 10.1038/s41467-024-52660-4.

Genome-wide impact of codon usage bias on translation optimization in Drosophila melanogaster

Affiliations

Genome-wide impact of codon usage bias on translation optimization in Drosophila melanogaster

Xinkai Wu et al. Nat Commun. .

Abstract

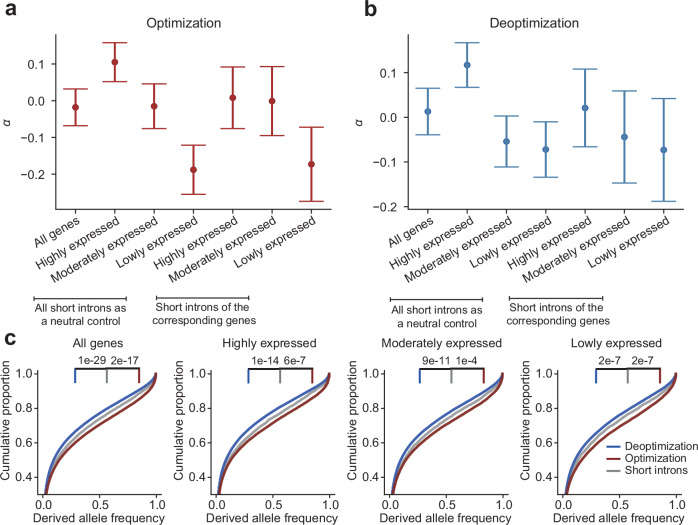
Accuracy and efficiency are fundamental to mRNA translation. Codon usage bias is widespread across species. Despite the long-standing association between optimized codon usage and improved translation, our understanding of its evolutionary basis and functional effects remains limited. Drosophila is widely used to study codon usage bias, but genome-scale experimental data are scarce. Using high-resolution mass spectrometry data from Drosophila melanogaster, we show that optimal codons have lower translation errors than nonoptimal codons after accounting for these biases. Genomic-scale analysis of ribosome profiling data shows that optimal codons are translated more rapidly than nonoptimal codons. Although we find no long-term selection favoring synonymous mutations in D. melanogaster after diverging from D. simulans, we identify signatures of positive selection driving codon optimization in the D. melanogaster population. These findings expand our understanding of the functional consequences of codon optimization and serve as a foundation for future investigations.


Conflict of interest statement

The authors declare that they have no competing interests.

Figures

Fig. 1
Fig. 1. Summary of translation errors.
a llustration of translation errors due to codon-anticodon mispairing, exemplified by the GGG codon, which should pair with the CCC anticodon of a tRNA carrying glycine. Occasionally, GGG incorrectly pairs with the CCG anticodon of a tRNA for arginine. Misincorporated amino acids are identified by comparing mass differences between the dependent peptide (DP) and the base peptide (BP). The translation error rate is calculated by comparing the intensity of the BP to the total intensity of both BP and DP for that codon. b The number of codon positions showing translation errors across samples is depicted. Each bar represents the mean, with error bars indicating the standard error of the mean (SEM) from four biological replicates. The dashed line shows the linear regression of mean translation errors against developmental timing, with virgin males and females treated as one stage and mated adults as a subsequent stage. c An example of inferring mistranslation from the original codon to possible destination codons for an identified error is shown. The GGG codon (Gly) may be misincorporated as Arg (R), with errors assigned to destination codons based on usage frequencies in D. melanogaster transcriptomes. Destination codons are categorized as near-cognate (one mismatch) and non-cognate (more than one mismatch). d The expected fractions of NeCE and NoCE occurrences under randomness (left) versus the observed fractions. e Observed and expected NeCE mismatches are plotted (y-axis) at each codon position (x-axis). One-sided Fisher’s exact test was used upon the first and second positions of the codon. Two-sided Fisher’s exact test was used upon the third position of the codon. f Counts of base mispairing occurrences in NeCE events are shown. The x-axis labels represent the nucleotide sequences of codons and the corresponding anticodons. The y-axis shows the three base positions on codons, with G:G pairing being the primary cause of translation errors at the first codon position, forming two stable hydrogen bonds and contributing to ribosomal decoding stability. Source data are provided as a Source Data file.
Fig. 2
Fig. 2. The influence of mass spectrometry throughput on translation error identification.
a Box plot displaying the fractions of optimal and nonoptimal codon types showing translation error events in mass spectrometry libraries. The proportion of optimal codons (24 total, left panel) and nonoptimal codons (35 total, right panel) that exhibited at least one translation error was calculated. Fractions (dots) from the same sample are connected by a solid gray line. The box plot shows the median, upper and lower quartiles, and whiskers (1.5 times the interquartile range) across 68 spectrometry libraries. P-value was calculated using a one-sided Wilcoxon signed-rank test. b Box plot of the median number of codon positions detected in the libraries. The median number of codon positions for 24 optimal and 35 nonoptimal codon types was calculated. Median numbers (dots) from the same sample are connected by a solid gray line, with the plot showing the median, quartiles, and whiskers across 68 libraries. P-value was calculated using a one-sided Wilcoxon signed-rank test. c Median intensities for peptides covering genomic positions with errors (y-axis) versus those without errors (x-axis). Intensities of all peptides (BP + DP) covering genomic positions with translation errors are log10-transformed, and the median value is calculated (y-axis). Intensities of remaining peptides are also log10-transformed, and the median value is calculated (x-axis). The dark-red dashed line indicates equal intensity. P-value was calculated using a one-sided Wilcoxon signed-rank test. d Median intensities for codon types showing translation errors (y-axis) versus those without error (x-axis) are calculated similarly. P-value was calculated using a one-sided Wilcoxon signed-rank test. e Median intensities for optimal codon types (y-axis) versus nonoptimal codon types (x-axis) are also calculated similarly. P-value was calculated using a one-sided Wilcoxon signed-rank test. f The number of identified codon types showing translation errors (y-axis) under varying mass spectrometry throughputs (x-axis) is plotted. Throughput is represented by the total number of detected amino acids in the proteome. Each simulation was repeated 200 times, with median values shown in dark red and 95% confidence intervals in gray. Source data are provided as a Source Data file.
Fig. 3
Fig. 3. Relationship between translation error rate and codon optimality.
a The translation error rate of optimal (y-axis, log10-transformed) against nonoptimal (x-axis, log10-transformed) codons across 68 mass spectrometry libraries. For each sample, the error rate for all nonoptimal codons was calculated (x-axis); and the median value and 95% CI of error rates for optimal codons after random down-sampling (1000 replicates) were also calculated (y-axis, the median is plotted as points and 95% CI as gray lines). The dark-red dashed line indicates an equal error rate. A P-value of a one-sided Wilcoxon signed-rank test is indicated. b Relationship between the translation error rate (y-axis, log10-transformed) and the RSCU value (x-axis) for a codon type. For each sample, only codon types showing translation errors were retained. Each point represents a codon type, with the y-axis representing the average error rate of that codon type and error bars representing the standard errors of translation error rate across different samples. The solid line represents the linear regression fitted line. 4 biological replicates are assigned as random effects with a mean group size of 194.75 in the model (779 observations in total). 58 codon types are included in the analysis. The coefficient of the linear mixed model and P-value are indicated. c A specific example (pupae day 2) from (b) showing a significant negative correlation between error rate and RSCU for codon types. d Relationship between relative mistranslation rate (RMR) (y-axis) and RSCU (x-axis) for a codon type. For each sample, only amino acids with all synonymous codons showing translation errors in that sample were considered in the analysis. Each point represents the average relative error rate of a codon type across different samples, with error bars indicating the standard error. The solid line represents the linear regression fitted line. 4 biological replicates are assigned as random effects with a mean group size of 22.5 in the model (90 observations in total). 29 codon types are included in the analysis. The coefficient of the linear mixed model and the P-value are shown in the plot. Source data are provided as a Source Data file.
Fig. 4
Fig. 4. Impact of codon optimization on ribosome elongation rates.
a Calculating mRNA-calibrated ribosomal coverage (mRC) and gene-normalized mRNA-calibrated ribosomal coverage (gmRC) for a codon. For each codon, the mRNA-Seq coverage and the RPF coverage (after A-site offsetting) were calculated, and the MRC was calculated as the ratio of mRNA over RPF coverage; and the mean MRC value of all the codons in a gene was used to calculate the gmRC value for each codon in that gene. b ECDF (empirical cumulative distribution function) of gmRC for optimal and nonoptimal codons in 0–2 h embryos, with zero-RPF-covered codon positions excluded. The P-value was calculated using a one-sided Wilcoxon rank-sum test. c The distribution of log10-transformed gmRC in 0–2 h embryos (zero-RPF covered codon positions were excluded). Codon positions showing the top 1% and bottom 1% of gmRC were treated as slow and fast codon positions in translation elongation. d Enrichment of optimal codon types in codon positions showing the lowest 1% gmRC values (zero-RPF covered codons were excluded). The two-sided χ² test was used to compute the P-value in each sample. e Enrichment of nonoptimal codon types in codon positions showing the highest 1% gmRC values (zero-RPF covered codons were excluded). The two-sided χ² test was used to compute the P-value in each sample. f Distribution of ΔgmRC (the median gmRC value of nonoptimal codons minus that of optimal codons) for each gene in 12–24 h embryos (zero-RPF covered codon positions were excluded). The P-value was calculated using a one-sided Wilcoxon signed-rank test. A total of 5794 genes are considered in the analysis. g Distribution of ΔgmRC for each gene in 12–24 h embryos (zero-RPF covered codon positions were retained). The P-value was calculated using a one-sided Wilcoxon signed-rank test. A total of 5794 genes are considered in the analysis. Source data are provided as a Source Data file.
Fig. 5
Fig. 5. Positive selection of synonymous mutations altering codon usage frequency in Drosophila.
a, b Proportions (α) of positively selected synonymous mutations that have become fixed in the D. melanogaster lineage after diverging from D. simulans. The plot displays the median values (points) and their corresponding 95% confidence intervals (error bars) for α. Genes were categorized into three groups based on their median expression levels. α values from each bar are computed from 100 derived allele frequency values (as bin centers) and the pN and pS values in their corresponding bin. It is important to note that using total short introns as a neutral control will yield different α values compared to using short introns from genes within corresponding expression categories. c Derived allele frequencies (DAF) of synonymous mutations associated with codon optimization or deoptimization in the DGRP2 D. melanogaster data. Codon-optimizing mutations (red) exhibited significantly higher DAF than neutral controls (mutations on short introns, gray) in genes with different expression levels. Conversely, codon-deoptimizing mutations (blue) showed significantly lower DAF compared to neutral controls. The P-value was calculated using a two-sided Wilcoxon rank-sum test. Source data are provided as a Source Data file.

Similar articles

Cited by

References

    1. Kramer, E. B. & Farabaugh, P. J. The frequency of translational misreading errors in E. coli is largely determined by tRNA competition. RNA13, 87–96 (2007). - PMC - PubMed
    1. Parker, J. Errors and alternatives in reading the universal genetic code. Microbiol. Rev.53, 273–298 (1989). - PMC - PubMed
    1. Schwartz, M. H. & Pan, T. Function and origin of mistranslation in distinct cellular contexts. Crit. Rev. Biochem. Mol. Biol.52, 205–219 (2017). - PMC - PubMed
    1. Schwartz, M. H. & Pan, T. Temperature dependent mistranslation in a hyperthermophile adapts proteins to lower temperatures. Nucleic Acids Res.44, 294–303 (2016). - PMC - PubMed
    1. Whitehead, D. J., Wilke, C. O., Vernazobres, D. & Bornberg-Bauer, E. The look-ahead effect of phenotypic mutations. Biol. Direct3, 18 (2008). - PMC - PubMed

Publication types

LinkOut - more resources