Clinical Trial
. 2024 Sep 27;15(1):8309.
doi: 10.1038/s41467-024-52503-2.

Histone marks identify novel transcription factors that parse CAR-T subset-of-origin, clinical potential and expansion

Affiliations
Clinical Trial

Histone marks identify novel transcription factors that parse CAR-T subset-of-origin, clinical potential and expansion

S Fiorenza et al. Nat Commun. .

Abstract

Chimeric antigen receptor-modified T cell (CAR-T) immunotherapy has revolutionised blood cancer treatment. Parsing the genetic underpinnings of T cell quality and CAR-T efficacy is challenging. Transcriptomics inform CAR-T state, but the nature of dynamic transcription during activation hinders identification of transiently or minimally expressed genes, such as transcription factors, and over-emphasises effector and metabolism genes. Here we explore whether analyses of transcriptionally repressive and permissive histone methylation marks describe CAR-T cell functional states and therapeutic potential beyond transcriptomic analyses. Histone mark analyses improve identification of differences between naïve, central memory, and effector memory CD8 + T cell subsets of human origin, and CAR-T derived from these subsets. We find important differences between CAR-T manufactured from central memory cells of healthy donors and of patients. By examining CAR-T products from a clinical trial in lymphoma (NCT01865617), we find a novel association between the activity of the transcription factor KLF7 with in vivo CAR-T accumulation in patients and demonstrate that over-expression of KLF7 increases in vitro CAR-T proliferation and IL-2 production. In conclusion, histone marks provide a rich dataset for identification of functionally relevant genes not apparent by transcriptomics.


Conflict of interest statement

S.F. has filed and received license fees on patents for optimising CAR T cell function, has received research laboratory grants from Bristol Myers Squibb, and has consulted ad hoc for Prescient Therapeutics. E.L.K. receives research support from Juno Therapeutics, a BMS company. A.S.S. is a current employee of Umoja Biopharma. A.V.H. has received research funding from Juno Therapeutics, a Bristol Myers Squibb Company, and Nektar Therapeutics; it has received honoraria from Bristol Myers Squibb. J.G. reports honoraria from EUSA Pharma, JMP, Larvol, and Multerra Bio; serves on scientific advisory boards for Legend Biotech, Janssen, Kite (a Gilead company), and MorphoSys; and receives research funding from Sobi, Juno Therapeutics, Celgene (a BMS company), and Angiocrine Bioscience. S.R.R. is a cofounder and adviser to Lyell Immunopharma; has research funding from and intellectual property licensed to Lyell Immunopharma; was a cofounder of Juno Therapeutics; is an inventor of patents licensed to Juno Therapeutics; and served as an adviser to Juno Therapeutics and Adaptive Biotechnologies. D.G.M. has received research funding from Juno Therapeutics, a Bristol Myers Squibb Company, Celgene, and Kite Pharma, a Gilead company; has served on ad hoc advisory board meetings from Amgen, BMS, Genentech, Gilead, Incyte, Janssen, Legend Biotech, Mustang Bio, MorphoSys, Novartis, Pharmacyclics, and Umoja; has rights to receive royalties from Fred Hutch for patents licensed to Juno Therapeutics; serves on scientific advisory board with stock options and compensations for A2 Biotherapeutics and Navan Technologies. S.H. has filed patent applications on related work. C.J.T. received research funding from Juno Therapeutics/BMS, Nektar Therapeutics, and Nanostring; serves on Scientific Advisory Boards for Caribou Biosciences, T-CURX, Myeloid Therapeutics, ArsenalBio, Cargo Therapeutics, Celgene/BMS Cell Therapy, Differentia Bio, eGlint, and Advesya; is a DSMB member for Kyverna; has served on ad hoc advisory roles/consulting (last 12 months) for Prescient Therapeutics, Century Therapeutics, IGM Biosciences, Abbvie, Boxer Capital, Novartis; holds stock options for Eureka Therapeutics, Caribou Biosciences, Myeloid Therapeutics, ArsenalBio, Cargo Therapeutics, and eGlint; and has the right to receive payment from Fred Hutch Cancer Center as an inventor on patents related to CAR T-cell therapy. The remaining authors declare no competing interest.

Figures

Fig. 1
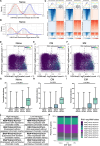
Fig. 1. Epigenomic analyses highlight greater differences between CD8 + T cell subsets than transcriptomic approaches.
A Histogram (top row) of average log-normalised count of sequenced DNA bound to H3K4me2 (left column for each subset) or H3K27me3 (right column for each subset) within ±1 kb of the transcriptional start site (TSS). Tornado plots (second row) of CD8 + T cell subsets (naïve, N, left; central memory, CM, middle; effector memory, EM, right) depict the relationship between transcriptome abundance and histone marks. Each line represents a genomic region within ±1 kb of the TSS for an annotated gene. The genes in rows are ordered by transcript abundance by RNA-seq from high (top) to low (bottom). The heatmap is coloured by the intensity of H3K4me2 or H3K27me3 marks (histone marks) assessed by Cleavage Under Targets and Restriction Using Nuclease (CUT&RUN). H3K4me2 and H3K27me3 marks show a direct and inverse relationship with transcript abundance, respectively. B, C. Numbers of differentially expressed (by RNA-seq) and differentially enriched (by CUT&RUN) genes (B) and transcription factors (C) when comparing CD8 + T cell subsets. Genes assigned to peaks ± 1 kb of the transcriptional start site (TSS), each NCBI annotated gene counted only once (adjusted P value < 0.05 and Log2 fold change (LogFC) ≥ 1). D Principal component analyses (PCA) and (E) Uniform Manifold Approximation and Projection (UMAP) of RNA-seq (left) and H3K27me3 (middle left), H3K4me2 (middle right), and H3K27me3 and H3K4me2 (right) histone mark analyses show a distinction between CD8 + T cell subsets by histone marks that is less apparent by RNA-seq.
Fig. 2
Fig. 2. Diverse patterns of histone mark patterns and transcript abundance can be identified in CD8 + T cell subsets.
A, B Histogram of two-component Gaussian mixture model (GMM) to characterise distribution of H3K27me3- and H3K4me2-bound sequenced DNA reads from naïve CD8 + T cells within 10 kb of transcriptional start site (TSS). A bimodal distribution of read intensity is noted and modelled by GMM with negative reads depicted in red and positive reads depicted in blue. The nadir of the distributions is represented by the dashed line, providing a positive and negative cut-off used to integrate epigenomic and transcriptomics analyses in subsequent figures. Identical cut-offs were seen with central memory (CM) and effector memory (EM) cells (see Supplementary Fig. 10). C Histogram (top row) of average log-normalised counts of genes that are deemed positive, negative and bivalent for H3K4me2- and H3K27me3-specific reads across subsets. Individual genes, single- or bivalent for each subset, are shown in tornado plots below, ordered and coloured by intensity of counts. DF Three-dimensional scatter plots of naïve, CM, and EM CD8 + T cells. Each plot shows H3K27me3 (y-axis) and H3K4me2 (x-axis) histone mark enrichment signals for single annotated genetic regions, each region being represented by a single point; transcript abundance (by RNA-seq) is denoted by the colour of each point, as shown in the legend. Quadrants are constructed using the nadir of bimodal histograms of each histone mark as per A. GI Mean total transcript level +/- SD for all genes (overlayed as data points) with different patterns of H3K27me3 (K27m3) and H3K4me2 (K4m2) histone marks in CD8 + T cell subsets. ****P value < 0.0001 by one-way ANOVA with a significant linear trend. J Four patterns of H3K4me2 and H3K27me3 histone marks in both low and high transcript abundance states are shown. K Percent annotated genes in CD8 + T cell subsets within each RNA-seq/histone methylation mark (HMM) pattern.
Fig. 3
Fig. 3. Changes in histone mark patterns between CD8 + T cell subsets occur in high transcript abundance genes without changes in transcript.
A Heatmaps summarising the number of genes that occur within each histone mark pattern (H3K4me2 = K4m2; H3K27me3 = K27m3) when comparing a less differentiated cell type (x axis) to a more differentiated cell type (y axis) for naïve vs central memory (CM), CM vs effector memory (EM), and naïve vs EM. Most genes tend to maintain RNAhi or RNAlo status and the same histone mark pattern between subsets. The number of genes is indicated by the colour-coding (maximum depicted colour-coded count, 500 genes). B, C. Sub-analyses of the heatmap from the top left corner of each comparative heatmap in A comparing a less differentiated cell type to a more differentiated cell type for naïve vs CM, CM vs EM and naïve vs EM. These analyses include RNAhi genes that do not (B) or do (C) show a significant change in transcript expression by limma (LogFC > 1, adjusted P < 0.05 by Benjamini-Hochberg procedure) between compared subsets. Genes on the diagonal (top left to bottom right of each plot) do not change histone mark pattern between subsets. Genes within red boxes show changes in histone mark patterns that indicate enrichment in the more differentiated cell types. Genes within white boxes show changes in histone mark patterns that indicate enrichment in the less differentiated cell types. Most genes that change histone mark patterns between subsets are not identified by differential gene expression analyses of RNA-seq data (compare B to C).
Fig. 4
Fig. 4. Transitional states in histone mark patterns improve subset identification by RNA-seq and reveal genes associated with T cell differentiation that are not differentially expressed.
A Stacked bar plots of the percent of all RNAhi genes within each histone mark pattern (H3K4me2 = K4m2; H3K27me3 = K27m3) in which relative transcript level is either increased in a more differentiated cell-type (“Up”), increased in a less differentiated cell-type (“Down”) or not differentially expressed (“notDE”) by limma. B PCA plots of transcript from RNAhi genes subsetted by the histone mark pattern. The plots demonstrate that transcript differences in the H3K4me2+H3K27me3+ pattern identify differences between resting naïve, central memory (CM) and effector memory (CM) cells that are not apparent with RNA-seq alone (compare to Fig. 1D). C Median LogFC in transcript in RNAhi genes (when the number of genes in each pattern ≥ 3) between histone mark patterns when comparing a less differentiated cell type (x axis) to a more differentiated cell type (y axis) for naïve vs CM, CM vs EM and naïve vs EM. Red boxes represent changes in histone mark patterns that represent a shift towards a more differentiated cell type as evidenced by positive (“Up”) median LogFC in transcript. White boxes represent changes in histone mark patterns that represent a shift towards a less differentiated cell type as evidenced by negative (“Down”) median LogFC in transcript. Grey indicates the number of genes in an individual pattern is < 3. D MA plot of genes with a CM to EM histone mark pattern (red box, CM vs EM heatmap, Fig. 3B) and genes DEx by RNA-seq (in red). Genes with a known association with effector-directed differentiation are named. E. MA plot of genes with an EM to CM histone mark pattern (white box, CM vs EM heatmap, Fig. 3B) and genes DEx by RNA-seq (in red). Genes with a known association with memory-directed differentiation and quiescence are named.
Fig. 5
Fig. 5. Histone mark analyses uncover differences in transcription factors in CAR-T manufactured from distinct starting cell subsets that are not detected by RNA-seq.
A PCA plots of RNA-seq, H3K27me3, or H3K4me2 of CAR-T manufactured from healthy donors (HD) CD8+ naïve-, central memory (CM)- or effector memory (EM)-derived CAR-T. B Venn diagram showing numbers of differentially expressed (DEx by RNA-seq) or differentially enriched (DEn by H3K4me2 or H3K27me3) genes when comparing naïve-, CM- and EM-derived CAR-T. C Volcano plot of -log(adjusted P value by Benjamini-Hochberg procedure) of transcript (left panel), H3K4me2 (middle panel) or H3K27me3 (right panel) vs logFC. DEx/DEn genes are denoted purple for expressed/enriched in CM-derived CAR-T, or green for expressed/enriched in EM-derived CAR-T. Labelled genes are those DEx from a recently published analysis comparing healthy donor ex vivo isolated CM and EM cells by RNA-seq. D, E Mean scaled H3K4me2 (D) and H3K27me3 (E) +/- SD signal +1 of transcription factors (TF) genes differentially enriched in CM- and EM-derived CAR-T. Shown is adjusted P value by Benjamini-Hochberg procedure.
Fig. 6
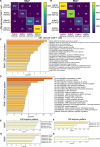
Fig. 6. Analyses of changes in histone mark patterns between CM- and EM-derived CAR-T reveal potential regulators of differences between CAR-T types that are not apparent from the transcriptome.
A, B Heatmaps of the numbers of genes within each histone mark pattern (H3K4me2 = K4m2; H3K27me3 = K27m3) when comparing central memory (CM)- and effector memory (EM)-derived CAR-T within RNAhi (A) and RNAlo (B) genes. C, D Comprehensive gene ontology analysis by Metascape.org of RNAhi genes with histone mark patterns indicative of EM-derived CAR-T (C, red box in A) or histone mark patterns indicative of CM-derived CAR-T (D, white box in A). EH TRRUST analysis from Metascape.org denoting transcription factors and DNA binding proteins that regulate RNAhi (E & F) and RNAlo (G & H) genes within histone mark patterns indicative of EM-derived CAR-T (E & G) or CM-derived CAR-T (F & H). Displayed P value adjusted by Benjamini-Hochberg procedure.
Fig. 7
Fig. 7. Comparison of histone marks from CM-derived CAR-T from healthy donors and CM-enriched CAR-T from patients reveals exhaustion-associated transcription factors not seen by transcriptomic approaches.
A PCA plots of RNA-seq, H3K27me3 or H3K4me2 marks of CAR-T manufactured from healthy donor (HD) central memory (CM)-derived and patient (PT) CM-derived CD8 + T cells. B Numbers of differentially expressed (DEx by RNA-seq) or enriched (DEn by H3K4me2 or H3K27me3) genes when HD CM-derived CAR-T are compared to patient CM-derived CAR-T. C Volcano plot of -log(adjusted P value by Benjamini-Hochberg procedure) in transcript (left panel) or H3K4me2 (middle panel) or H3K27me3 (right panel) signal vs log(fold-change, FC). DEx/DEn genes are denoted purple for HD CM-derived CAR-T, or peach for patient CM-enriched CAR-T. Named genes are transcription factors (TFs) that are DEx/DEn in each analysis. D, E Mean scaled RNA transcript (D), H3K4me2 (E) and H3K27me3 (F) +/- SD signal +1 of exhaustion resistance-associated TF genes differentially expressed or enriched in patient and HD CM-derived CAR-T. Shown is adjusted P value by Benjamini-Hochberg procedure.
Fig. 8
Fig. 8. Epigenomic marks in LBCL patient CM-derived CAR-T associated with in vivo accumulation of CAR-T after adoptive transfer.
A PCA plots of RNA-seq, H3K27me3 or H3K4me2 histone marks of CAR-T manufactured from central memory (CM)-enriched CD8 + T cells from LBCL patients who achieved CR after CD19-targeted CAR-T immunotherapy (NCT01865617) and showed peak of expansion below the median (red, Low_Expander) or above the median (blue, High_Expander). B Number of differentially expressed (DEx, by limma, LogFC >1, adjusted P < 0.1 by Benjamini-Hochberg procedure) or enriched (DEn, by H3K4me2 and H3K27me3 histone marks, LogFC > 1, adjusted P < 0.1 by Benjamini-Hochberg procedure) genes when comparing Low_Expander and High_Expander. C Volcano plot of -log(adjusted P value by Benjamini-Hochberg procedure) in transcript (left panel) or H3K4me2 (middle panel) or H3K27me3 (right panel) signal vs logFC. Red points indicate genes enriched in low expanding CAR-T and blue points indicate genes enriched in high expanding CAR-T. D-F. Mean scaled KLF7 (D), H3K27me3 (E) and H3K4me2 (F) +/- SD signal +1 of KLF7 target genes in high- vs low-expanding CM-derived patient CAR-T. Shown is adjusted P value by Benjamini-Hochberg procedure. G Mean fold change +/- SD in accumulation of KLF7_P2A_GFP- and control P2A_GFP-lentiviral transduced T cells at increasing viral volumes. n = 5 donors; P values by two-way ANOVA with post-hoc Tukey correction. H Mean change +/- SD in geometric mean fluorescence intensity (geoMFI) of CellTrace Violet (CTV) as an inverse measure of CAR-T proliferation with and without KLF7 co-transduction when exposed to CD19-negative K562 cells. n = 2 donors in technical duplicate, P value by two-way ANOVA with post-hoc Tukey correction. I Mean frequency and 95% confidence intervals (dotted lines) of CD45RA- CCR7+ phenotype cells in CD19-directed CAR-T with and without KLF7 co-transduction. n = 3 donors performed as technical duplicate, P value by two-tailed t test. J Promoter region of IL2 in the human genome and predicted upstream KLF7 binding site. K Mean frequency and 95% confidence intervals (dotted lines) of IL-2 expressing CAR-T by intracellular cytokine staining with and without KLF7 co-transduction when exposed to CD19-negative K562 cells. n = 3 donors performed as technical duplicate, P value by two-tailed t test.

References

    1. Henning, A. N., Roychoudhuri, R. & Restifo, N. P. Epigenetic control of CD8(+) T cell differentiation. Nat. Rev. Immunol.18, 340–356 (2018). - PMC - PubMed
    1. Gauthier, J. et al. Feasibility and efficacy of CD19-targeted CAR T cells with concurrent ibrutinib for CLL after ibrutinib failure. Blood135, 1650–1660 (2020). - PMC - PubMed
    1. Chen, G. M. et al. Integrative bulk and single-cell profiling of premanufacture T-cell populations reveals factors mediating long-term persistence of CAR T-cell therapy. Cancer Discov.11, 2186–2199 (2021). - PMC - PubMed
    1. Fraietta, J. A. et al. Determinants of response and resistance to CD19 chimeric antigen receptor (CAR) T cell therapy of chronic lymphocytic leukemia. Nat. Med.24, 563–571 (2018). - PMC - PubMed
    1. Sommermeyer, D. et al. Chimeric antigen receptor-modified T cells derived from defined CD8+ and CD4+ subsets confer superior antitumor reactivity in vivo. Leukemia30, 492–500 (2016). - PMC - PubMed

Publication types

MeSH terms

Associated data