. 2024 Sep 27;15(1):8352.
doi: 10.1038/s41467-024-52620-y.

Potent pollen gene regulation by DNA glycosylases in maize

Affiliations

Potent pollen gene regulation by DNA glycosylases in maize

Yibing Zeng et al. Nat Commun. .

Abstract

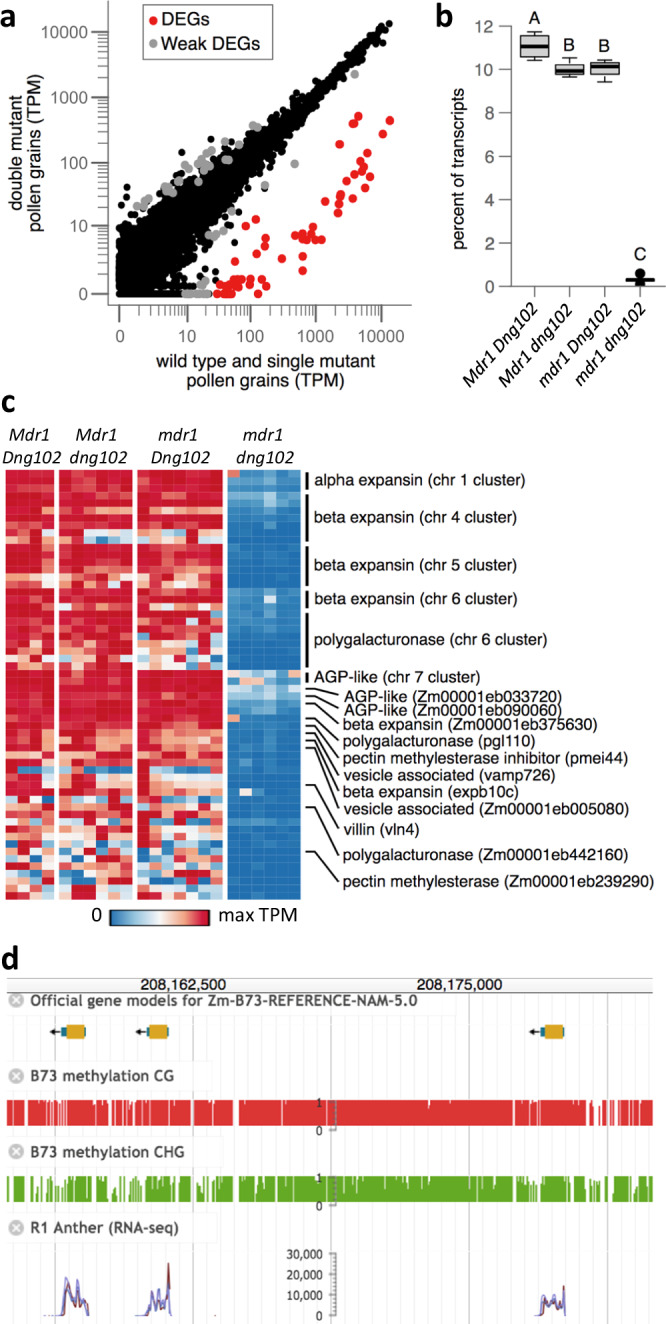
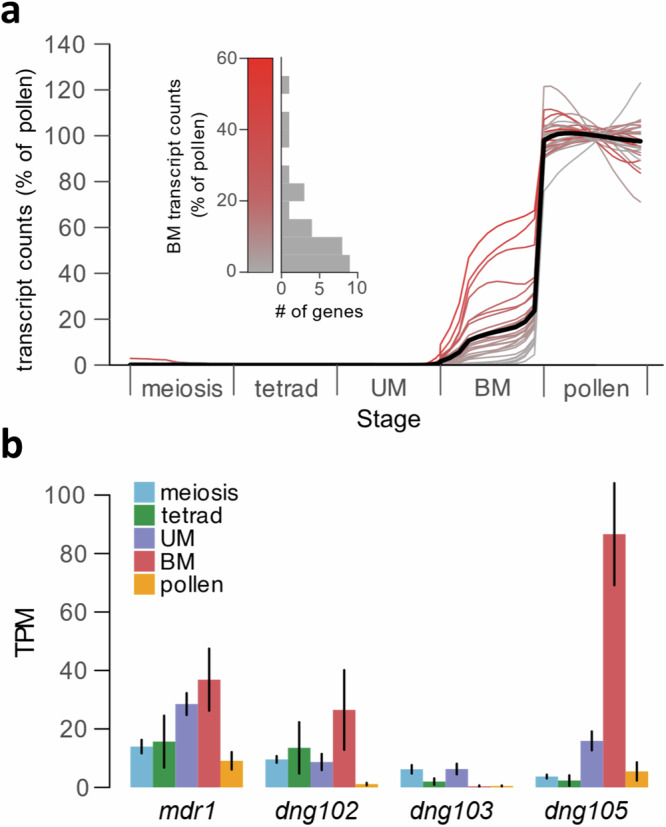
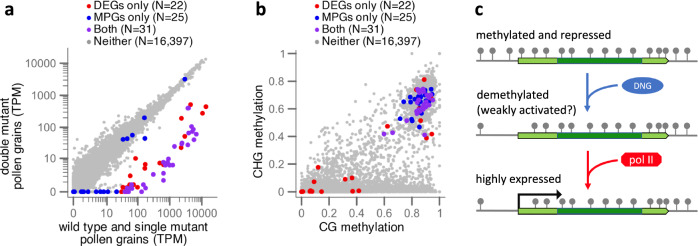
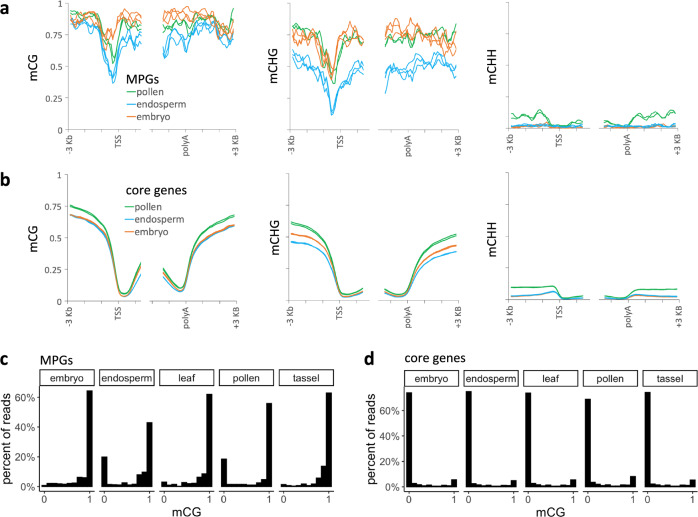
Although DNA methylation primarily represses TEs, it also represses select genes that are methylated in plant body tissues but demethylated by DNA glycosylases (DNGs) in endosperm or pollen. Either one of two DNGs, MATERNAL DEREPRESSION OF R1 (MDR1) or DNG102, is essential for pollen viability in maize. Using single-pollen mRNA sequencing on pollen-segregating mutations in both genes, we identify 58 candidate DNG target genes that account for 11.1% of the wild-type transcriptome but are silent or barely detectable in other tissues. They are unusual in their tendency to lack introns but even more so in their TE-like methylation (teM) in coding DNA. The majority have predicted functions in cell wall modification, and they likely support the rapid tip growth characteristic of pollen tubes. These results suggest a critical role for DNA methylation and demethylation in regulating maize genes with the potential for extremely high expression in pollen but constitutive silencing elsewhere.


Conflict of interest statement

The authors declare no competing interests.

Figures

Fig. 1
Fig. 1. Evidence for DNG function in pollen and summary of experimental approach.
a Expression of genes with teM in anther and tassel. The X-axis indicates the number of genes in each of the ten tissues of ref. which have teM and TPM values of at least 100. This analysis only includes high-confidence genes defined as genes that do not overlap with TE annotations and are part of the “core gene” set. b Top panel, pollen from an mdr1 /Mdr1 dng102/Dng102 double heterozygous plant, segregating four haploid genotypes. The bottom panels show large and small pollen grains from a representative plant. Pollen from all six double heterozygous plants imaged exhibited a small pollen (sp) phenotype (Supplementary Fig. 2). Size bar = 100 μm. c Schematic of single-pollen mRNA-seq method. Individual libraries were prepared and sequenced for each pollen grain. Capital indicates WT allele, lowercase mutant, red double mutant. d Unsupervised clustering of single-pollen transcriptomes based on Pearson correlation across the entire dataset (all by all). Warmer colors indicate stronger correlations between transcriptomes. The top two rows indicate mdr1 and dng102 genotypes inferred from SNPs linked to the two loci derived from RNA-seq data, which were scored independently of the transcriptome correlation analysis. Genotypes: black is mutant, light gray is wild-type, and dark gray is ambiguous.
Fig. 2
Fig. 2. Identification of candidate DNG target genes.
a WT and single mutant vs double mutant gene expression. Dots correspond to individual genes. Axes indicate mean TPM values for each set of transcriptomes. The strong DEGs (red dots) have ≥8-fold change in expression in double mutant and an average of ≥10 UMIs in the WT and single mutant. An additional 48 genes (weak DEGs, gray dots) showed evidence of differential expression by less stringent criteria (adjusted p-value ≤ 0.05; ≥2-fold change in expression). Raw (unadjusted) p-values were calculated using DESeq2 and then adjusted for multiple hypothesis testing using Holm’s method. b Total expression of the 58 DEGs as a percent of all measured transcripts. Boxplots indicate the median (horizontal dark line), interquartile range (box), and range (vertical lines) of the measured values. Letters indicate statistical significance: groups not sharing a letter have a significantly different mean (p ≤ 0.05; Tukey’s honest significant difference test). See “Statistics and reproducibility” in the “Methods” section for individual p-values. c Expression patterns of DEGs in each pollen grain. Each row represents a single gene, and each column a pollen grain, organized by genotype. Rows are sorted by chromosome, position, and TPM, with genes in clusters listed above singletons. d MaizeGDB browser image of an approximately 30 Kb part of a beta expansin gene cluster on chromosome 5. Included are publicly available DNA methylation tracks and anther gene expression tracks.
Fig. 3
Fig. 3. Expression time course of DNGs and targets.
a Expression timecourse of DEGs. The bold line represents the average expression profile across all DEGs. UM unicellular microspore, BM bicellular microspore. Data are from B73/A188 hybrids, normalized to the mean transcript abundance in pollen. The time course spans 349 pollen grains and precursors, here reported as a rolling weighted average by pollen precursor stage (see “Methods”); a heatmap without averaging is visible in Supplementary Fig. 6. The variation seen in mature pollen for two genes in particular is consistent with random noise and not statistically significant. Gray to red color scale indicates the expression level at the bicellular stage, as quantified in the inset. b Expression timecourse of the four maize DNGs mdr1, dng102, dng103, and dng105 using the same data as in (a). Low expression of these genes makes them unsuitable for the graphical representation used in (a). Instead, bar heights indicate average TPM values from individual pollen and pollen precursors, and error bars indicate standard errors. N = 119, 22, 175, 11, and 15 single cells or pollen grains for meiosis, tetrad, UM, BM, and pollen, respectively.
Fig. 4
Fig. 4. Synthesis of methylation and transcriptome-based results.
a The teM character mapped onto the differential expression analysis comparing WT and single mutant vs double mutant gene expression. Axes indicate the mean TPM values for each set of transcriptomes. MPGs have teM and at least tenfold higher expression in anther than in eight vegetative tissues in B73. Only core genes that are annotated in the W22 genome and in all 26 of the NAM founder genomes and which have sufficient coverage of EM-seq reads were included in this analysis. b mCG vs mCHG for the same sets of genes displayed in (a). Methylation values are measured in CDS only, as a proportion of methylated cytosines to total cytosines, and range from 0 to 1. c A model for DNA methylation in pollen gene regulation, requiring an initial licensing step by DNGs removing methylation (gray lollipops), before transcription at high levels via gene-specific activating factors (not shown) recruiting RNA polymerase II.
Fig. 5
Fig. 5. DNA demethylation in pollen and endosperm.
a Metagene methylation profile for MPGs in the W22 genome. These are the 44 of 56 MPGs present in both the W22 and B73 genome annotations. Profiles are centered on transcription start sites and polyadenylation sites (polyA). Values are derived from 100-bp intervals, but the curves were smoothed using moving averages over three 100-bp intervals. Each biological replicate is shown separately (two for pollen, three for endosperm and embryo). b Same as (a) except all core genes were included in the analysis. Core genes are annotated at syntenic positions in W22, B73, and the 25 other NAM founder genomes. c Single-read mCG calls from MPG promoters. Only genes with EM-seq coverage from W22 leaf and mCG values of at least 0.4 in the first 100 bp of their promoters are included. Only pollen and endosperm had a distribution of mCG values that differed significantly from leaf (p-value < 0.00005, two-sample Kolmogorov–Smirnov test). d Single-read mCG calls from core gene promoters.

Update of

References

    1. Hafidh, S. & Honys, D. Reproduction multitasking: the male gametophyte. Annu. Rev. Plant Biol.72, 581–614 (2021). - PubMed
    1. Adhikari, P. B., Liu, X. & Kasahara, R. D. Mechanics of pollen tube elongation: a perspective. Front. Plant Sci.11, 589712 (2020). - PMC - PubMed
    1. Flores-Tornero, M. et al. Comparative analyses of angiosperm secretomes identify apoplastic pollen tube functions and novel secreted peptides. Plant Reprod.34, 47–60 (2021). - PMC - PubMed
    1. Shi, J., Cui, M., Yang, L., Kim, Y. J. & Zhang, D. Genetic and biochemical mechanisms of pollen wall development. Trends Plant Sci.20, 741–753 (2015). - PubMed
    1. Miller, E. C. Development of the pistillate spikelet and fertilization in Zea mays L. J. Agric. Res.18, 12 (1919).

Publication types

LinkOut - more resources