. 2024 Sep 27;15(1):8315.
doi: 10.1038/s41467-024-52450-y.

Prophage-encoded antibiotic resistance genes are enriched in human-impacted environments

Affiliations

Prophage-encoded antibiotic resistance genes are enriched in human-impacted environments

Hanpeng Liao et al. Nat Commun. .

Abstract

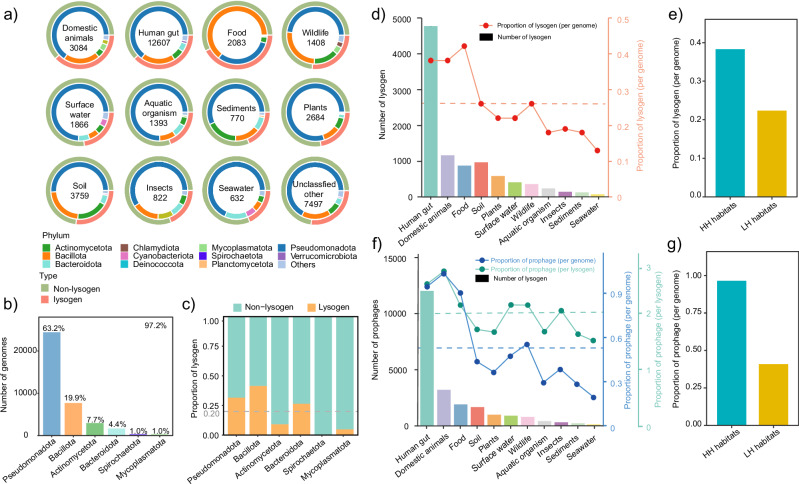
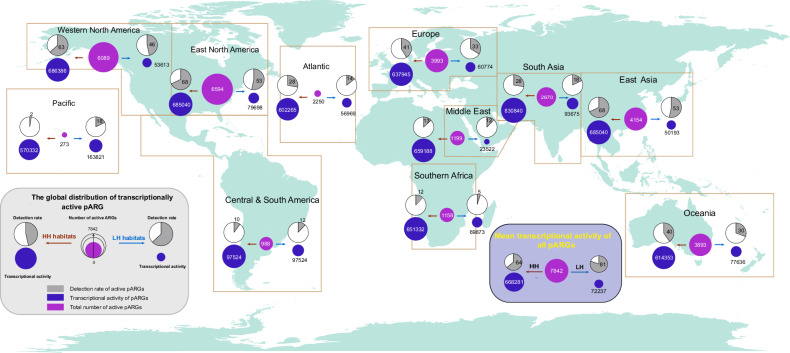
The spread of antibiotic resistance genes (ARGs) poses a substantial threat to human health. Phage-mediated transduction could exacerbate ARG transmission. While several case studies exist, it is yet unclear to what extent phages encode and mobilize ARGs at the global scale and whether human impacts play a role in this across different habitats. Here, we combine 38,605 bacterial genomes, 1432 metagenomes, and 1186 metatranscriptomes across 12 contrasting habitats to explore the distribution of prophages and their cargo ARGs in natural and human-impacted environments. Worldwide, we observe a significant increase in the abundance, diversity, and activity of prophage-encoded ARGs in human-impacted habitats linked with relatively higher risk of past antibiotic exposure. This effect was driven by phage-encoded cargo ARGs that could be mobilized to provide increased resistance in heterologous E. coli host for a subset of analyzed strains. Our findings suggest that human activities have altered bacteria-phage interactions, enriching ARGs in prophages and making ARGs more mobile across habitats globally.


Conflict of interest statement

The authors declare no competing interests.

Figures

Fig. 1
Fig. 1. Distribution of lysogens and prophages in different taxa across different habitats.
a The composition of bacterial isolates at phylum level (inner circle) and the proportion of lysogens (outer circle) in different habitats. The number in the center of circle, represent the number of bacterial genomes collected from different habitats. b The number of dominant bacterial genomes grouped by phylum across all habitats. c The proportion of dominant lysogens at phylum level across all habitats. d The number (bar plot) and proportion (line plot) of lysogenic bacteria isolated from different habitats. e The mean proportion of lysogenic bacteria between highly antibiotic exposure habitats (HH) and low antibiotic exposure habitats (LH). f The number (bar plot) and proportion (line plot) of prophages in different habitats. g The mean proportion of genomes containing prophages between HH habitats and LH habitats. In (d) and (f), the dotted line represents the mean value across all habitats.
Fig. 2
Fig. 2. Prophage-encoded ARGs are more dominant in HH habitats impacted by humans.
a The number (bar plot) and proportion (line plot) of prophage-encoded ARGs in bacterial genomes isolated from different habitats. The dotted line represents the mean content of prophage-encoded ARGs across all habitats. b Changes in number of lysogens carrying prophage-encoded ARGs in highly antibiotic exposure habitats (HH, n = 2703) and low antibiotic-exposure habitats (LH, n = 383). c Changes in the mean content of ARGs in prophages per lysogen in both HH and LH habitats. d The distribution of individual prophage-encoded ARG subtypes among HH and LH habitats. In (b), the significant differences between two groups were analyzed based on nonparametric Wilcoxon test (p < 0.05, two-sided). Box plots encompass 25–75th percentiles, whiskers show the minimum and maximum values, and the midline shows the median.
Fig. 3
Fig. 3. Human activity facilitates the ARGs movement across habitats and taxa based on CRISPR spacers matching.
a Sankey plot depicting association of original hosts of prophages with the predicted hosts identified by CRISPR spacer matching across different habitats and host taxa at phylum level. One small grid represents one virus-bacterium pair, while different colors show the phylum of lysogen. b The distribution and proportion of prophage hosts between highly antibiotic-exposure habitats (HH) and low antibiotic-exposure habitats (LH). c The distribution and proportion of prophages with transmission potential between HH habitats and LH habitats. d The distribution and proportion of ARGs-carrying prophages between HH and LH habitats.
Fig. 4
Fig. 4. The global distribution and abundance of prophage-encoded ARGs (pARG) based on metagenomics across different environments.
a Global map shows the 1432 metagenomics sample sites across different habitats. b PCoA analysis showing the effects of habitats on the global distribution of pARGs based on distance dissimilarity. Non-parametric PERMANOVA (Adonis function, 999 permutations) was used to determine the significance of habitats on the pARGs composition. c The global abundance of pARGs from highly antibiotic exposure habitats (HH) and low antibiotic exposure habitats (LH) based on mapping of pARGs to metagenomic samples collected worldwide (except of ocean samples). The maps in the (c) were generated using ArcGIS Pro v3.0.2 software. d The global distribution patterns, based on prophage and corresponding host abundances, encompass all metagenomic samples worldwide. e The change in phage-host ratio (estimated using host and prophage abundances) between HH habitats (n = 2703) and LH habitats (n = 383) based on all metagenomic samples. In (d) and (e), asterisks indicate significant differences between different groups based on nonparametric Wilcoxon test (p < 0.05, two-sided). Box plots encompass 25–75th percentiles, whiskers show the minimum and maximum values, and the midline shows the median.
Fig. 5
Fig. 5. The global distribution of transcriptionally active prophage-encoded ARG (pARG) based on metatranscriptomes across different regions globally.
Metatranscriptomic sample location and individual regions are shown on the basemap. For each region, the circles in the center refer to the total number of pARGs with transcriptional activity across HH and LH habitats. To the left and right, the circles show the relative changes in the detection rate of active pARGs (upper circle) and their relatively transcriptional activity (lower circle) from highly antibiotic exposure habitats (HH) habitats and low antibiotic exposure habitats (LH), respectively.

References

    1. Chevallereau, A., Pons, B. J., van Houte, S. & Westra, E. R. Interactions between bacterial and phage communities in natural environments. Nat. Rev. Microbiol.20, 49–62 (2022). - PubMed
    1. Schulz, F. et al. Giant virus diversity and host interactions through global metagenomics. Nature578, 432–436 (2020). - PMC - PubMed
    1. Jansson, J. K. & Wu, R. Soil viral diversity, ecology, and climate change. Nat. Rev. Microbiol.21, 296–311 (2022). - PubMed
    1. Yi, Y. et al. A systematic analysis of marine lysogens and proviruses. Nat. Commun.14, 6013 (2023). - PMC - PubMed
    1. Tang, X. et al. Lysogenic bacteriophages encoding arsenic resistance determinants promote bacterial community adaptation to arsenic toxicity. ISME J.17, 1104–1115 (2023). - PMC - PubMed

Publication types

Substances