. 2024 Sep 27;15(1):8388.
doi: 10.1038/s41467-024-52527-8.

The role of forkhead box M1-methionine adenosyltransferase 2 A/2B axis in liver inflammation and fibrosis

Affiliations

The role of forkhead box M1-methionine adenosyltransferase 2 A/2B axis in liver inflammation and fibrosis

Bing Yang et al. Nat Commun. .

Abstract

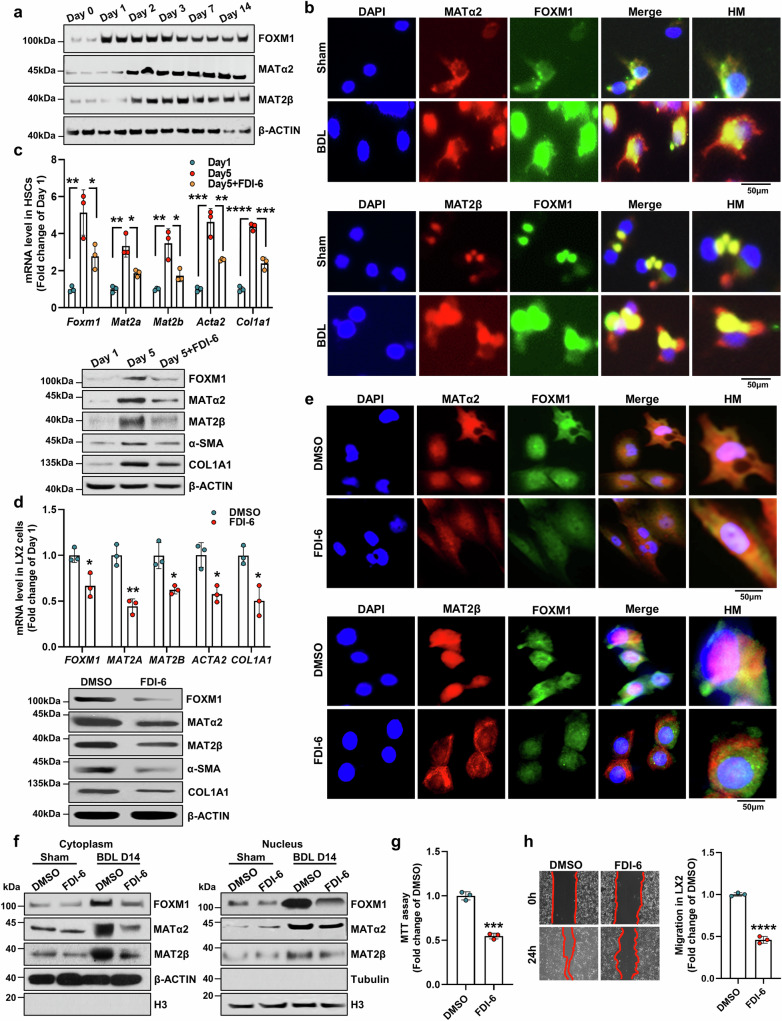
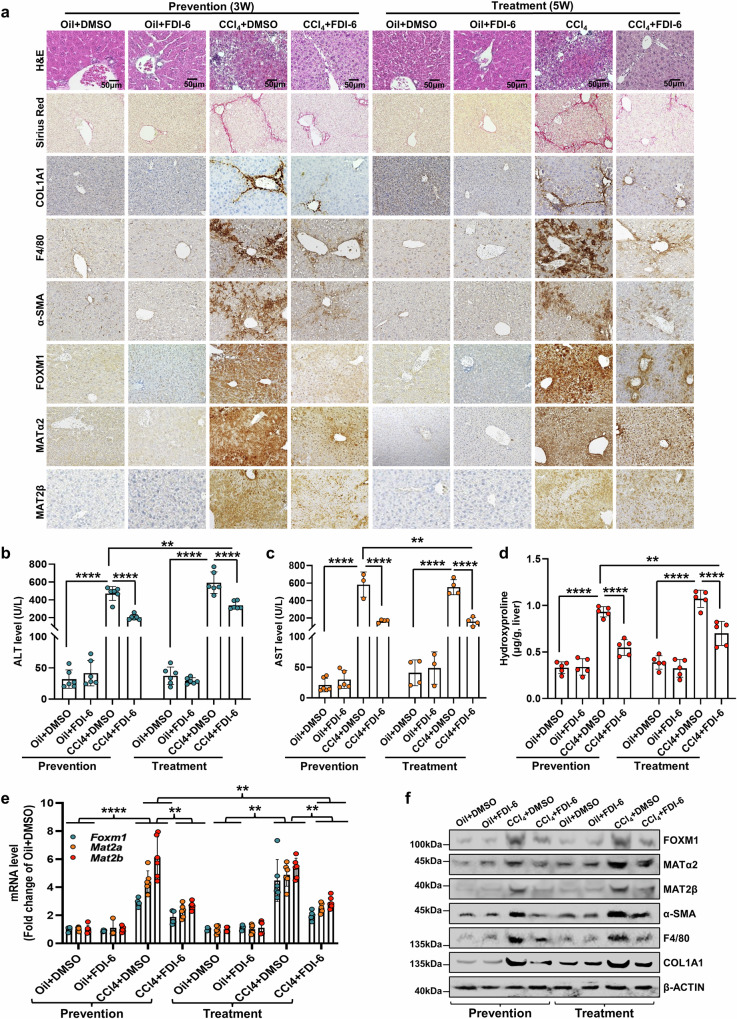
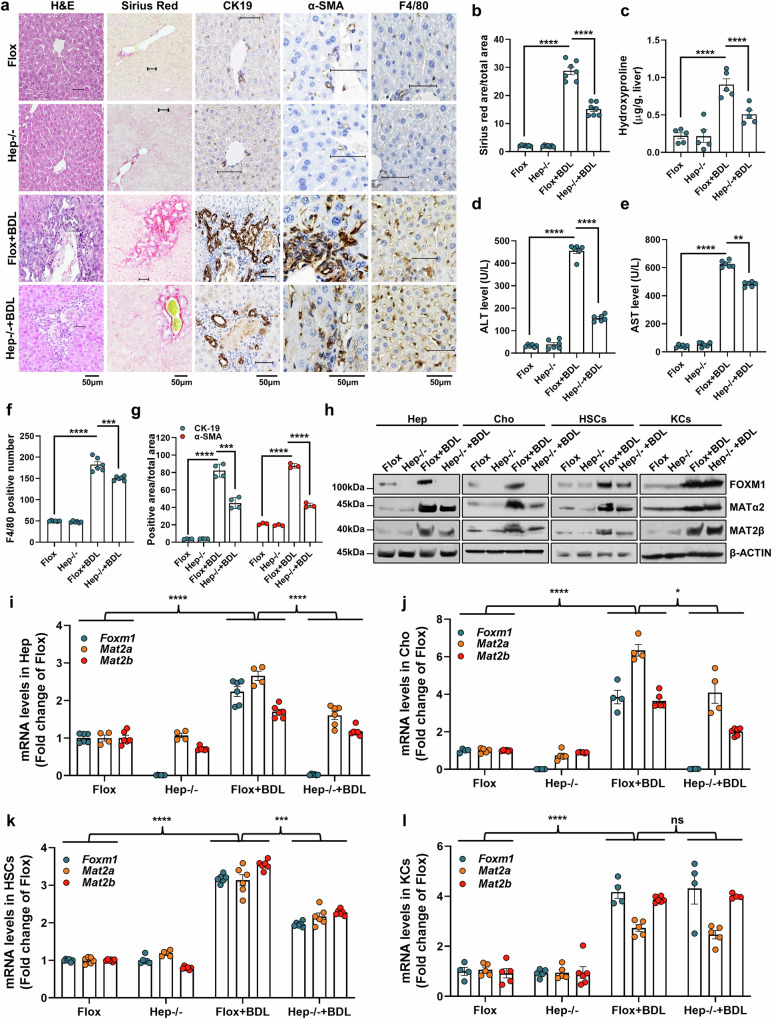
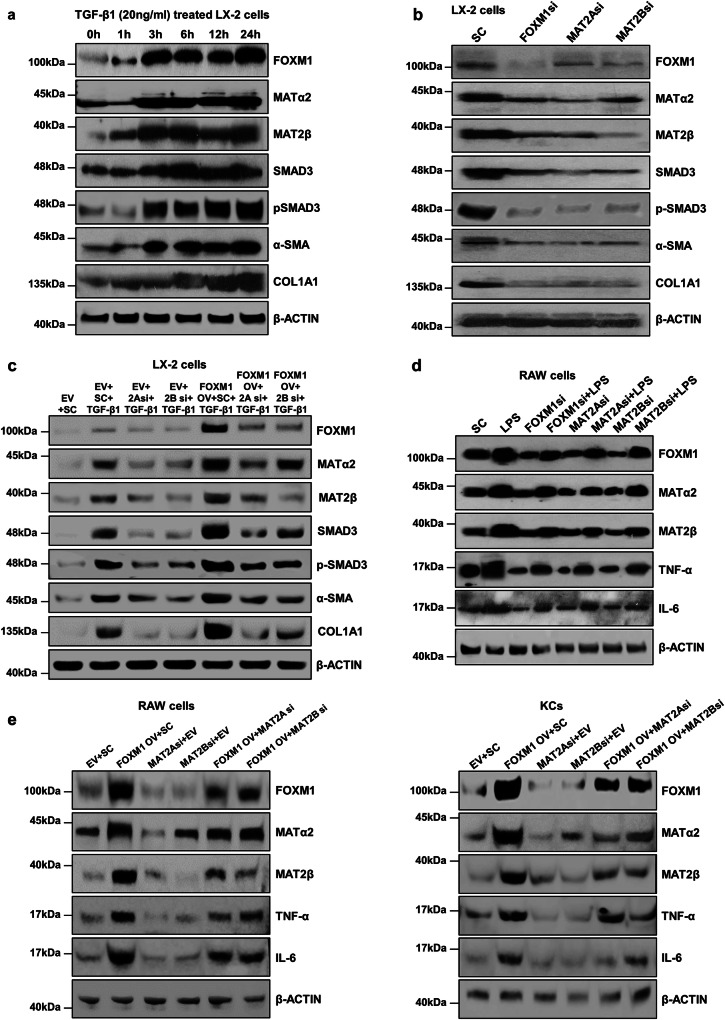
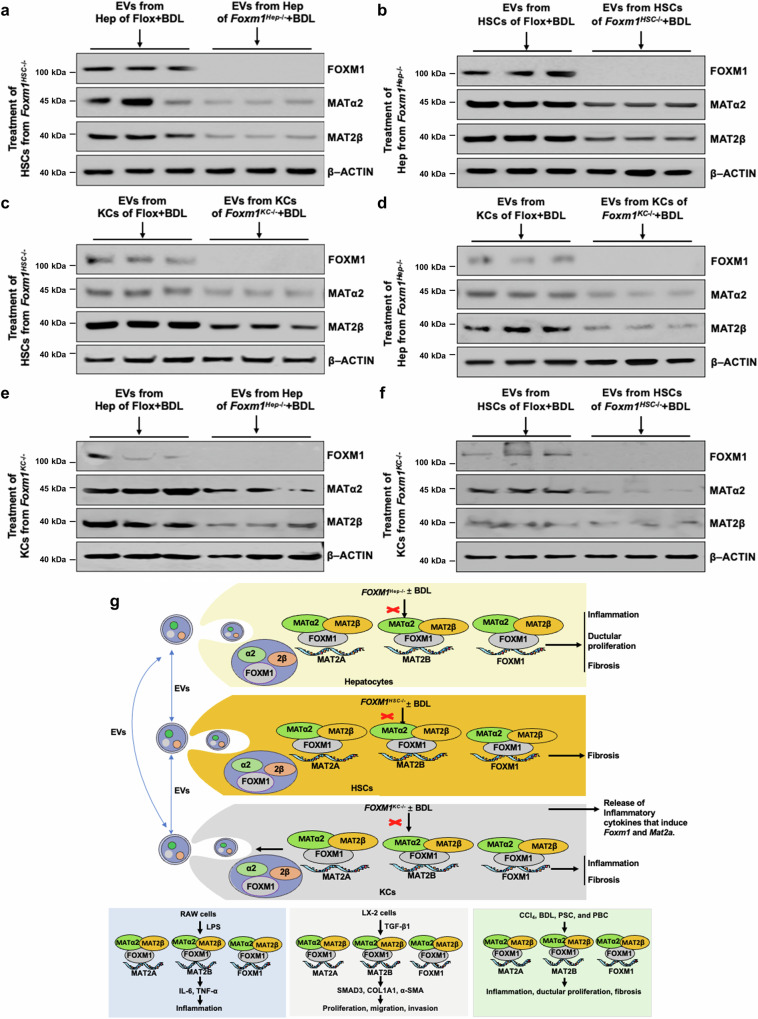
Methionine adenosyltransferase 2 A (MAT2A) and MAT2B are essential for hepatic stellate cells (HSCs) activation. Forkhead box M1 (FOXM1) transgenic mice develop liver inflammation and fibrosis. Here we examine if they crosstalk in male mice. We found FOXM1/MAT2A/2B are upregulated after bile duct ligation (BDL) and carbon tetrachloride (CCl4) treatment in hepatocytes, HSCs and Kupffer cells (KCs). FDI-6, a FOXM1 inhibitor, attenuates the development and reverses the progression of CCl4-induced fibrosis while lowering the expression of FOXM1/MAT2A/2B, which exert reciprocal positive regulation on each other transcriptionally. Knocking down any of them lowers HSCs and KCs activation. Deletion of FOXM1 in hepatocytes, HSCs, and KCs protects from BDL-mediated inflammation and fibrosis comparably. Interestingly, HSCs from Foxm1Hep-/-, hepatocytes from Foxm1HSC-/-, and HSCs and hepatocytes from Foxm1KC-/- have lower FOXM1/MAT2A/2B after BDL. This may be partly due to transfer of extracellular vesicles between different cell types. Altogether, FOXM1/MAT2A/MAT2B axis drives liver inflammation and fibrosis.


Conflict of interest statement

The authors declare no competing interests.

Figures

Fig. 1
Fig. 1. Expression of FOXM1/MAT2A/MAT2B during bile duct ligation (BDL) and after FDI-6 treatment.
a Western blots show the time course of protein expression of FOXM1, MATα2, and MAT2β in liver tissues after BDL (n = 3 independent experiments). b Immunofluorescence (IF) of FOXM1, MATα2, and MAT2β in primary hepatic stellate cells (HSCs) isolated from sham and BDL mice at day 5. The top row shows DAPI staining. The second and third rows show the antibody (AB) staining. The fourth row shows merged images of DAPI and FOXM1, MATα2 or MAT2β, and the fifth row shows high magnification (HM) from the merged image (n = 3 independent experiments). c Expression of mRNA (top) and protein (bottom) of FOXM1, MATα2, MAT2β, α-SMA, and COL1A1 in HSCs isolated from WT mice and cultured for up to 5 days and FDI-6 treatment for 24 h starting at day 4. Data presented as mean ± SEM (n = 3 per group), mRNA levels of Foxm1, Mat2a, Mat2b, Acta2 and Col1a1 in HSCs at day 5 vs. day 1, p = 0.0044, p = 0.0029, p = 0.0056, p = 0.0010 and p = 0.00002, respectively. mRNA levels of Foxm1, Mat2a, Mat2b, Acta2 and Col1a1 in HSCs at day 5 + FDI-6 vs. day 1, p = 0.0431, p = 0.0152, p = 0.0245, p = 0.0083, and p = 0.0082, respectively. *p < 0.05, **p < 0.01, ***p < 0.001, ****p < 0.0001. See Supplementary Fig. 3a for densitometric values of the western blots. d Expression of mRNA and protein of FOXM1, MATα2, MAT2β, α-SMA, and COL1A1 after FDI-6 treatment in LX-2 cells. Data presented as mean ± SEM (n = 3 per group), mRNA levels of Foxm1, Mat2a, Mat2b, Acta2 and Col1a1 in LX2 cells with DMSO treatment vs. FDI-6, p = 0.0187, p = 0.0023, p = 0.0122, p = 0.0108 and p = 0.0124, respectively. *p < 0.05, **p < 0.01 vs. DMSO. See Supplementary Fig. 3b for densitometric values of the western blots. e IF of LX-2 cells after treatment with FDI-6. HM, high magnification from the merged images (n = 3 independent experiments). f FOXM1, MATα2, and MAT2β in cytoplasm and nucleus from HSCs isolated from sham and BDL mice with or without FDI-6 treatment (n = 3 independent experiments). Densitometry for cytoplasmic protein levels is summarized in Supplementary Fig. 3c and nuclear protein levels is summarized in Supplementary Fig. 3d. Proliferation (g) and migration (h) of LX-2 cells in vitro after FDI-6 treatment for 24 h. Data presented as mean ± SEM (n = 3 per group). p = 0.00016, p = 0.00002 vs.DMSO. Statistical significance was determined by using two-tailed unpaired Student’s t-test. ***p < 0.001, ****p < 0.0001 vs. DMSO (n = 3). Abbreviations: BDL bile duct ligation, DMSO dimethylsulfoxide. Source data are provided as a Source Data file.
Fig. 2
Fig. 2. Prevention and treatment roles of FDI-6 in carbon tetrachloride (CCl4)-induced liver fibrosis.
a Liver sections from prevention groups of the corn oil (Oil) + DMSO, Oil + FDI-6, CCl4 + DMSO, and CCl4 + FDI-6 for three weeks, and treatment groups of Oil + DMSO, Oil + FDI-6, CCl4 + DMSO, and CCl4 + FDI-6 treated for two weeks after CCl4 treatment for three weeks. IHC stained with antibodies of COL1A1, F4/80, α–SMA, FOXM1, MATα2, and MAT2β. H&E is shown in the top row. b, c show changes in ALT (n = 6 per group) (b) and AST (n = 6 in prevention group of Oil + DMSO, n = 5 in prevention group of Oil + FDI-6, n = 3 in prevention group of CCl4 + DMSO and treatment group of Oil + FDI-6, n = 4 in prevention group of CCl4 + FDI-6, and treatment groups of Oil + DMSO, CCl4 + DMSO, and CCl4 + FDI-6) (c) levels after FDI-6 administration in the prevention and treatment groups. Data presented as mean ± SEM, **p < 0.01, ****p < 0.0001. d Hydroxyproline content was measured in the livers from prevention and treatment groups with or without FDI-6 administration. Data presented as mean ± SEM, **p < 0.01, ****p < 0.0001 (n = 5 per group). e mRNA levels of Foxm1, Mat2a, and Mat2b in the livers after FDI-6 administration in the prevention and treatment groups. Data presented as mean ± SEM (n = 4), **p < 0.01, ****p < 0.0001 (n = 4 in prevention and treatment groups of Oil + DMSO for Foxm1 mRNA; n = 6 in prevention and treatment groups of Oil + DMSO for Mat2α and Mat2b mRNA; n = 4 in prevention and treatment groups of Oil+ FDI-6 for Foxm1 mRNA; n = 6 in prevention and treatment groups of Oil + FDI-6 for Mat2α and Mat2b mRNA level; n = 4 in prevention group of CCl4 + DMSO for Foxm1 mRNA level; n = 6 in prevention and treatment groups of CCl4 + DMSO for Mat2α and Mat2b mRNA and treatment group of CCl4 + DMSO for Foxm1 mRNA; n = 5 in treatment group of CCl4 + FDI-6 for Foxm1 mRNA level; n = 6 in prevention and treatment groups of CCl4 + FDI-6 for Mat2α and Mat2b mRNA and prevention group of CCl4+FDI-6 for Foxm1 mRNA. f Protein levels of FOXM1, MATα2, MAT2β, α–SMA, F4/80, and COL1A1 from livers after prevention and treatment with FDI-6 (n = 3 independent experiments). Densitometry values for protein levels are summarized in Supplementary Fig. 3e, f. Statistical significance was determined by using two-tailed, unpaired Student’s t-test. Source data are provided as a Source Data file. Abbreviations: ALT alanine transaminase, AST aspartate aminotransferase.
Fig. 3
Fig. 3. FOXM1, MATα2 and MAT2β regulate each other positively at the transcriptional level.
MAT2A (a), MAT2B (b) and FOXM1 (c) promoter activities in LX-2 cells and primary cholangiocytes ± FDI-6 or siRNA treatment as described in Methods. Effects of mutating FOX elements in LX-2 cells are shown in (d) MAT2A, (e) MAT2B, and (f) FOXM1. Cells transfected with WT and mutant constructs were treated with siRNA against MAT2A, MAT2B, and FOXM1 and reporter activities were measured. Data presented as mean ± SEM (n = 3 per group). For a, Mat2a promoter activities of D-271/ + 60, D-671/ + 60 and D-1329/ + 60 in LX2 cell, SC + DMSO vs. SC + FDI-6, p = 0.0002, p = 0.0052 and p = 0.0948, respectively; SC + DMASO vs. SC + FOXM1 si, p = 0.0001, p = 0.0022 and p = 0.0003, respectively; Mat2a promoter activities of D-271/ + 60 in cholangiocytes, SC + DMSO vs. SC + FDI-6 or SC+Foxm1si, p = 0.0286 and 0.0149, respectively. For b, Mat2b promoter activities of D-25−/+3, D-713/+3, D-990/+3 and D-1319/+3 in LX2 cell, SC + DMSO vs. SC + FDI-6, p = 0.0051, p = 0.0316, p = 0.016 and p = 0.0034, respectively; SC + DMSO vs. SC + FOXM1 si, p = 0.0106, p = 0.0233, p = 0.0019 and p = 0.0049 respectively; Mat2b promoter activities of D-250/+3 in cholangiocytes, SC + DMSO vs. SC + FDI-6 or SC + Foxm1 si, p = 0.0002 and 0.023, respectively. For c, Foxm1 promoter activities of D-312/+107 and D-1333/+107 in LX2 cell, SC + DMSO vs. SC + FDI-6, p = 0.5799 and p = 0.0020, respectively; SC + DMSO vs. SC + FOXM1 si, p = 0.7684 and p = 0.0047 respectively; Foxm1 promoter activities of D-1333/ + 107 in cholangiocytes, SC + DMSO vs. SC + FDI-6 or SC + Foxm1 si, p = 0.0163 and 0.0131, respectively. For d, MAT2A promoter activities (−270/+60) of WT and MU, SC vs. SC, p = 0.015 and p = 0.28 respectively; FOXM1si vs. SC, p = 0.0032 and p = 0.042 respectively; MAT2Asi vs. SC, p = 0.0033 and p = 0.066 respectively. For e, MAT2B promoter activities (−250/+3) of WT and MU, SC vs. SC, p = 0.0017 and p = 0.11 respectively; FOXM1si vs. SC, p = 0.0018 and p = 0.022 respectively; MAT2Asi vs. SC, p = 0.0015 and p = 0.026 respectively. For f, FOXM1 promoter activities (−1333/+107) of WT and MU, SC vs. SC, p = 0.000017 and p = 0.0078 respectively; FOXM1si vs. SC, p = 0.000014 and p = 0.0063 respectively; MAT2Asi vs. SC, p = 0.00020 and p = 0.019 respectively. g ChIP assay was performed by spanning two FOX regions of the FOXM1 promoter in LX-2 cells using FOXM1, MATα2 and MAT2β antibodies after treatments that varied the expression of FOXM1, MAT2A or MAT2B in the top three rows. Seq-ChIP with anti-MATα2 and MAT2β antibodies after FOXM1 ChIP was performed as described in Methods. Representative results from three experiments are shown. h qPCR analysis of the ChIP assay from (g). For h, ChIP and Seq-ChIP percentage of input DNA, FOXM1 si vs. SC, MAT2A si vs. SC, MAT2B si vs. SC, FOXM1 OV vs. EV, MAT2A OV vs. EV, and MAT2B OV vs. EV, for FOXM1 ChIP, p = 0.00089, p = 0.011, p = 0.0045, p = 0.0000053, p = 0.00024, and p = 0.000039; for MAT2A seq-ChIP p = 0.0015, p = 0.0023, p = 0.0037, p = 0.000037, p = 0.00076, and p = 0.00032; for MAT2B seq-ChIP p = 0.0036, p = 0.018, p = 0.0092, p = 0.0036, p = 0.0000098, p = 0.0013 respectively. Data presented as mean ± SEM, *p < 0.05, **p < 0.01, and ***p < 0.001 vs. SC or EV (n = 3 independent experiments). i EMSA was done using labeled probes containing two FOX binding motifs of the FOXM1 promoter as shown in (f) and 100 ug of nuclear protein from LX-2 cells after treatments that varied FOXM1/MAT2A/MAT2B (n = 3 independent experiments). j Super shifts were done using 100 ng of recombinant proteins of FOXM1, MATα2, MAT2β alone or combined, and antibodies to FOXM1, MATα2 and MAT2β. Probe and IgG only served as negative controls. Results represent three independent experiments. k In vitro pull-down shows direct interaction between MATα2, MAT2β and FOXM1 using recombinant MATα2, MAT2β and FOXM1 proteins (n = 3 independent experiments). l MATα2, MAT2β and FOXM1 interaction in Flox control (WT), Foxm1Hep−/−, with or without BDL was detected by Co-IP and western blotting (n = 3 independent experiments). Statistical significance was determined by using two-tailed, unpaired Student’s t-test. Source data are provided as a Source Data file. Abbreviations: AB antibody, EV empty vector, IP immunoprecipitation, OV overexpression, si siRNA, WT wild type, MU mutants.
Fig. 4
Fig. 4. Response of hepatocyte specific Foxm1 knockout (Foxm1Hep−/−) mice to BDL.
a H&E, Sirius red, CK19, α-SMA, and F4/80 staining in Flox control and Foxm1Hep−/− mice after BDL as compared to sham surgery. Liver fibrosis was measured by Sirius red staining (n = 7 per group) (b) and hydroxyproline assay (n = 5 per group) (c), liver injury by ALT (n = 6 per group) (d) and AST (n = 6 per group) (e) levels, macrophage number by F4/80 (n = 6 per group) (f), and ductular proliferation by CK19 (n = 4 per group) and myofibroblast differentiation by α-SMA staining (n = 3 per group) (g). For b, Sirus red area/total area for Flox BDL vs. Sham and Hep−/− BDL vs. Flox BDL, p = 0.00000000011 and p = 0.0000015, respectively. For c, hydroxyproline (ug/g, liver) for Flox BDL vs. Sham and Hep−/− BDL vs. Flox BDL, p = 0.000058 and p = 0.0034, respectively. For d, ALT level (ug/L) for Flox BDL vs. Sham and Hep−/− BDL vs. Flox BDL, p = 0.000000000014 and p = 0.00000000097, respectively. For e, AST level (ug/L) for Flox BDL vs. Sham and Hep−/− BDL vs. Flox BDL, p = 0.0000000000001 and p = 0.00000025, respectively. For f, F4/80 positive number for Flox BDL vs. Sham and Hep−/− BDL vs. Flox BDL, p = 0.0000000020 and p = 0.00080, respectively. For g, CK19/total area for Flox BDL vs. Sham and Hep−/− BDL vs. Flox BDL, p = 0.00000078 and p = 0.00026, respectively. Data are shown as mean ± SEM, **p < 0.01, ***p < 0.001, ****p < 0.0001. h Protein expression of FOXM1, MATα2, and MAT2β in hepatocytes, cholangiocytes, HSCs, and KCs isolated from Flox control and Foxm1Hep−/− mice ± BDL, Densitometry values for protein levels are summarized in Supplementary Fig. 11a–d. mRNA levels of Foxm1, Mat2a, and Mat2b in hepatocytes (n = 6 animals in Flox + Sham, Foxm1hep−/− + Sham, Flox + BDL groups and Foxm1hep−/− + BDL group for foxm1 and mat2b mRNA; n = 4 in Flox + Sham, Foxm1hep−/− + Sham, Flox + BDL groups and n = 6 in foxm1hep−/−+BDL group for mat2a mRNA) (i), cholangiocytes (n = 4 animals in Flox + Sham, foxm1hep−/− + Sham, Flox + BDL groups and foxm1hep−/− + BDL groups for foxm1 mRNA; n = 5 in Flox + Sham and foxm1hep−/− + Sham groups and n = 4 in Flox + BDL and Foxm1hep-−/− + BDL groups for mat2a mRNA; n = 6 in Flox + Sham, Foxm1hep−/− + Sham, Flox + BDL groups and foxm1hep−/− + BDL group for mat2b mRNA) (j), HSCs (n = 6 animals) (k), and KCs (n = 4 animals in Flox + Sham, Flox + BDL groups, foxm1hep−/− + BDL groups and n = 5 in foxm1hep−/− + Sham for foxm1 mRNA; n = 5 in Flox + Sham and foxm1hep−/− + Sham groups, Flox + BDL and Foxm1hep−/− + BDL groups for mat2a mRNA; n = 5 in Flox + Sham, Flox + BDL and Foxm1hep−/− + BDL groups and n = 6 in foxm1hep−/− + Sham group for mat2b mRNA). l isolated from Flox control, Foxm1Hep−/− mice ± BDL. Data are shown as mean fold of Flox control ± SEM, *p < 0.05, ***p < 0.001, ****p < 0.0001. p values obtained via two-tailed unpaired Student’s t tests. For i, mRNA levels in hepatocytes, fold of Flox con of FOXM1, MAT2A, and MAT2B of Flox BDL vs. Sham p = 0.0000045, p = 0.000030, and p = 0.000028 respectively; of Hep−/− BDL vs. Flox BDL p = 0.0000000099, p = 0.00024, p = 0.000099 respectively. For j, mRNA levels in cholangiocytes, fold of Flox con of FOXM1, MAT2A, and MAT2B of Flox BDL vs. Sham p = 0.00023, p = 0.00000026, and p = 0.000000011, respectively; of Hep−/− BDL vs. Flox BDL p = 0.000041, p = 0.013, and p = 0.0000031, respectively. For k, mRNA levels in HSCs, fold of Flox con of FOXM1, MAT2A, and MAT2B of Flox BDL vs. Sham, p = 0.0000000000005, p = 0.000000067, and p = 0.0000000000 respectively; of Hep−/− BDL vs. Flox BDL p = 0.00000000050, p = 0.00025, and p = 0.0000000011 respectively. For l, mRNA levels in KCs, fold of Flox con of FOXM1, MAT2A, and MAT2B of Flox BDL vs. Sham, p = 0.000041, p = 0.000010, and p = 0.00000035 respectively; of Hep−/− BDL vs. Flox BDL p = 0.84, p = 0.16, and p = 0.62 respectively. Statistical significance was determined by using two-tailed unpaired Student’s t-test. Source data are provided as a Source Data file. Abbreviations: ALT alanine transaminase, AST aspartate aminotransferase, BDL bile duct ligation, Cho cholangiocytes, HSCs hepatic stellate cells, Hep hepatocytes, KCs Kupffer cells.
Fig. 5
Fig. 5. Response of hepatic stellate cell (HSC)-specific Foxm1 knockout (Foxm1HSC−/−) mice to BDL.
a H&E, Sirius red, CK19, α-SMA, and F4/80 staining in Flox control and Foxm1HSC−/− mice after BDL as compared to sham surgery. Liver fibrosis was measured by Sirius red staining (n = 8 animals per group) (b) and hydroxyproline assay (n = 6 animals per group) (c), liver injury by ALT (n = 6 animals in Flox + Sham, Flox + BDL and Foxm1HSC−/− + BDL groups and n = 5 in Foxm1HSC−/− + Sham) (d) and AST (n = 7 in Flox + Sham, Flox + BDL groups and n = 6 in Flox + BDL group and n = 5 in foxm1HSC−/− + BDL) (e) levels, macrophage number by F4/80 (n = 4 animals per group) (f), and ductular proliferation by CK19 staining (n = 6 animals per group) and myofibroblast differentiation by α-SMA staining (n = 3 animals per group) (g). For b, Sirius red area/total area of Flox BDL vs. Sham and HSC−/− BDL vs. Flox BDL, p = 0.0000000015 and p = 0.0000060 respectively. For c, hydroxyproline (ug/g, liver) for Flox BDL vs. Sham and HSC−/− BDL vs. Flox BDL, p = 0.00000012 and p = 0.000094 respectively. For d, ALT level (ug/L) for Flox BDL vs. Sham and HSC−/− BDL vs. Flox BDL, p = 0.000000041 and p = 0.0000013 respectively. For e, AST level (ug/L) for Flox BDL vs. Sham and HSC−/− BDL vs. Flox BDL, p = 0.00000000066 and p = 0.00044 respectively. For f, F4/80 positive number for Flox BDL vs. Sham and HSC−/− BDL vs. Flox BDL, p = 0.0000000071 and p = 0.0073 respectively. For g, Flox BDL vs. Sham and HSC−/− BDL vs. Flox BDL for CK19/total area, p = 0.000000000075 and p = 0.080 respectively; for α-SMA area/total area, p = 0.000026 and p = 0.00011 respectively. Data are shown as mean ± SEM, ***p < 0.001, ****p < 0.0001. h Protein expression of FOXM1, MATα2, and MAT2β in hepatocytes, cholangiocytes, HSCs, and KCs isolated from Flox control and Foxm1HSC−/− mice ± BDL, Densitometry values for protein levels are summarized in Supplementary Fig. 11e, f. mRNA levels of Foxm1, Mat2a, and Mat2b in hepatocytes (n = 6 per group) (i), cholangiocytes (n = 6 per group) (j), HSCs (n = 6 per group) (k), and KCs (n = 6 per group) (l) isolated from Flox control and Foxm1HSC−/− mice ± BDL. Data are shown as mean fold of Flox control ± SEM, ****p < 0.0001, and ns not significant. p values obtained via two-tailed unpaired Student’s t tests. For i, mRNA levels in Hepatocytes, fold of Flox con of FOXM1, MAT2A, MAT2B for Flox BDL vs. Sham, p = 0.0000000000004, p = 0.0000000000001 and p = 0.0000000000072 respectively; for HSC−/− BDL vs Flox BDL, p = 0.000000000022, p = 0.000000000020, and p = 0.000000054 respectively. For j, mRNA levels in Cholangiocytes, fold of Flox con of FOXM1, MAT2A, and MAT2B for Flox BDL vs. Sham p = 0.0000000000000, p = 0.000000028, and p = 0.0000000085 respectively; for HSC−/− BDL vs Flox BDL, p = 0.17, p = 0.42, and p = 0.46 respectively. For k, mRNA levels in HSCs, fold of Flox con of FOXM1, MAT2A, and MAT2B for Flox BDL vs. Sham p = 0.0000052, p = 0.0000000000, and p = 0.0000000000 respectively; for HSC−/− BDL vs Flox BDL, p = 0.00000056, p = 0.00018, and p = 0.00000000002 respectively. For l, mRNA levels in KCs, fold of Flox con of FOXM1, MAT2A, and MAT2B for Flox BDL vs. Sham p = 0.000000000091, p = 0.00036, and p = 0.00000010 respectively; for HSC−/− BDL vs Flox BDL, p = 0.086, p = 0.61, and p = 0.15 respectively. Statistical significance was determined by using two-tailed unpaired Student’s t-test. Source data are provided as a Source Data file. Abbreviations: ALT alanine transaminase, AST aspartate aminotransferase, BDL bile duct ligation, Cho cholangiocytes, HSCs hepatic stellate cells; Hep hepatocytes, KCs Kupffer cells.
Fig. 6
Fig. 6. Response of Kupffer cell (KC)-specific Foxm1 knockout (Foxm1KC−/−) mice to BDL.
a H&E, Sirius red, CK19, α-SMA, and F4/80 staining in Flox control and Foxm1KC−/− mice after BDL as compared to sham surgery. Liver fibrosis was measured by Sirius red staining (n = 8 animals per group), b and hydroxyproline assay (n = 5 animals in Flox + Sham group and n = 6 in foxm1KC−/− + Sham, Flox + BDL and foxm1KC−/− + BDL groups) (c), liver injury by ALT (n = 6 animals per group) (d) and AST (n = 6 animals per group) (e) levels, macrophage number by F4/80 (n = 6 animals per group) (f), and ductular proliferation by CK19 (n = 4 animals per group) and myofibroblast differentiation by α-SMA staining (n = 3 animals per group) (g). For b, Sirius red area/total area of Flox BDL vs. Sham and KC−/− BDL vs. Flox BDL, p = 0.00000000049 and p = 0.00014 respectively. For c, hydroxyproline (ug/g, liver) for Flox BDL vs. Sham and KC−/− BDL vs. Flox BDL, p = 0.00030 and p = 0.012 respectively. For d, ALT level (ug/L) for Flox BDL vs. Sham and KC−/− BDL vs. Flox BDL, p = 0.0000000000000 and p = 0.000000000081 respectively. For e, AST level (ug/L) for Flox BDL vs. Sham and KC−/− BDL vs. Flox BDL, p = 0.0000000000001 and p = 0.00000025 respectively. For f, F4/80 positive number for Flox BDL vs. Sham and KC−/− BDL vs. Flox BDL, p = 0.0000000067 and p = 0.0000094 respectively. For g, Flox BDL vs. Sham and KC−/− BDL vs. Flox BDL for CK19/total area, p = 0.00000010 and p = 0.039 respectively; for α-SMA area/total area, p = 0.000026 and p = 0.00033 respectively. Data are shown as mean ± SEM, *p < 0.05, ***p < 0.001, ****p < 0.0001. h Protein levels of FOXM1, MATα2, and MAT2β in hepatocytes, cholangiocytes, HSCs, and KCs isolated from Flox and Foxm1KC−/− mice ± BDL, Densitometry values for protein levels are summarized in Supplementary Fig. 12a–d. mRNA levels of Foxm1, Mat2a, and Mat2b in hepatocytes (n = 6 per group) (i), cholangiocytes (n = 6 per group) (j), HSCs (n = 6 per group) (k), and KCs (n = 6 per group) (l) isolated from Flox control and Foxm1KC−/− mice ± BDL. Data are shown as mean fold of Flox control ± SEM, ***p < 0.001, ****p < 0.0001, ns not significant. For i, mRNA levels in hepatocytes, fold of Flox con of FOXM1, MAT2A, MAT2B for Flox BDL vs. Sham, p = 0.000000012, p = 0.0000019 and p = 0.50 respectively; for KC−/− BDL vs Flox BDL, p = 0.00000086, p = 0.00060, and p = 0.0000000036 respectively. For j, mRNA levels in cholangiocytes, fold of Flox con of FOXM1, MAT2A, and MAT2B for Flox BDL vs. Sham p = 0.0000000000001, p = 0.0000000000005, and p = 0.00000000046 respectively; for KC−/− BDL vs Flox BDL, p = 0.071, p = 0.064, and p = 0.061 respectively. For k, mRNA levels in HSCs, fold of Flox con of FOXM1, MAT2A, and MAT2B for Flox BDL vs. Sham p = 0.0000000086, p = 0.0000000002, and p = 0.000000000 respectively; for KC−/− BDL vs Flox BDL, p = 0.0000032, p = 0.0000095, and p = 0.0000078 respectively. For l, mRNA levels in KCs, fold of Flox con of FOXM1, MAT2A, and MAT2B for Flox BDL vs. Sham p = 0.000000040, p = 0.000000033, and p = 0.00000075 respectively; for KC−/− BDL vs Flox BDL, p = 0.00000000071, p = 0.00000097, and p = 0.0000059, respectively. Statistical significance was determined by using two-tailed unpaired Student’s t-test. Source data are provided as a Source Data file. Abbreviations: ALT alanine transaminase, AST aspartate aminotransferase, BDL bile duct ligation, Cho cholangiocytes, HSCs hepatic stellate cells, Hep hepatocytes, KCs Kupffer cells.
Fig. 7
Fig. 7. Roles of FOXM1, MAT2A and MAT2B in transforming growth factor (TGF)-β1 signaling in LX-2 cells and LPS effects in macrophages, and their presence in EVs.
a Time courses of protein expression of FOXM1, MATα2, MAT2β, SMAD3, α–SMA, and COL1A1 after TGF-β1 treatment in LX-2 cells. b FOXM1, MATα2, MAT2β, SMAD3, α-SMA and COL1A1 protein levels after siRNA knockdown of FOXM1, MAT2A, or MAT2B in LX-2 cells after 24 h. c Protein levels of FOXM1, MATα2, MAT2β, SMAD3, α-SMA, and COL1A1 after FOXM1 overexpression with or without MAT2A or MAT2B siRNA knockdown and TGF–β1 treatment (20 ng/ml) for 24 h in LX-2 cells. d Effect of LPS on protein expression of FOXM1, MATα2, MAT2β, TNF-α, and IL-6 with or without siRNA knockdown of FOXM1, MAT2A or MAT2B in RAW 264.7 cells for 24 h. e Effects of LPS on protein expression of FOXM1, MATα2, MAT2β, TNF-α, and IL-6 with FOXM1 overexpression and MAT2A or MAT2B siRNA treatment for 24 h in RAW 264.7 cells (left panel) and KCs isolated from Flox control mice (right panel). Densitometry values for protein levels are summarized in Supplementary Fig. 12e, f and Supplementary Fig. 13a–d. n = 3 independent experiments. Source data are provided as a Source Data file.
Fig. 8
Fig. 8. FOXM1, MATα2, MAT2β are secreted in EVs and exchanged between hepatocytes, HSCs, and KCs.
a Following BDL and culture of hepatocytes from flox mice and Foxm1Hep−/−, EVs were extracted from the medium and used to treat HSCs from Foxm1HSC−/−. b Following BDL and culture of HSCs from flox mice and Foxm1HSC−/−, EVs were extracted from the medium and used to treat hepatocytes from Foxm1Hep−/−. c, d Following BDL and culture of KCs from flox mice and Foxm1KC−/−, EVs were extracted from the medium and used to treat (c) HSCs from Foxm1HSC−/− or (d) hepatocytes from Foxm1Hep−/−. e EVs extracted from hepatocytes of Flox and Foxm1Hep−/− after BDL were used to treat KCs from Foxm1KC−/− and (f) EVs extracted from HSCs of Flox and Foxm1HSC−/− after BDL were used to treat KCs from Foxm1KC−/−. All EV treatments were for 24 h after which protein expression of FOXM1, MATα2 and MAT2β were measured in cell lysates by western blotting. Densitometry values for protein levels are summarized in Supplementary Fig. 14a–f, n = 3 independent experiments (g) Summary of key findings showing the FOXM1/MAT2A/MAT2B axis in the different liver cell types driving liver inflammation and fibrosis. Source data are provided as a Source Data file.

References

    1. Friedman, S. L. Liver fibrosis – from bench to bedside. J. Hepatol.38, S38–S53 (2003). - PubMed
    1. Li, Y. et al. Reciprocal regulation between forkhead box M1/NF-κB and methionine adenosyltransferase 1A drives liver cancer. Hepatology72, 1682–1700 (2020). - PMC - PubMed
    1. Kurahashi, T. et al. Forkhead box M1 transcription factor drives liver inflammation linking to hepatocarcinogenesis in mice. Cell. Mol. Gastroenterol. Hepatol.9, 425–446 (2020). - PMC - PubMed
    1. Sun, W. et al. ALKBH5 promotes lung fibroblast activation and silica-induced pulmonary fibrosis through miR-320a-3p and FOXM1. Cell. Mol. Biol. Lett.27, 26 (2022). - PMC - PubMed
    1. Filliol, A. & Schwabe, R. F. FoxM1 induces CCl2 secretion from hepatocytes triggering hepatic inflammation, injury, fibrosis, and liver cancer. Cell. Mol. Gastroenterol. Hepatol.9, 555–556 (2020). - PMC - PubMed

Publication types

MeSH terms