. 2024 Sep 27;15(1):8404.
doi: 10.1038/s41467-024-52659-x.

SURF2 is a MDM2 antagonist in triggering the nucleolar stress response

Affiliations

SURF2 is a MDM2 antagonist in triggering the nucleolar stress response

Sophie Tagnères et al. Nat Commun. .

Abstract

Cancer cells rely on high ribosome production to sustain their proliferation rate. Many chemotherapies impede ribosome production which is perceived by cells as "nucleolar stress" (NS), triggering p53-dependent and independent pathways leading to cell cycle arrest and/or apoptosis. The 5S ribonucleoprotein (RNP) particle, a sub-ribosomal particle, is instrumental to NS response. Upon ribosome assembly defects, the 5S RNP accumulates as free form. This free form is able to sequester and inhibit MDM2, thus promoting p53 stabilization. To investigate how cancer cells can resist to NS, here we purify free 5S RNP and uncover an interaction partner, SURF2. Functional characterization of SURF2 shows that its depletion increases cellular sensitivity to NS, while its overexpression promotes their resistance to it. Consistently, SURF2 is overexpressed in many cancers and its expression level is an independent marker of prognosis for adrenocortical cancer. Our data demonstrate that SURF2 buffers free 5S RNP particles, and can modulate their activity, paving the way for the research of new molecules that can finely tune the response to nucleolar stress in the framework of cancer therapies.


Conflict of interest statement

S.T., S.L., V.M., C.P.C., and P.E.G. have filed a patent application on the targeting of SURF2 in cancer, therapies and ribosomopathies treatments. The remaining authors declare no competing interests.

Figures
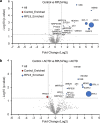
Fig. 1
Fig. 1. Label-free quantitative proteomics analysis of RPL5-FLAG co-purified proteins.
Nano-liquid chromatography-tandem mass spectrometry (nanoLC-MS/MS) analysis of trypsin digested proteins retained on flag-coated beads issued from U2OS control cells (LEFT quadrant) or cell expressing RPL5-FLAG (RIGHT quadrant). Three independent experimental replicates (n = 3) were performed. Volcano plots showing proteins significantly enriched for control cells (red) versus cells expressing RPL5-FLAG (a) in untreated cells (b) in cells treated with actinomycin D (ACTD, 10 ng/ml) for 24 h. An unpaired two-tailed Student’s t test with equal variance was used. Enrichment significance thresholds are represented by an absolute log2-transformed fold-change (FC) greater than 1 and a -log10-transformed (p-value) greater than 1.3. The iBAQ (intensity-Based Absolute Quantification) values are represented by the diameter of each dot for the proteins that are significantly enriched in order to rank their absolute abundances. Source data are provided as a Source Data file.
Fig. 2
Fig. 2. SURF2 is a partner of free 5S particles and is involved in p53 regulation.
a Label-free quantitative proteomics analysis of trypsin-digested proteins retained on beads coated by anti-GAPDH or anti-SURF2 antibodies. Three independent experimental replicates (n = 3) were performed. Volcano plot showing proteins significantly enriched in the GAPDH IP (brown) versus the SURF2 IP (purple). An unpaired two-tailed Student’s t test with equal variance was used. Enrichment significance thresholds are represented by an absolute log2-transformed fold-change (FC) greater than 1 and a -log10-transformed (p-value) greater than 1.3. Proteins involved in ribosome biogenesis and function are indicated in green. b Focus on the iBAQ values, represented by the diameter of each dot, for the proteins significantly enriched in the SURF2 IP. c Detection of RNAs associated with HEXIM1 and SURF2. U2OS RNAs co-immunoprecipitated with endogenous HEXIM1 (a-HEXIM1) or endogenous SURF2 (a-SURF2) were 3’-labeled and separated on a 6% acrylamide gel. Control IP reaction performed without antibodies (beads) is shown (n = 1). d U2OS cell extracts were fractionated using the PSE method. Western-blot analyses showing the contents of different factors (indicated at the left of the gel) in the SN1, SN2, and SN3 fractions obtained with the PSE method (n = 2). e Microscopy analyses of U2OS cells over-expressing SURF2-GFP from TET inducible promoter. Cells were induced with tetracycline to obtain a similar expression as the endogenous copy (tetracycline at 5 ng/mL), and a SURF2-GFP signal was detected (Green). The same cells were also probed for fibrillarin to stain nucleoli. DAPI coloration is used to localize the nuclear compartment. Scale bar 25 μm. Source data are provided as a Source Data file.
Fig. 3
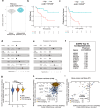
Fig. 3. SURF2 is overexpressed in adrenocortical carcinomas and its knock-out negatively affects cancer cells similarly to MDM2.
a Comparison of SURF2 mRNA levels in non-tumoral (left panel, gray values) and tumoral tissues (right panel, blue values). Data were extracted from the standardized Xena database to compare healthy adrenal gland tissues (n = 128, origin GTEx dataset) and adrenocortical carcinoma tissues (n = 77, origin TCGA dataset). Compared to healthy adrenal gland tissues, SURF2 mRNA levels are higher in adrenocortical carcinoma tissue. ****: p < 0.0001 (Wilcoxon Test). Data are presented as a violin plot. It comprises a density plot, the width of which indicates the frequency, and a box plot, where the extreme points reflect the minimum (Q0) and maximum (Q4), the length of the box represents the interquartile range (IQR: percentile Q1 to Q3) and the center represents the median. b, c Association between SURF2 mRNA levels and patient survivals. Using the standardized Xena dataset, associations between SURF2 mRNA levels (median as cut-off value) and overall survival (b) or progression-free survival (c) were determined using Kaplan-Meier curves. A significant association was observed between high levels of SURF2 mRNA levels and poor patient survival. *: p < 0.05; **: p < 0.01 (Log-rank). d, e Association between SURF2 mRNA levels and patient survivals after adjustment on clinical parameters. Using the standardized Xena dataset, multivariate Cox regression models for overall survival (Low n = 39, High n = 38) (d) or progression-free survival (e) were performed on clinical parameters significantly associated with patient survivals (i.e., TP53 mutation status and tumor stage, See Supplementary Table S6). High mRNA levels of SURF2 and stage IV are independent markers of poor survival of patients carrying adrenocortical carcinoma. *: p < 0.05; **: p < 0.01 (Cox Proportional-Hazards Model, two-sided hypothesis test). Error bars show 95%CI (confidence interval) and square HR (hazard ratio), p-value (0.032 and 0.003 respectively), source data are provided as a Source Data file. f Top SURF2 correlated genes in Project Achilles. The Pearson correlation score on the right indicates the strength of co-dependencies between SURF2 and the indicated genes. g SURF2 knock-out chronos effect on different cancer cells classified into three groups depending on their TP53 status: wild-type (blue, n = 386), hot-spot mutations (brown, n = 545), damaging mutations (yellow, n = 169). The data are presented as the mean ± s.d. Statistical analysis by two-way ANOVA with Turkey’s multiple comparisons test. Significant differences are indicated by p-value < 0.0001 (****) (ns = no significance). h Classification of more than 1000 cancer cells based on their associated chronos effect of SURF2 knock-out and MDM2 knock-out. Pearson correlation between the two chronos effects is indicated depending on TP53 status. i Same as in (h) but focusing on bone cancer cell lines. Source data are provided as a Source Data file.
Fig. 4
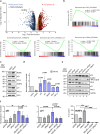
Fig. 4. SURF2 depletion up-regulates the p53 pathway.
RNA-seq analyses of SURF2 depletion. U2OS cells were treated by scramble siRNAs or by siRNAs against SURF2 for 96 h. mRNA expression levels were compared between the two conditions, and experiments were repeated (n = 3). a Volcano plot showing significantly differentially expressed genes. Using DESeq2, a comparison of gene expression between the customer-defined groups of samples was performed. The Wald test was used to generate p-values and log2 fold changes. Genes with an adjusted p-value < 0.05 and absolute log2 fold change > 1 were called differentially expressed genes indicated: up-regulated genes (red) and down-regulated (blue) or unaffected (gray). Genes from the TP53 pathway are highlighted yellow. b Gene set enrichment analysis (GSEA) in SURF2 depleted genes or in the control condition (siSCR). ES; enrichment score. GSEA P-values were derived from permutation testing and corrected for multiple testing using the False Discovery Rate (FDR) method. Enrichment score (ES) and FDR value were applied to sort SURF2 depleted and control cells genes-enriched after gene set permutations were performed 1000 times for the analysis. Gene Network Analysis was based on DEGs (log2foldchange  >  1). c Western-blot analyses showing the accumulation of different proteins in 20 µg of cellular extracts produced from U2OS cells treated with scrambled siRNAs (siSCR) or with siRNAs directed against SURF2 (siSurf2). d Quantification of signals obtained by western-blot analysis and normalized to actin signals in each condition (c) from independent biological replicates (p53, n = 5; SURF2, n = 5; p21 n = 5; MDM2, n = 3; RPL5, n = 3; RPL11, n = 3). Two-tailed t-test analysis was used for statistics. Data are presented as mean values +/− SD. Significant differences are indicated by stars (p-value 0.05*; 0.01**;0.001*** and 0.0001****) or with the precise p-value on the graph (p). e Co-depletion experiment. Western-blot analyses showing the accumulation of different proteins in 20 µg of cellular extracts issued from U2OS cells treated with a combination of different siRNAs: scrambled (siSCR); RPL5 (siRPL5); RPL11 (siRPL11) or SURF2 (siSurf2). f Quantification of signals obtained by western-blot analysis and normalized to GAPDH signals in each condition (h) (n = 3). Data are presented as mean values +/− SD. A one-way ANOVA test was used for statistics. Significant differences are indicated by stars (p-value 0.05*; 0.01** and 0.001***) or with the precise p-value on the graph (p). Source data are provided as a Source Data file.
Fig. 5
Fig. 5. SURF2 depletion increases free 5S binding to MDM2 and increases cell sensitivity to nucleolar stress.
a Detection of proteins associated with RPL5-Flag. Cell extracts produced from U2OS cells overexpressing RPL5-FLAG or not (control) and differentially treated by actinomycin D addition for 24 h (at 10 ng/mL) or not (ACTD + or −) and transfected with scrambled siRNAs (siSCR) or directed against SURF2 (siSurf2) were used to perform immuno-precipitation on beads coated with anti-flag. 10% of the inputs were loaded (In) aside IPs (IP) on a gel to perform western blots using antibodies directed against the indicated proteins to analyze the co-purification efficiency of the different factors. b Quantification of the co-purification efficiency with RPL5-Flag observed (a) for the indicated proteins (n = 3). Results are represented as a comparison of the enrichments observed in cells treated with siRNAs directed against SURF2 (siSurf2) normalized to the ones observed in cells treated with scrambled siRNAs (siSCR). Two-tailed t-test analysis was used for statistics. Data are presented as mean values +/− SD. Significant differences are indicated by stars (p-value 0.05*; 0.01**;0.001*** and 0.0001****) or with the precise p-value on the graph (p). c Quantification of the signals corresponding to the indicated proteins in the different inputs of western-blots analyses (a) from independent experiments n = 4 (original data are provided in the source data file). Two-tailed t test analysis was used for statistics. Data are presented as mean values +/− SD. Significant differences are indicated by stars (p-value 0.05*; 0.01**;0.001*** and 0.0001****) or with the precise p-value on the graph (p). d DNA content analysis of U2OS cells treated as indicated (siSCR: scrambled siRNAs; siSurf2: siRNAs against SURF2; ACTD: actinomycin D at 10 ng/mL for 24 h) by FACS. Quantification of U2OS cell repartition in the different phases of the cell cycle following different treatments (n = 3). Data are presented as mean values +/− SD. One-way Anova Test was used for statistics. Significant differences are indicated by stars (p-value 0.05*; 0.01**;0.001*** and 0.0001****) or with the precise p-value on the graph (p). e, f Proliferation analysis of differentially treated U2OS cells. Cells are treated as indicated (siSCR: scrambled siRNAs; siSurf2: siRNAs against SURF2; ACTD: actinomycin D at 10 ng/mL for 24 h). e Cells are platted on 6 well plate after being transfected with the indicated siRNAs, 24 h before being analyzed, cells were treated with actinomycin D (10 ng/mL) or H2O. Cells were stained with crystal violet to take a picture (n = 3) scale bar (0.5 mm). f Fixed crystal violet was resolubilized and quantified by absorbance for each condition after different time exposure to treatments (n = 3). g Cell apoptosis assays with an annexin-V-FITC and propidium iodide of differentially treated U2OS cells. Both apoptosis and necrosis are regrouped as dead cells (n = 3). Data are presented as mean values +/− SD. The One-way ANOVA test was used for statistics. Significant differences are indicated by stars (p-value 0.05*; 0.01**;0.001*** and 0.0001****) or with the precise p-value on the graph (p). Source data are provided as a Source Data file.
Fig. 6
Fig. 6. SURF2 overexpression impedes p53 activation and cell cycle arrest following nucleolar stress.
a Western-blot analysis showing the accumulation of different proteins, in 20 µg of cellular extracts produced from control U2OS cells or from U2OS cells that overexpress SURF2-Flag after Tetracycline induction (1 µg/ml) from their T-Rex locus for 24 h. Cells were also treated differentially with or without the addition of actinomycin D (10 mg/ml) for the same period (n = 3). b Quantification of the signals observed in an independent experiment (A) (n = 3). Data are presented as mean values +/− SD. One-way ANOVA tests were used for statistics. Significant differences are indicated by stars (p-value 0.05*; 0.01** and 0.001***). Source data are provided as a Source Data file. c DNA content analysis of U2OS cells treated as indicated (Ctrl: U2OS control cells; OE SURF2-Flag: U2OS cells that overexpress SURF2-Flag; ACTD: Treated with actinomycin D) by FACS. Quantification of different U2OS cell repartition in the different phases of the cell cycle following different treatments is represented as histograms (n = 3). Data are presented as mean values +/− SD. One-way ANOVA tests were used for statistics. Significant differences are indicated by stars (p-value 0.05*; 0.01** and 0.001***). Source data are provided as a Source Data file. d Comparison of p53 and p21 stabilization, assessed by western blots, following drugs treatment (5-Fu: 50 µM; MG-132: 10 µM; staurosporine: 25 nM for 24 h) in U2OS control cells (uninduced) or in cells overexpressing SURF2-Flag (Tetracycline 1 mg/ml). P53 and p21 signals were normalized to 1 in the control experiment, and relative stabilization in cell overexpressing SURF2-Flag was quantified from three independent biological replicates (n = 3). Data are presented as mean values +/− SD. Two-tailed paired T test was used for statistics. Significant differences are indicated by stars (p-value 0.05*; 0.01** and 0.001***). Source data are provided as a Source Data file.
Fig. 7
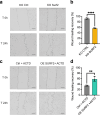
Fig. 7. SURF2 expression level affect U2OS phenotypic traits.
Analysis of U2OS KO SURF2 or U2OS overexpressing SURF2-Flag cell migration by wound healing assay. a, c Images were taken with Cell Imaging EVOS (Gx40) at 0 h and 24 h (n = 3) (scale bar = 0.1 mm). b, d Quantification of wound healing by measuring the percentage of persistent scar area after 24 h from three independent biological replicates (n = 3). Use of an unpaired two-tailed t test for statistical tests Data are presented as mean values +/– SD, and significant differences are indicated by stars as follows p-value < 0.05*; 0.01** 0.001*** and 0.0001****) or with the precise p-value on the graph (p). Source data are provided as a Source Data file.
Fig. 8
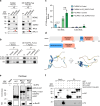
Fig. 8. SURF2 is able to directly interact with both RPL5 and RPL11 and competes for their binding with MDM2 in vivo.
a Extracts from U2OS cells that overexpress SURF2 (OE SURF2-Flag) or not (control) and treated by actinomycin D (ACTD) are used to perform IPs using beads only, beads coupled to anti-SURF2 or beads coupled to anti-MDM2. After washes, the remaining proteins are resuspended in loading dye and analyzed by western blots using the indicated antibodies. Red arrows indicate unspecify bands (IgG) (n = 2). b Same as in (a) but using northern blot to test for RNA binding. Probes against 5S and 5.8S were used (n = 3). c Quantification of northern-blot signals to test for specific enrichment of RNA species (n = 3). Use of an unpaired two-tailed t test for statistical tests. Data are presented as mean values +/− SD, and significant differences are indicated by stars as follows p-value < 0.05*; 0.01** 0.001*** and 0.0001****) or with the precise p-value on the graph (p). d Secondary structure of SURF2 and MDM2 proteins. Functional domains are indicated. SURF2 3D structure modelization by Alphafold software is represented. e GST-pulldown assays. Extracts of BL21 that overexpress recombinant SURF2-HIS were mixed with extracts that overexpress either GST alone, GST-RPL5, or GST-RPL11. Proteins specifically retained on glutathione-sepharose beads were analyzed both by Coomassie staining and western-blot analysis (WB). 10% of the extracts were used for inputs (n = 2). f Same experiments as in (e) but replacing extract with SURF2-HIS by extracts that overexpress structural domain of SURF2 (SURF2-SD-HIS) as prey. Proteins specifically retained on glutathione-sepharose beads were analyzed both by western blots with indicated antibodies (n = 2). Source data are provided as a Source Data file.
Fig. 9
Fig. 9. Model of SURF2 function in free 5S RNP regulation.
Schematic representation of free 5S regulation by SURF2 in different conditions. a In normal cells, both 5S and 47S rDNAs are transcribed by RNA polymerase III and I, respectively. Ribosome synthesis is producing pre-60S ribosomes and 5S particles constituted by the association of RPL5 and RPL11 to 5S rRNA are incorporated into these large pre-ribosomes. The remaining overproduced free 5S are bound by SURF2 to avoid MDM2-Free 5S interaction, which would induce p53 stabilization and cell cycle arrest. At the same time, p53 is constantly ubiquitinated by MDM2 to promote its degradation by the proteasome. b After nucleolar stress (drug-induced or caused by genetic mutations/ribosomopathies), ribosome synthesis is impaired, and a larger amount of free 5S particles accumulate in the nucleoplasm. The extra free 5S particles can then be recognized by MDM2, which can no longer ubiquitinylate p53, thereby stabilizing p53 and promoting cell cycle arrest. c In cells lacking SURF2, nucleolar stress still impairs ribosome synthesis, but this time, even more, free 5S RNPs are able to bind to MDM2, inducing stronger stabilization and activation of p53, followed by more cell cycle arrest. d In contrast, in cells overexpressing SURF2, nucleolar stress promotes free 5S RNP accumulation in the nucleoplasm, all of which are recognized by SURF2, which competes with MDM2 for binding. As a result, MDM2 is free and ubiquitinylates p53, conferring to these cells a capacity to resist to nucleolar stress.

References

    1. Zhong, L. et al. Small molecules in targeted cancer therapy: advances, challenges, and future perspectives. Signal Transduct. Target Ther.6, 201 (2021). - PMC - PubMed
    1. Sabnis, A. J. & Bivona, T. G. Principles of resistance to targeted cancer therapy: Lessons from basic and translational cancer biology. Trends Mol. Med.25, 185–197 (2019). - PMC - PubMed
    1. Montanaro, L., Treré, D. & Derenzini, M. Nucleolus, ribosomes, and cancer. Am. J. Pathol.173, 301–310 (2008). - PMC - PubMed
    1. Derenzini, M. et al. Nucleolar size indicates the rapidity of cell proliferation in cancer tissues. J. Pathol.191, 181–186 (2000). - PubMed
    1. Henras, A. K. et al. The post-transcriptional steps of eukaryotic ribosome biogenesis. Cell. Mol. Life Sci.65, 2334–2359 (2008). - PMC - PubMed

Publication types

MeSH terms

Associated data