. 2024 Sep 27;15(1):8400.
doi: 10.1038/s41467-024-52231-7.

Understanding species-specific and conserved RNA-protein interactions in vivo and in vitro

Affiliations

Understanding species-specific and conserved RNA-protein interactions in vivo and in vitro

Sarah E Harris et al. Nat Commun. .

Abstract

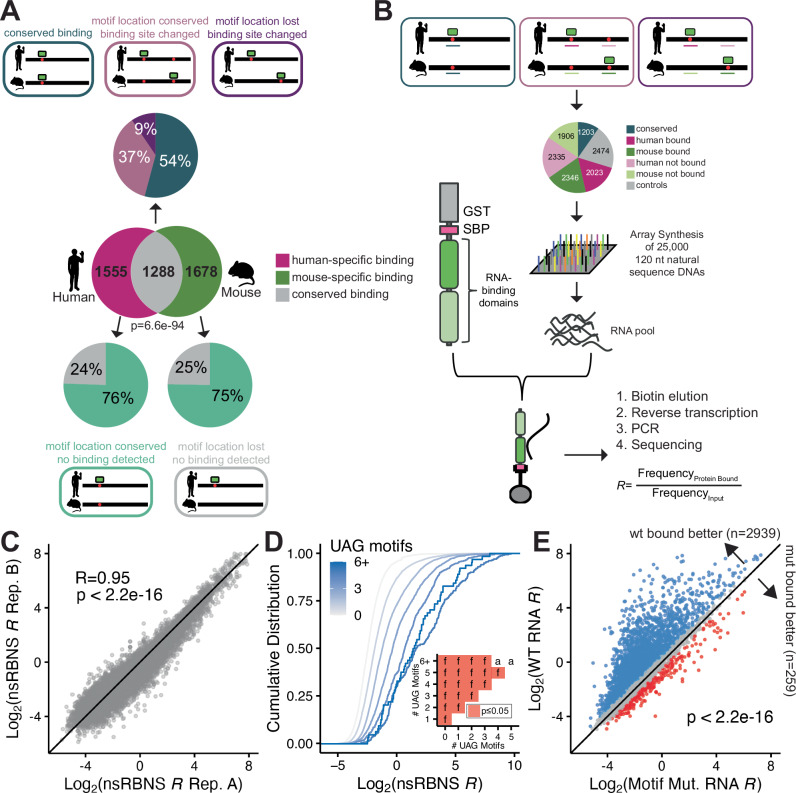
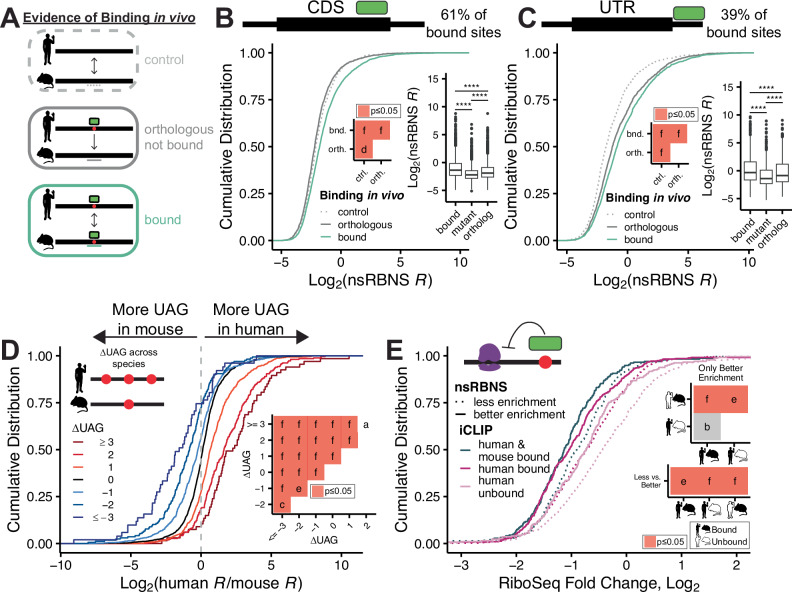
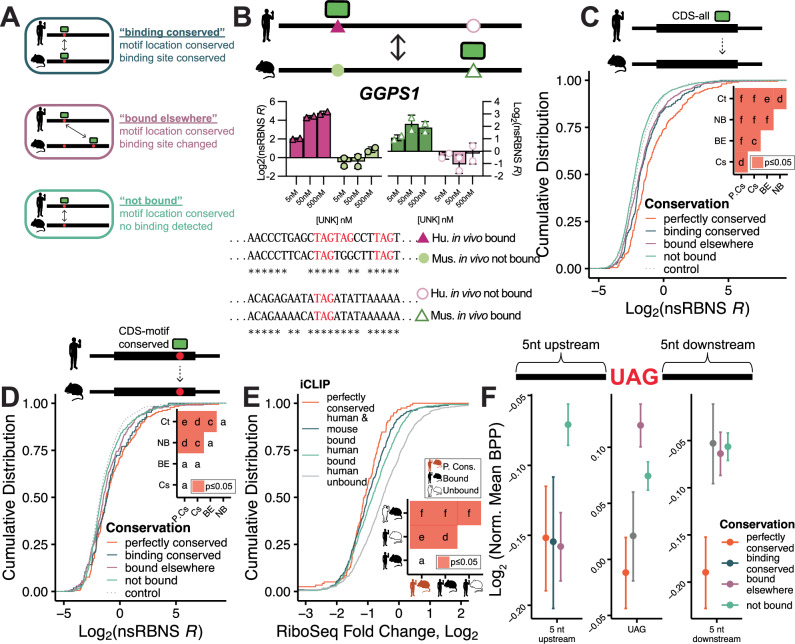
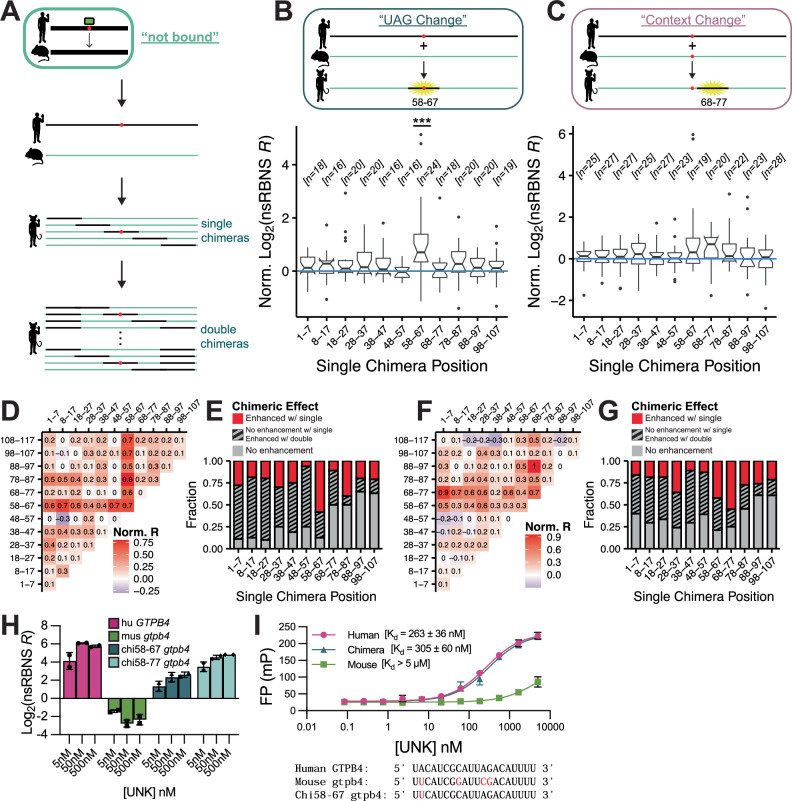
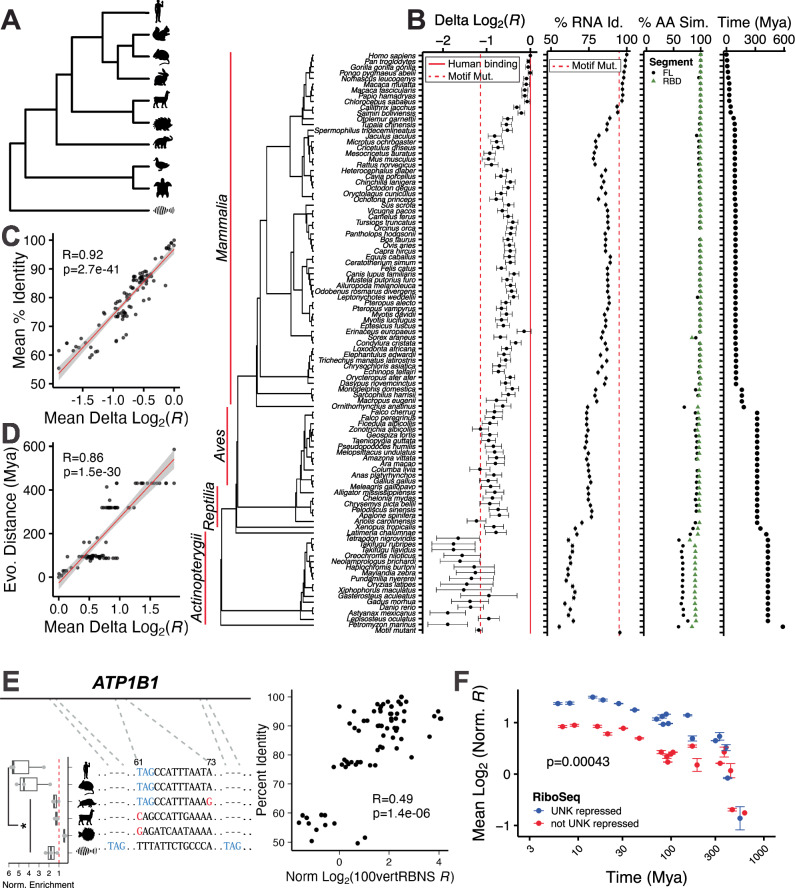
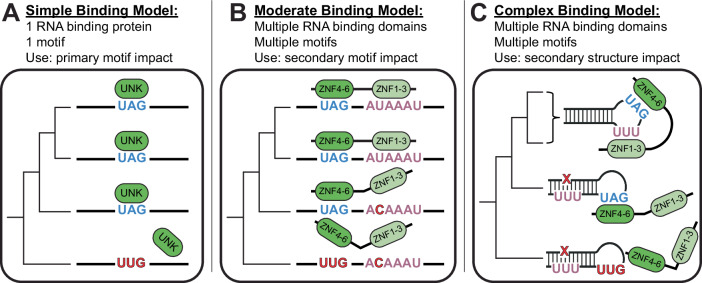
While evolution is often considered from a DNA- and protein-centric view, RNA-based regulation can also impact gene expression and protein sequences. Here we examine interspecies differences in RNA-protein interactions using the conserved neuronal RNA-binding protein, Unkempt (UNK) as model. We find that roughly half of mRNAs bound in human are also bound in mouse. Unexpectedly, even when transcript-level binding was conserved across species differential motif usage was prevalent. To understand the biochemical basis of UNK-RNA interactions, we reconstitute the human and mouse UNK-RNA interactomes using a high-throughput biochemical assay. We uncover detailed features driving binding, show that in vivo patterns are captured in vitro, find that highly conserved sites are the strongest bound, and associate binding strength with downstream regulation. Furthermore, subtle sequence differences surrounding motifs are key determinants of species-specific binding. We highlight the complex features driving protein-RNA interactions and how these evolve to confer species-specific regulation.


Conflict of interest statement

The authors declare no competing interests.

Figures

Fig. 1
Fig. 1. Design and validation of natural sequence RNA bind-n-seq (nsRBNS).
A (Venn diagram) Transcript-level conservation of iCLIP UNK hits between human neuronal cells (SH-SY5Y) and mouse brain tissue. Significance determined via hypergeometric test. (Pie charts) Motif level conservation of iCLIP UNK hits between human neuronal cells (SH-SY5Y) and mouse brain tissue. B Design of natural sequence oligo pool and layout of nsRBNS. C Correlation plot of two experimental UNK nsRBNS replicates. Pearson’s correlation coefficient and p val included. D Cumulative distribution function of log2 nsRBNS enrichment of all oligos separated by UAG motif content. Inset shows significance values for all comparisons via two-sided KS test and corrected for multiple comparisons via the BH procedure. Red denotes significant (p ≤ 0.05). Values are as follows: a (ns), f (p ≤ 0.0001). E Scatter plot of log2 nsRBNS enrichment of wild-type (Y-axis) versus motif mutant (X-axis) oligos. Log2 change in enrichment (wt-mut) was calculated for each sequence pair: >0.5 defined as bound better in wt (blue), <−0.5 defined as bound better in mut (red), 0 ± 0.5 defined as similar binding (grey). Significance determined via paired, one-sided Wilcoxon test.
Fig. 2
Fig. 2. Analysis of species-specific binding patterns.
A Schematic of “control,” “orthologous,” and “bound” oligo classes used for species-specific transcript-level binding analysis. B, C Cumulative distribution function of log2 nsRBNS enrichment of all iCLIP hits: control (light grey; dotted), orthologous (dark grey), and bound (teal) of (B) CDS and (C) UTR oligos. Inset boxplots show in vitro binding patterns for “bound,” “motif mutant,” and “orthologous” oligos. Significance of inset boxplots was determined via two-sided paired Wilcoxon test (n = 1373 sequences in (B) and 987 sequences in (C)). Significance marks are as follows: ****(p ≤ 0.0001). Centre line denotes median (50th percentile) with bounds of box representing 25th to 75th percentiles and the whiskers denoting 5th to 95th percentiles. Outliers are denoted as individual points. Inset heatmaps show significance values for all comparisons via two-sided KS test and corrected for multiple comparisons via the BH procedure for the cumulative distribution curves. Red denotes significant (p ≤ 0.05). Values are as follows: d (p ≤ 0.01), f (p ≤ 0.0001). D Cumulative distribution function of log2 fold nsRBNS enrichment change of in vivo bound over in vivo not bound oligos separated by ∆UAG content. Inset shows significance values for all comparisons via two-sided KS test and corrected for multiple comparisons via the BH procedure. Red denotes significant (p ≤ 0.05). Values are as follows: a (ns), c (p ≤ 0.05), e (p ≤ 0.001), f (p ≤ 0.0001). E Cumulative distribution function of RiboSeq fold change, log2 separated via iCLIP detection. nsRBNS enrichment cutoffs defined as “less enrichment” <1 and “better enrichment” >1. Insets show significance values for all comparisons via two-sided KS test and corrected for multiple comparisons via the BH procedure. Grey denotes nearing significance (p ≤ 0.1). Red denotes significant (p ≤ 0.05). Values are as follows: b (p ≤ 0.1), e (p ≤ 0.001), f (p ≤ 0.0001).
Fig. 3
Fig. 3. Analysis of species-specific syntenic motif level binding patterns.
A Definition of binding conserved, bound elsewhere, and not bound oligo classes used for species-specific transcript regional binding analysis. B Conservation and binding of GGPS1 orthologous pairs. (left) Log2 nsRBNS enrichment values from nsRBNS for human bound (purple triangle), mouse not bound (light green circle), mouse bound (green open triangle), and human not bound (light purple open circle) (n = 2). (right) Alignment of human bound (purple triangle) to mouse not bound (light green circle) and mouse bound (green open triangle) to human not bound (purple open circle). Note: full oligos were used for alignment, but only the central region is shown. C, D Cumulative distribution function of log2 nsRBNS enrichment of control (light grey; dotted), not bound (teal), bound elsewhere (purple), binding conserved (blue), and perfectly conserved (orange) C all CDS and D motif conserved CDS oligos. Insets show significance values for all comparisons via two-sided KS test and corrected for multiple comparisons via the BH procedure. Red denotes significant (p ≤ 0.05). Values are as follows: a (ns), c (p ≤ 0.05), d (p ≤ 0.01), e (p ≤ 0.001), f (p ≤ 0.0001). E Cumulative distribution function of RiboSeq fold change, log2 separated via iCLIP detection and sequence conservation. Inset shows significance values for all comparisons via two-sided KS test and corrected for multiple comparisons via the BH procedure. Red denotes significant (p ≤ 0.05). Values are as follows: a (ns), d (p ≤ 0.01), e (p ≤ 0.001), f (p ≤ 0.0001). F Log2 fold change of mean base pair probability of the central region of perfectly conserved (n = 221 sequences), binding conserved (n = 155 sequences), bound elsewhere (n = 574 sequences), and not bound (n = 1395 sequences) oligos normalized to UAG-containing CDS controls (see “Methods”). Error bars show standard error of the mean.
Fig. 4
Fig. 4. Analysis of regional impacts on binding.
A Design of single and double chimera oligos. B Design and box and whisker plot of normalized log2 nsRBNS enrichment (chimera/wt) for UAG Change single chimeras. Significance was determined via paired, one-sided Wilcoxon test and corrected for multiple comparisons via the BH procedure. Chimerization at positions 58–67 was found to be significant (p = 0.0005). Centre line denotes median (50th percentile) with bounds of box representing 25th to 75th percentiles and the whiskers denoting 5th to 95th percentiles. Outliers are denoted as individual points. C Design and box and whisker plot of normalized log2 nsRBNS enrichment (chimera/wt) for Context Change single chimeras. Significance was determined via paired, one-sided Wilcoxon test and corrected for multiple comparisons via the BH procedure. Following multiple comparison correction, no positions were determined to be significant. Centre line denotes median (50th percentile) with bounds of box representing 25th to 75th percentiles and the whiskers denoting 5th to 95th percentiles. Outliers are denoted as individual points. D Heat map of median normalized log2 nsRBNS enrichment (chimera/wt) for UAG Change single and double chimeras. E Fraction of UAG Change chimeras enhanced with binding after single (red) or double (grey, striped) chimerization. F Heat map of median normalized log2 nsRBNS enrichment (chimera/wt) for “Context Change” single and double chimeras. G Fraction of Context Change chimeras enhanced with binding after single (red) or double (grey, striped) chimerization. H Log2 nsRBNS enrichment values (n = 2) for human, mouse, single chimera, and double chimera GTPB4 at 5, 50, and 500 nM UNK. Data are presented as mean values ± SD. I Fluorescence polarization binding curves (n = 3) for human GTPB4 (purple circle), mouse gtpb4 (green square), and chi58-67 gtpb4 (blue triangle) RNA oligos incubated with UNK. Data are presented as mean values ± SD.
Fig. 5
Fig. 5. Evolutionary conservation of binding.
A Simplified tree schematic of vertebrates used for natural sequence RBNS (not all species shown). B Delta log2 100vertRBNS enrichment, percent RNA sequence identity, percent UNK similarity (full length-grey and RBDs-green), and evolutionary distance in millions of years against 100 vertebrates for the aligned sequences from the top human bound oligos. Red dotted line shows average for total motif mutant. Red solid line shows average for human binding. Error bars show standard error of the mean (SEM). C Mean percent RNA sequence identity (Y axis) versus mean delta log2 100vertRBNS enrichment (X axis) for each aligned oligo. Pearson’s correlation coefficient and pval included. Line is presented as mean fit ± SEM. D Evolutionary distance in millions of years (Y axis) versus mean delta log2 100vertRBNS enrichment (X axis) for each aligned oligo. Pearson’s correlation coefficient and pval included. Line is presented as mean fit ± SEM. E (left) Multiple sequence alignment for ATP1B1 for Homo sapiens, Mus musculus, Sus scrofa, Vicugna pacos, Tetradon nigroviridis, and Danio rerio with normalized 100vertRBNS enrichment by species (n = 3). Significance determined via one-sided, paired Wilcoxon tests. Significance marks are as follows: * (p ≤ 0.05). Centre line denotes median (50th percentile) with bounds of box representing 25th to 75th percentiles and the whiskers denoting 5th to 95th percentiles. All data included as individual points. (right) Percent RNA sequence identity (Y axis) versus normalized delta log2 100vertRBNS enrichment (X axis). Pearson’s correlation coefficient and pval included. F Scatter plot of log2 normalized 100vertRBNS enrichment by evolutionary distance. X axis plotted on log10 scale. Error bars show SEM. Data were separated by regulation as determined via RiboSeq where blue reflects UNK repression of translation [higher than average log2 fold change (>−0.9)] and red reflects lack of UNK repression [less than average log2 fold change (<−0.9)]. Significance was determined via a two-sided KS test.
Fig. 6
Fig. 6. Models of RNA binding.
A Simple binding model: considers only primary motifs. B Moderate binding model: considers primary and secondary motifs. C Complex binding model: considers primary and secondary motifs as well as RNA secondary structure.

Update of

References

    1. Wagner, A. Robustness and evolvability: a paradox resolved. Proc. R. Soc. B: Biol. Sci.275, 91–100 (2008). - PMC - PubMed
    1. Masel, J. & Trotter, M. V. Robustness and evolvability. Trends Genet.26, 406–414 (2010). - PMC - PubMed
    1. King, M.-C. & Wilson, A. C. Evolution at two levels in humans and chimpanzees: their macromolecules are so alike that regulatory mutations may account for their biological differences. Science188, 107–116 (1975). - PubMed
    1. Britten, R. J. & Davidson, E. H. Gene regulation for higher cells: a theory: new facts regarding the organization of the genome provide clues to the nature of gene regulation. Science165, 349–357 (1969). - PubMed
    1. Britten, R. J. & Davidson, E. H. Repetitive and non-repetitive DNA sequences and a speculation on the origins of evolutionary novelty. Q Rev. Biol.46, 111–138 (1971). - PubMed

Publication types

Associated data