. 2024 Sep 27;15(1):8291.
doi: 10.1038/s41467-024-52731-6.

A climate change signal in the tropical Pacific emerges from decadal variability

Affiliations

A climate change signal in the tropical Pacific emerges from decadal variability

Feng Jiang et al. Nat Commun. .

Abstract

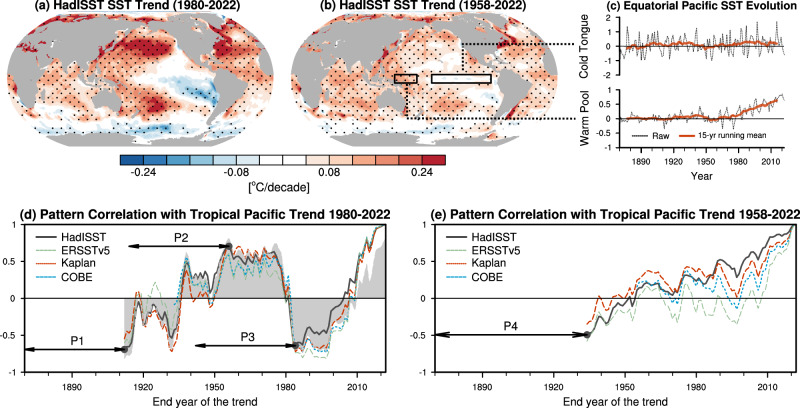
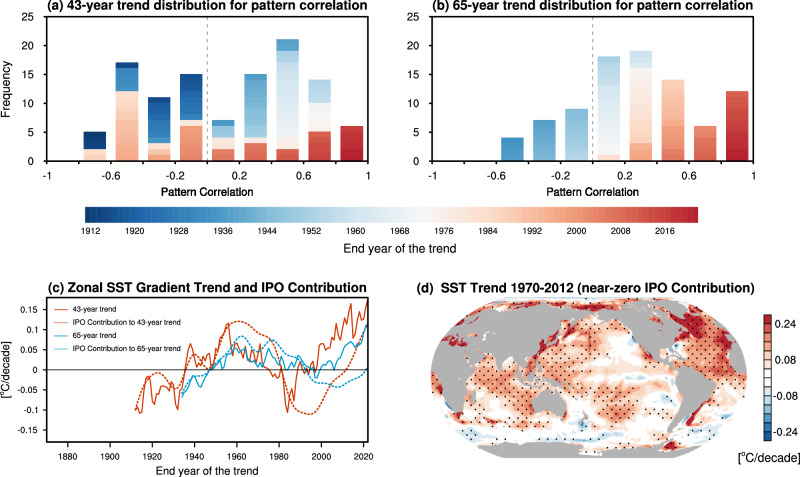
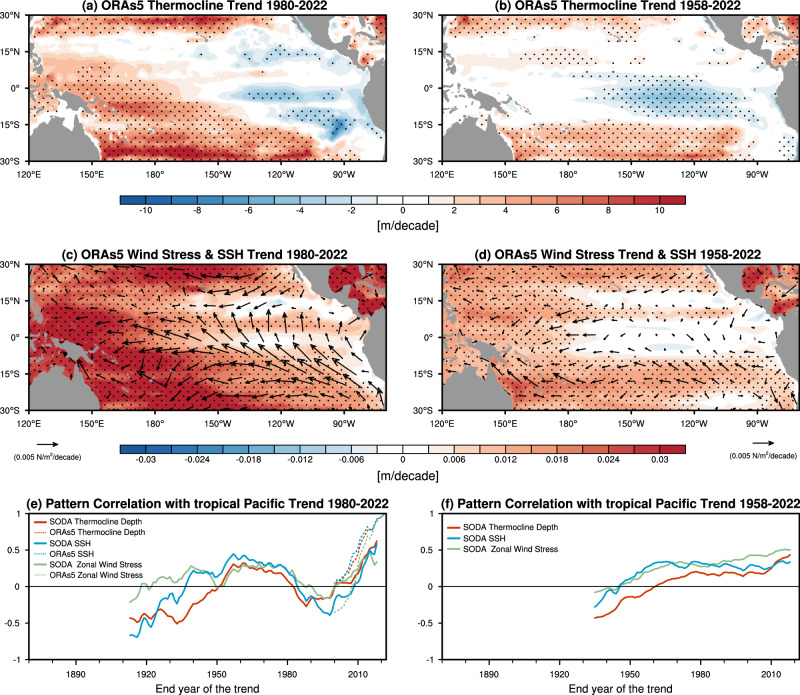
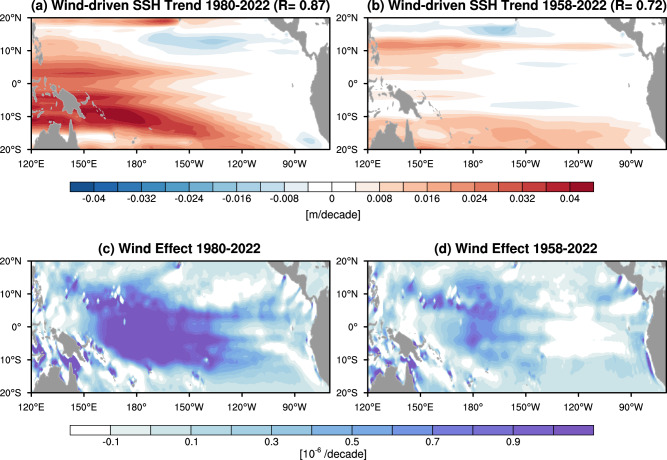
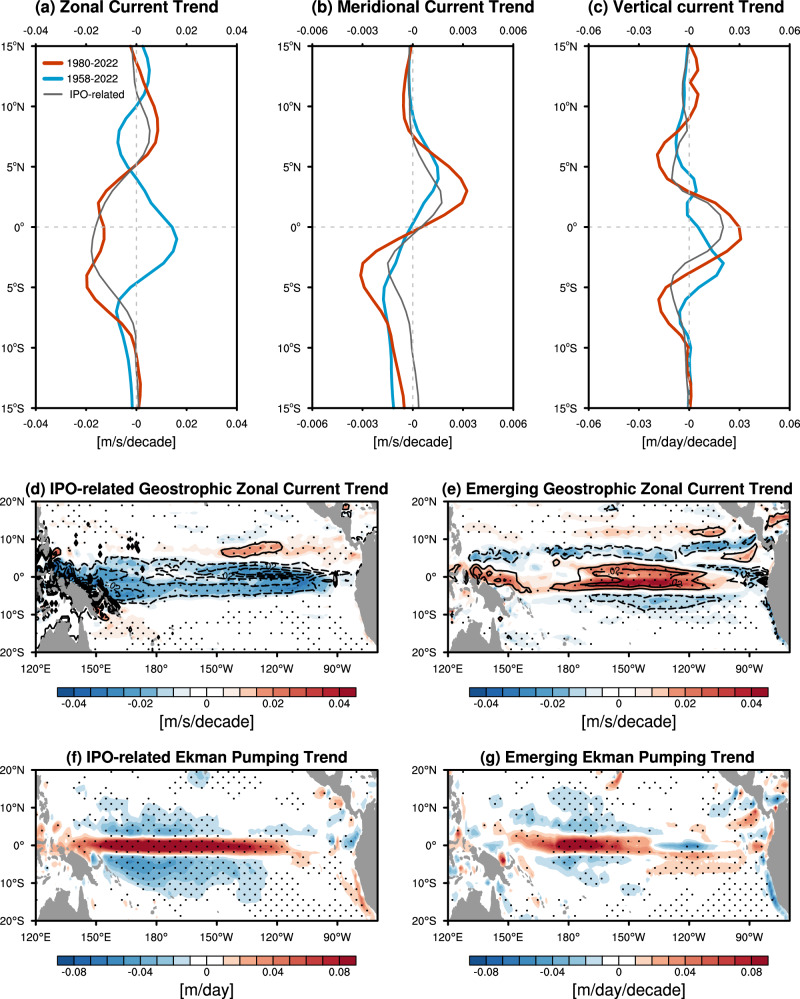
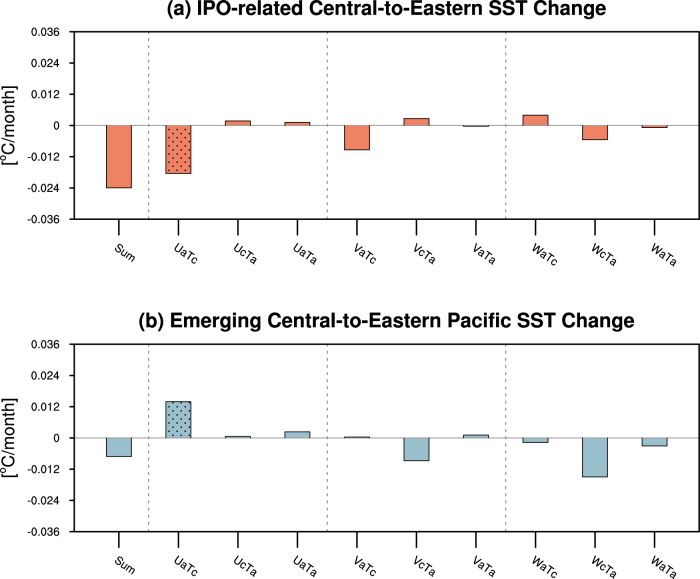
The eastern tropical Pacific has defied the global warming trend. There has been a debate about whether this observed trend is forced or natural (i.e., the Interdecadal Pacific Oscillation; IPO) and this study shows that there are two patterns, one that oscillates along with the IPO, and one that is emerging since the mid-1950s, herein called the Pacific Climate Change (PCC) pattern. Here we show these have distinctive and distinguishable atmosphere-ocean signatures. While the IPO features a meridionally broad wedge-shaped SST pattern, the PCC pattern is marked by a narrow equatorial cooling band. These different SST patterns are related to distinct wind-driven ocean dynamical processes. We further show that the recent trends during the satellite era are a combination of IPO and PCC. Our findings set a path to distinguish climate change signals from internal variability through the underlying dynamics of each.


Conflict of interest statement

The authors declare no competing interests.

Figures

Fig. 1
Fig. 1. Recurrent and emerging sea surface temperature (SST) trend patterns in the tropical Pacific.
The SST trend (°C per decade) based on HadISST during (a) 1980–2022 and (b) 1958–2022. Dots in (a, b) indicate the trend exceeding the 95% confidence level. c Timeseries of raw (black dashed lines) and 15-year running mean (red solid lines) annual-mean SST anomalies in the cold tongue (top panel; 5°S–5°N, 190°W–270°W) and the warm pool (bottom panel; 5°S–5°N, 140°E–170°W). The SST anomalies were calculated relative to the climatology of the first 50 years (1870–1919). d Pattern correlations of 43-year SST trends in the tropical Pacific region (30°S–30°N, 120°E–270°W) in historical period with the trend during 1980–2022 based on HadISST (black solid line), ERSSTv5 (green dashed line), Kaplan (red dotted line) and COBE (blue dashed line). Shading in (d) indicates pattern correlations of 43-year SST trends in the tropical Pacific region with the Interdecadal Pacific Oscillation (IPO) pattern based on HadISST. e Similar to (d) but for 65-year SST trends with the trend during 1958–2022. Arrows labeled P1 (1870–1912), P2 (1914–1956) and P3 (1942–1984) indicate the periods with strongest positive and negative correlations in (d) and P4 (1870–1934) with strongest negative correlation in (e).
Fig. 2
Fig. 2. Quantification of internally-generated and emerging Pacific Climate Change (PCC) sea surface temperature (SST) trends.
a Histograms of pattern correlations of 43-year SST trend patterns over the tropical Pacific (30°S–30°N, 120°E–270°W) in historical period with that during 1980–2022. b Similar to (a) but for the 65-year SST trend. c Quantification of the Interdecadal Pacific Oscillation (IPO)’s contribution to the trend of zonal SST gradient in the equatorial Pacific (see Methods). The red solid line indicates the 43-year trend, and the red dashed line indicates the IPO’s contribution. Similarly, the blue solid line and dashed line indicate the 65-year trend and the IPO’s contribution, respectively. d The 43-year SST trend (°C per decade) in 1970–2012 with near-zero IPO contribution. Dots in (d) indicate the trend exceeding the 95% confidence level.
Fig. 3
Fig. 3. Recurrent and emerging signals in thermocline depth, surface wind stress and sea surface height (SSH).
The thermocline depth trend (m/decade) based on ORAs5 subsurface temperature during (a) 1980–2022 and (b) 1958–2022. The surface wind stress (vectors; N/m2) and SSH (contours; m/decade) trend during (c) 1980–2022 and (d) 1958–2022. Dots in (a, b) and (c, d) indicate the trend in thermocline depth and SSH exceeding the 95% confidence level, respectively. e Pattern correlations of 43-year trend patterns in historical period for the thermocline depth (red lines), SSH (blue lines) and zonal wind stress (green lines) in the tropical Pacific region (30°S–30°N, 120°E–270°W) based on SODA (solid lines) and ORAs5 (dashed lines) with the corresponding trend during 1980–2022 based on ORAs5. f Similar to (e) but for 65-year trend with the trend during 1958–2022 based on SODA.
Fig. 4
Fig. 4. Wind-driven sea surface height (SSH) change for decadal variability and climate change.
The wind stress-driven SSH trend (m per decade) during (a) 1980–2022 and (b) 1958–2022 based on Eq. (6). The pattern correlations between the wind stress-driven and observed SSH trend pattern over the region of 20°S–20°N, 120°E–270°W are also displayed. The wind stress effect (m per decade) at each grid point (defined as B=fρ0gh¯curl(τf), in Eq. (6)) during (c) 1980–2022 and (d) 1958–2022. The integrated wind stress effect from the eastern boundary in combination with the damping effect yields the wind stress-driven SSH change pattern.
Fig. 5
Fig. 5. Ocean dynamics for differences in ocean current trend patterns.
Zonal mean (3°S–3°N) trend of (a) surface zonal current (m/s per decade), (b) upper 50-m averaged meridional current (m/s per decade) and (c) vertical current at the 50-m depth (m/day per decade) over the tropical central-to-eastern Pacific (150°E–90°W) during 1980–2022 (blue lines) and 1958–2022 (red lines). The Interdecadal Pacific Oscillation (IPO)-related trend during 1980–2022 in surface zonal current (m/s per decade), upper 50-m averaged meridional current (m/s per decade) and vertical current at the 50-m depth (m/day per decade) are also shown in gray lines for comparison (see details for IPO-related trends in Methods). d The IPO-related trend during 1980–2022 in surface zonal current (shadings; m/s per decade) and its geostrophic component (ug outside the equatorial region and usg at the equator; contours; m/s per decade, at 0.01 m/s intervals with the zero line omitted) calculated based on Eqs. (7–8) using ORAs5 data. e The surface zonal current trend (shadings; m/s per decade) and its geostrophic component during 1958–2022 (contours; m/s per decade, at 0.01 m/s per decade intervals with the zero line omitted). Dots in (d, e) indicate the observed trend exceeding the 95% confidence level. f, g Similar to (d, e) but for the Ekman pumping (wE) calculated based on Eqs. (9–11). Dots in (f, g) indicate the values exceeding the 95% confidence level.
Fig. 6
Fig. 6. Ocean dynamics for the central-to-eastern Pacific cooling linked to the Interdecadal Pacific Oscillation (IPO) and the Pacific Climate Change (PCC).
Heat budget terms for the mixed layer temperature averaged over the eastern equatorial Pacific (5°S–5°N, 190°W–270°W; left box in Fig. 1b) including ocean current change (UaTc, VaTc, WaTc), temperature gradient change (UcTa, VcTa, WcTa), nonlinear terms (UaTa, VaTa, WaTa) and their sum (SUM) related to (a) the IPO-related and (b) the emerging PCC-related sea surface temperature (SST) trend (°C/month per decade; see Mixed layer heat budget analysis for the long-term SST Change in Methods for detailed explanation). Dotted bars indicate heat budget terms exceeding 90% significance tests.

Similar articles

References

    1. Cane, M. A. et al. Twentieth-Century sea surface temperature trends. Science275, 957–960 (1997). - PubMed
    1. Zhang, W., Li, J. & Zhao, X. Sea surface temperature cooling mode in the Pacific cold tongue. J. Geophys. Res.115, 2010JC006501 (2010).
    1. Karnauskas, K. B., Seager, R., Kaplan, A., Kushnir, Y. & Cane, M. A. Observed strengthening of the Zonal Sea surface temperature gradient across the equatorial Pacific Ocean. J. Clim.22, 4316–4321 (2009).
    1. Solomon, A. & Newman, M. Reconciling disparate twentieth-century Indo-Pacific ocean temperature trends in the instrumental record. Nat. Clim. Change2, 691–699 (2012).
    1. Seager, R. et al. Strengthening tropical Pacific zonal sea surface temperature gradient consistent with rising greenhouse gases. Nat. Clim. Chang.9, 517–522 (2019).

LinkOut - more resources