. 2024 Sep 27;14(1):22277.
doi: 10.1038/s41598-024-73221-1.

Optokinetic response in D. melanogaster reveals the nature of common repellent odorants

Affiliations

Optokinetic response in D. melanogaster reveals the nature of common repellent odorants

Giulio Maria Menti et al. Sci Rep. .

Abstract

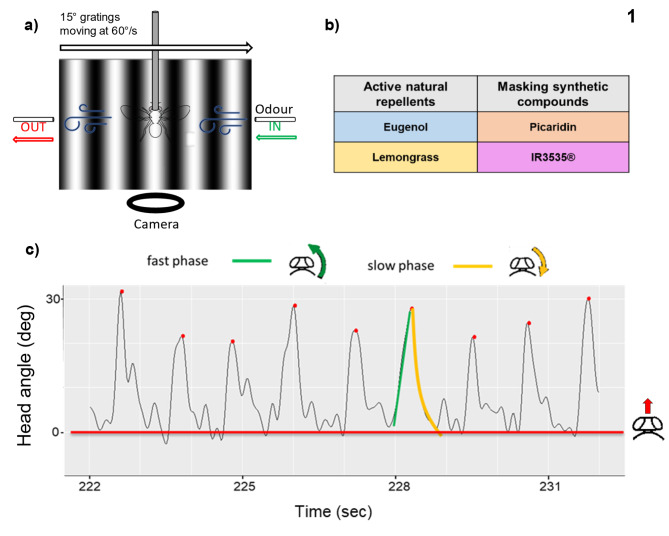
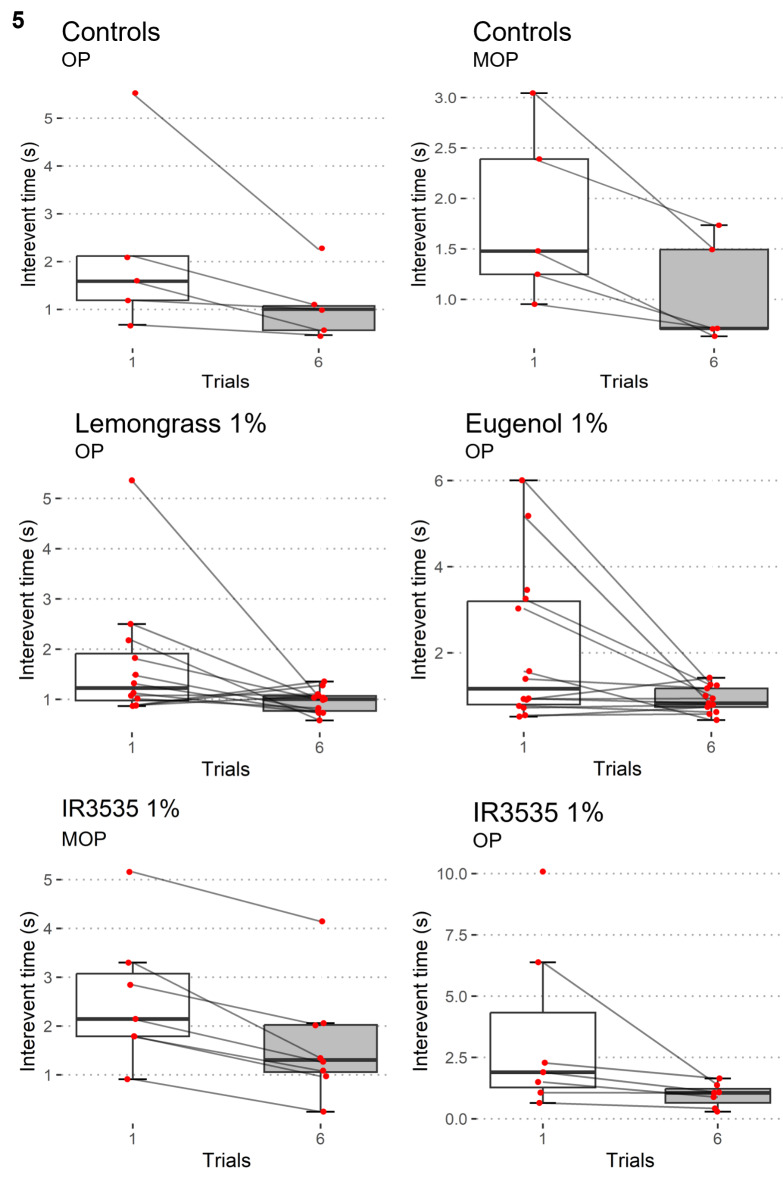
Animals' ability to orient and navigate relies on selecting an appropriate motor response based on the perception and integration of the environmental information. This is the case, for instance, of the optokinetic response (OKR) in Drosophila melanogaster, where optic flow visual stimulation modulates head movements. Despite a large body of literature on the OKR, there is still a limited understanding, in flies, of the impact on OKR of concomitant, and potentially conflicting, inputs. To evaluate the impact of this multimodal integration, we combined in D. melanogaster, while flying in a tethered condition, the optic flow stimulation leading to OKR with the simultaneous presentation of olfactory cues, based on repellent or masking compounds typically used against noxious insect species. First, this approach allowed us to directly quantify the effect of several substances and of their concentration on the dynamics of the flies' OKR in response to moving gratings by evaluating the number of saccades and the velocity of the slow phase. Subsequently, this analysis was capable of easily revealing the actual effect, i.e. masking vs. repellent, of the compound tested. In conclusion, we show that D. melanogaster, a cost-affordable species, represents a viable option for studying the effects of several compounds on the navigational abilities of insects.

Keywords: Drosophila melanogaster; Navigation; Optokinetic response; Repellents.


Conflict of interest statement

The authors declare no competing interests.Entostudio S.r.l. is not involved in the production nor the distribution of any of the tested compounds and did not receive any funding related to the present article. The work presented in this paper was funded by the PON - DM 1061 PhD scholarship from Italian Ministry for University and Research (MUR) assigned to Menti G. M., the Università degli Sudi di Padova’s DOR funding to Megighian A., and the PRIN 2020 funding from MUR to Megighian A. and dal Maschio M.

Figures

Fig. 1
Fig. 1
Experimental paradigm. (a) Setup scheme: the whole apparatus is placed in a dark chamber and the illumination is achieved through infra-red LEDs. The fly is glued to a pin by the thorax and is placed on a fixed support (unable to rotate around the z-axis). A screen for projecting the visual stimuli (gratings pattern drifting to the right of the animal at 60 deg·s−1) is placed in front of the fly. The fly is suspended inside a continuous air flow, administered through one delivery and one recycle tube placed at 1 cm to the right and 2 cm to the left of the fly respectively; the air flow moves right to left, opposite to the visual stimulus (left to right). The camera is placed below the animal. (b) Tested compounds: we chose 4 substances classified by their nature and known mechanism of action. Two compounds are natural repellents with an active repulsing effect on insects (eugenol and lemongrass). The other two are synthetized substances (picaridin and IR3535) with a masking action mechanism, binding and making less volatile the molecules they are mixed with. (c) HOKN identification: we identified the onset of HOKN events by the peaks corresponding to the end of the flies’ reset head-saccades (fast phase). As the fly experiences and follows the optic flow (OF) generated by the frontal drifting visual stimulus, its head can reach the resting position (red line and arrow), or surpass it, getting closer to its angular limit. Then, a reset saccade occurs, allowing the fly to keep pursuing the OF. HOKNs are characterized by a slow phase (gold), a pursuit movement concordant with the OF, followed by a rapid reset saccade, the fast phase (green), in the opposite direction of the moving visual stimulus. As reported in the Methods, we identified the HOKNs by tagging the peaks in the raw tracks of the head position with the ‘find peaks’ function in MATLAB and extracted the velocities of the slow phase ((peak location + 18 frames)/time) and the fast phase ((peak location − 5 frames)/time, not analysed).
Fig. 2
Fig. 2
Raw recordings. Zoom of the 4th trial for one raw track from each group: each track shows a visible change in the number and/or inter-saccadic intervals in between events, as reported further down the result section, during the Mineral Oil Phase (MOP), when no odour is present, or the Odorant Phase (OP), when repellents are delivered to the fly. The shown paradigm was repeated six times, for a total of 600 s in each experiment (one fly). The 0° angle corresponds to the fly’s straight head position with respect to the body axis, while positive shifts indicate head left turns (away from the direction the gratings are moving) and negative ones correspond to right turns (concordant with the gratings movement). The corresponding full tracks are plotted in Supplementary Fig. 1.
Fig. 3
Fig. 3
HOKNs number and proportion. The bar plot shows the relative proportion of MOP and OP HOKNs normalised on the MOP to the flies’ number in each group; values in bold within each bar refer to the total number of HOKN identified during each phase in each group. p-values result from multiple 2-sample tests for equality of proportion with continuity correction, to verify if the observed differences in proportions between MOP and OP differed significantly from the C group and between the two concentrations within each group. ***p < 0.001, **p < 0.01, *p < 0.1.
Fig. 4
Fig. 4
ISI distribution. The plots show the distribution of the ISI in the four groups, following the same colour scheme from the above figures. The lesser concentrations are represented by the lighter colours, and the MOP and OP are shown as dashed or continuous lines, respectively. The continuous reference black lines represent the whole Control group’s ISI, unsplit into MOP and OP since there was no statistically significant difference between the two. Statistical analysis was achieved through a 2 W-ANOVA followed by a post-hoc Games-Howell test (the relevant p-values are reported in the main text ‘Inter-saccadic interval increases in the presence of the repellent’ section). Density is normalised over the entire range of ISI values, so that the total probability under the curve equals 1: density values are not direct probabilities, but rather indicate the relative likelihood of the ISI values.
Fig. 5
Fig. 5
Mean ISI values between the 1st and 6th trials. Standard boxplots representing the median ISI values divided by trial and mediated by subject (only statistically significant comparisons from Wilcoxon singed-rank tests are shown).

References

    1. Farries, M. A. How basal are the basal ganglia? Brain Behav. Evol. 82, 211–214. 10.1159/000356101 (2013). - PubMed
    1. Moroz, L. L. On the independent origins of complex brains and neurons. Brain Behav. Evol. 74, 177–190. 10.1159/000258665 (2009). - PMC - PubMed
    1. Northcutt, R. G. Evolution of centralized nervous systems: Two schools of evolutionary thought. Proc. Natl. Acad. Sci. U.S.A. 109(Suppl), 10626–10633. 10.1073/pnas.1201889109 (2012). - PMC - PubMed
    1. Strausfeld, N. J. & Hirth, F. Homology versus convergence in resolving transphyletic correspondences of brain organization. Brain Behav. Evol. 82, 215–219. 10.1159/000356102 (2013). - PubMed
    1. Strausfeld, N. J. & Hirth, F. Deep homology of Arthropod Central Complex and Vertebrate basal ganglia. Science. 340, 157–161. 10.1126/science.1231828 (2013). - PubMed

MeSH terms

Substances

LinkOut - more resources