. 2024 Sep 28;14(1):22411.
doi: 10.1038/s41598-024-72470-4.

CNVoyant a machine learning framework for accurate and explainable copy number variant classification

Affiliations

CNVoyant a machine learning framework for accurate and explainable copy number variant classification

Robert J Schuetz et al. Sci Rep. .

Abstract

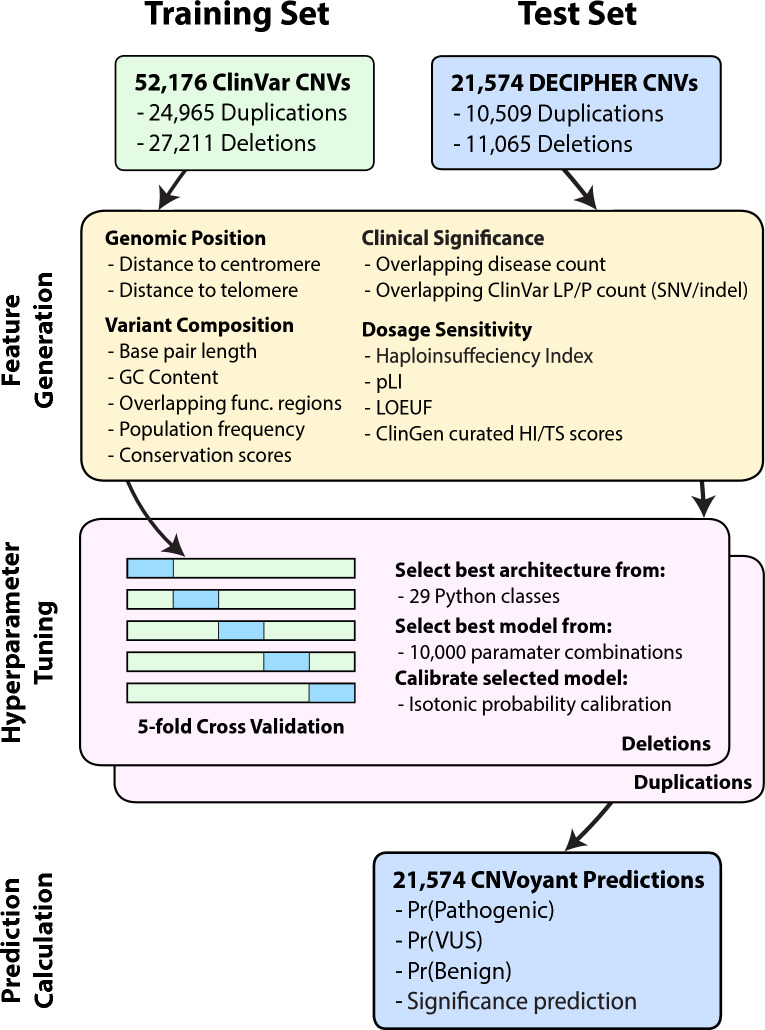
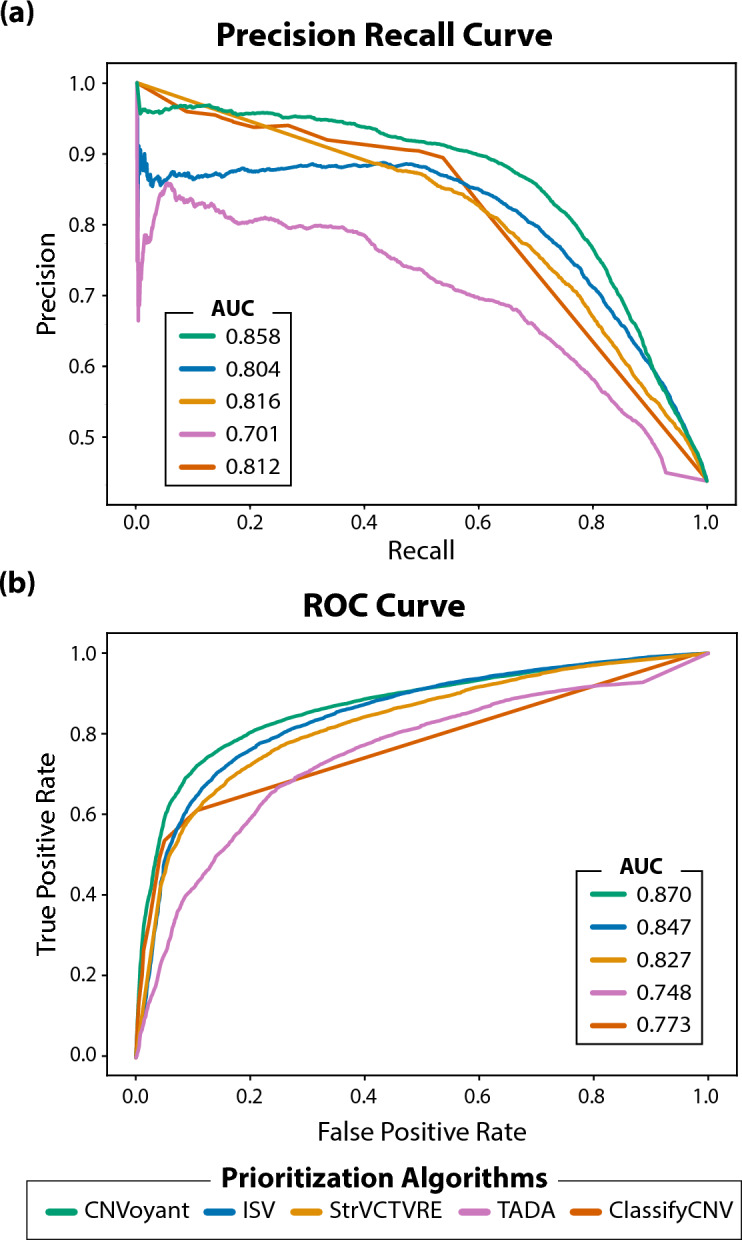
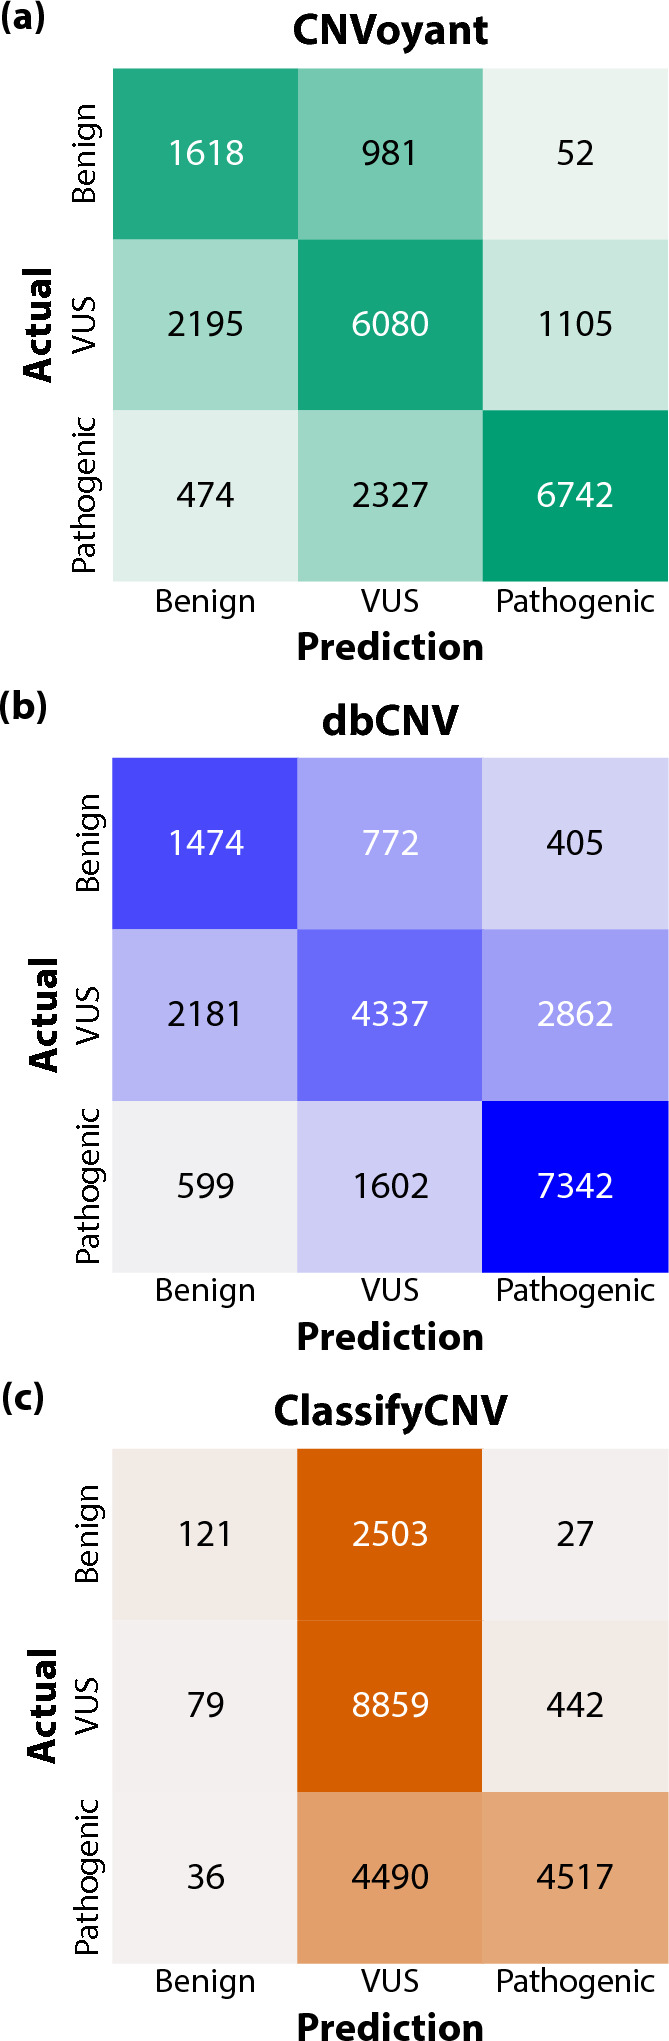
The precise classification of copy number variants (CNVs) presents a significant challenge in genomic medicine, primarily due to the complex nature of CNVs and their diverse impact on rare genetic diseases (RGDs). This complexity is compounded by the limitations of existing methods in accurately distinguishing between benign, uncertain, and pathogenic CNVs. Addressing this gap, we introduce CNVoyant, a machine learning-based multi-class framework designed to enhance the clinical significance classification of CNVs. Trained on a comprehensive dataset of 52,176 ClinVar entries across pathogenic, uncertain, and benign classifications, CNVoyant incorporates a broad spectrum of genomic features, including genome position, disease-gene annotations, dosage sensitivity, and conservation scores. Models to predict the clinical significance of copy number gains and losses were trained independently. Final models were selected after testing 29 machine learning architectures and 10,000 hyperparameter combinations each for deletions and duplications via fivefold cross-validation. We validate the performance of CNVoyant by leveraging a comprehensive set of 21,574 CNVs from the DECIPHER database, a highly regarded resource known for its extensive catalog of chromosomal imbalances linked to clinical outcomes. Compared to alternative approaches, CNVoyant shows marked improvements in precision-recall and ROC AUC metrics for binary pathogenic classifications while going one step further, offering multi-classification of clinical significance and corresponding SHAP explainability plots. Additionally, when provided germline CNV calls from real-world RGD cases with diagnostic CNV(s), CNVoyant correctly classified all diagnostic CNVs as having pathogenic significance with high confidence. This large-scale validation demonstrates CNVoyant's superior accuracy and underscores its potential to aid genomic researchers and clinical geneticists in interpreting the clinical implications of real CNVs.


Conflict of interest statement

The authors declare no competing interests.

Figures

Fig. 1
Fig. 1
CNVoyant development framework. The final CNVoyant models are a result of the illustrated machine learning pipeline and are designed to predict the pathogenicity of copy number variations (CNVs). The training set is comprised of 52,176 CNVs (24,965 duplications, 27,211 deletions) parsed from the January 2023 version of ClinVar, and the test set is comprised of 21,574 CNVs (10,509 duplications, 11,065 deletions) from DECIPHER v11.18. Features are generated from annotations related to genomic position, variant composition, clinical significance, and dosage sensitivity. Two models were trained to classify deletion and duplication events independently. Training data for each CNV type was partitioned into 5 cross folds. Accuracy metrics observed in each fold were utilized to (1) select the optimal architecture from 29 candidates, (2) select an optimal set of hyperparameters from 10,000 permutations, and (3) calibrate outputted probabilities to class distributions in the training data. The resulting models were used to generate probabilities of benign significance (Pr (Benign)), VUS (Pr (VUS)), and pathogenic significance (Pr (Pathogenic)) for CNVs in the test set. A clinical significance prediction is also provided by taking a maximum over the set of benign, VUS, and pathogenic probabilities. The CNVoyant output generated from the test set was later used for benchmarking.
Fig. 2
Fig. 2
Training and test set curation. CNVoyant was trained with copy number variants (CNVs) curated from ClinVar and tested on variants curated from DECIPHER. The flowcharts indicate the reasoning for omitting 2,002 variants from the training set (a) and 7,809 variants from the test set (b). For ClinVar, 6 CNVs were mapped to contigs other than autosomes or sex chromosomes, 1,126 had matching genomic coordinates and clinical significance, 572 had ambiguous clinical significance labels, 278 variants had matching genomic coordinates and conflicting clinical significance labels, and 20 spanned less than 50 base pairs. For DECIPHER, 712 CNVs had variant types other than “duplication” or “deletion”, 5,138 had matching genomic coordinates and clinical significance, 1,003 had matching genomic coordinates and conflicting clinical significance labels, 118 overlapped with values in the training set, and 38 spanned less than 50 base pairs.
Fig. 3
Fig. 3
Binary classification of pathogenic copy number variants. The performance of CNVoyant was compared to four algorithms (ISV, StrVCTVRE, TADA, ClassifyCNV) in the binary classification of pathogenic CNVs. The discriminative power of each algorithm is quantified using the area under the curve (AUC) from both (a) precision-recall (PR AUC) and (b) receiver operating characteristic (ROC AUC) curves. CNVoyant demonstrates superior performance in distinguishing pathogenic from non-pathogenic CNVs, achieving the highest PR AUC of 0.858, indicating its effectiveness in correctly identifying pathogenic CNVs with a high degree of precision and recall. The rankings for PR AUC performance are as follows: CNVoyant (0.858), StrVCTVRE (0.816), ClassifyCNV (0.812), ISV (0.804), and TADA (0.701). Similarly, CNVoyant leads in ROC AUC with a score of 0.870, showcasing its overall capability to accurately classify CNVs across different thresholds. The ROC AUC rankings are: CNVoyant (0.870), ISV (0.847), StrVCTVRE (0.827), ClassifyCNV (0.773), and TADA (0.748).
Fig. 4
Fig. 4
SHAP Beeswarm Plots for CNVoyant pathogenic classification. SHapley Additive exPlanations (SHAP) values are provided to illustrate the impact of genomic features on the machine learning classification of CNVs SHAP values offer a measure of each feature's contribution to the model's prediction, with higher absolute values indicating greater influence. Separate models were trained for (a) CNV deletions and (b) duplications; beeswarm plots are provided for each. Each point in the graph indicates a feature value for a specific training CNV. Positive SHAP values indicate that features support a pathogenic classification, and negative values detract from a pathogenic classification. The color intensity reflects the magnitude of feature values. Features are displayed in descending order by influence on the model's decision. Detailed feature descriptions are provided in the CNVoyant Feature Selection section of the Methods.
Fig. 5
Fig. 5
Multi-Class confusion matrices for CNV classification. This visualization presents confusion matrices for CNVoyant, dbCNV, and ClassifyCNV, showcasing the algorithms' ability to classify CNVs into multiple categories. The matrices illustrate the correlation between actual categories (row-wise) and predicted categories (column-wise), with color intensity indicating the proportion of observations normalized by the totals for actual labels. Darker shades denote higher proportions, highlighting the model’s classification capability per category. Ideally, a perfect classifier would have all observations along the diagonal line from the top left to the bottom right, indicating accurate category prediction for every observation. Among the algorithms capable of multi-class predictions, CNVoyant outperforms the others, demonstrating more precise classification across different CNV categories. Specifically, CNVoyant exhibits the most effective classification of benign and pathogenic CNVs, with F1 scores of 0.466 and 0.773, respectively. This compares favorably to dbCNV, with benign and pathogenic F1 scores of 0.427 and 0.729, and ClassifyCNV, with significantly lower scores of 0.084 for benign and 0.622 for pathogenic CNVs. Notably, while ClassifyCNV shows a preference for variants of uncertain significance (VUS) predictions with an F1 score of 0.689, it underperforms in benign CNV classification. CNVoyant not only leads in category-specific F1 scores but also achieves the highest overall accuracy rate of 0.669, indicating a greater proportion of correct predictions across all categories, compared to ClassifyCNV (0.626) and dbCNV (0.610). Additionally, CNVoyant maintains the highest average F1 score across categories (0.629), evidencing its superior balanced performance across benign, pathogenic, and VUS classifications, in contrast to dbCNV (0.565) and ClassifyCNV (0.465), which exhibit lower average F1 scores.

Update of

References

    1. O’Leary, N. A. et al. Reference sequence (RefSeq) database at NCBI: current status, taxonomic expansion, and functional annotation. Nucleic Acids Res.44, D733-45 (2016). - PMC - PubMed
    1. Howe, K. L. et al. Ensembl 2021. Nucleic Acids Res.49, D884-91 (2021). - PMC - PubMed
    1. Exome Aggregation Consortium, Lek M, Karczewski KJ, Minikel EV, Samocha KE, Banks E, et al. Analysis of protein-coding genetic variation in 60,706 humans. Nature. 2016;536:285–91. - PMC - PubMed
    1. Sherry, S. T. dbSNP: the NCBI database of genetic variation. Nucleic Acids Res.29, 308–11 (2001). - PMC - PubMed
    1. Koch, L. Exploring human genomic diversity with gnomAD. Nat. Rev. Genet.21, 448–448 (2020). - PubMed

LinkOut - more resources