. 2025 Jan;22(1):63-67.
doi: 10.1038/s41592-024-02436-x. Epub 2024 Sep 27.

Vitessce: integrative visualization of multimodal and spatially resolved single-cell data

Affiliations

Vitessce: integrative visualization of multimodal and spatially resolved single-cell data

Mark S Keller et al. Nat Methods. 2025 Jan.

Abstract

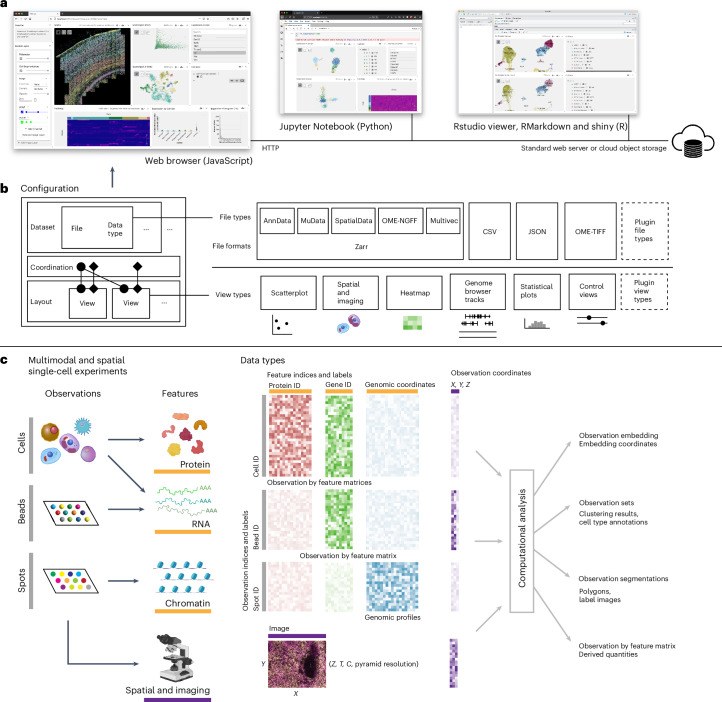
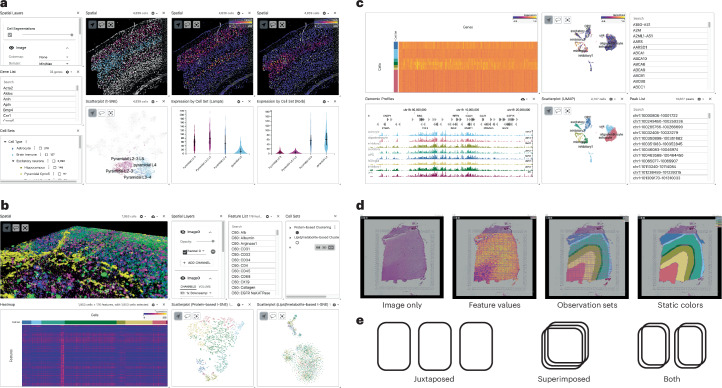
Multiomics technologies with single-cell and spatial resolution make it possible to measure thousands of features across millions of cells. However, visual analysis of high-dimensional transcriptomic, proteomic, genome-mapped and imaging data types simultaneously remains a challenge. Here we describe Vitessce, an interactive web-based visualization framework for exploration of multimodal and spatially resolved single-cell data. We demonstrate integrative visualization of millions of data points, including cell-type annotations, gene expression quantities, spatially resolved transcripts and cell segmentations, across multiple coordinated views. The open-source software is available at http://vitessce.io .


Conflict of interest statement

Competing interests: N.G. is a co-founder and equity owner of Datavisyn. P.V.K. serves on the Scientific Advisory Board to Celsius Therapeutics, Inc. and Biomage, Inc. The other authors declare no competing interests.

Figures

Fig. 1
Fig. 1. Vitessce can be used in multiple settings and can be configured to visualize raw and derived measurements from multimodal and spatial single-cell experiments.
a, Vitessce can be used as a JavaScript component in a web browser or a widget in Python and R analysis environments. b, Single-cell, single-molecule and microscopy data stored in multiple formats can be visualized in multiple types of views (that is, interactive visualizations). c, The modular design of Vitessce enables integrative visualization of multimodal and spatial single-cell experiments alongside computational analysis results. The arrows between observations and features represent the ability to visualize data from heterogeneous experiments that measure subsets of features that are shared by subsets of observations. OME, open microscopy environment; NGFF, next generation file format; CSV, comma separated values; JSON, JavaScript object notation; TIFF, tagged image file format; ID, identifier. Icon credits: cell images under ‘Observations’ from Reactome.org under a Creative Commons license CC BY 4.0; images under ‘Features’ from https://www.biorender.com/.
Fig. 2
Fig. 2. Sample use cases for Vitessce.
a, Visualization of a single-molecule FISH experiment containing multiplexed images, spatially resolved RNA molecules and cell segmentations. b, Volumetric rendering of a three-dimensional multimodal imaging mass spectrometry (IMS) dataset alongside a heatmap and side-by-side protein-based and lipid/metabolite-based dimensionality reduction scatterplots. c, Simultaneous visualization of gene expression and chromatin accessibility from a 10x Genomics Multiome dataset. d, Schematic of supported visualization layers in the spatial view of Vitessce, namely, points, spots, segmentations and images. Spot and segmentation layers can be colored by feature values, set membership or static colors. e, Vitessce supports both juxtaposed and superimposed arrangements of multiple spatially resolved visualizations. Chr, chromosome; t-SNE, t-distributed stochastic neighbor embedding; UMAP, uniform manifold approximation and projection.
Extended Data Fig. 1
Extended Data Fig. 1. Visualization of single-molecule fluorescence in situ hybridization (smFISH) data.
Codeluppi et al. used single-molecule fluorescence in situ hybridization (smFISH) to profile the somatosensory cortex in a mouse brain section. The authors selected 33 marker genes based on previous scRNA-seq findings in the somatosensory cortex and their ability to define cell types. A notable finding from this experiment was the discovery of a transition region defined by the Pyramidal L3/4 excitatory neuron cell type. Using the spatial plot and heatmap in Vitessce, we can reproduce this finding and observe the reported joint expression of markers Lamp5 and Rorb that define the surrounding Pyramidal L2/3 and L4 cell types, respectively. URL: http://vitessce.io/#?dataset=figure-osmfish&expand=true Alternate URL: https://legacy.vitessce.io/demos/2024-07-26/24fdfb91/?dataset=figure-osmfish.
Extended Data Fig. 2
Extended Data Fig. 2. Visualization of a 10x Genomics Visium dataset.
10x Genomics provides this dataset as a demo of the Visium technology and thus this dataset does not answer a particular biological question. Nonetheless, we can validate that the expected lymph node cell types are present. Using the CellTypist method for semi-automated cell type annotation of immune cells, we identify that CR2 is highly expressed by spots predicted to contain Germinal center B cells. Using CellPhoneDB, we query for known ligands of this receptor, which results in identification of FCER2. Using linked spatial views in Vitessce, we can observe that CR2 is specifically expressed by Germinal center B cell spots while the expression of FCER2 is less specific but does overlap. URL: http://vitessce.io/#?dataset=figure-visium&expand=true Alternate URL: https://legacy.vitessce.io/demos/2024-07-26/24fdfb91/?dataset=figure-visium.
Extended Data Fig. 3
Extended Data Fig. 3. Visualization of a 3D multimodal mass spectrometry imaging dataset.
Tian et al. report the development of a mass spectrometry imaging workflow that utilizes both cryogenic (H2O)n>28K-GCIB-SIMS and C60-SIMS techniques to capture metabolites, lipids, and proteins at single-cell resolution in the same tissue section. Applying this workflow to a human liver sample, the authors find that they are able to classify metabolic zones and cell types using lipid and metabolite profiles. Using the volumetric rendering features available in Vitessce, we can explore the 3D multi-channel imaging data alongside the cell-by-feature heatmap and both protein-based and lipid/metabolite-based dimensionality reductions. URL: http://vitessce.io/#?dataset=figure-multimodal-ims&expand=true Alternate URL: https://legacy.vitessce.io/demos/2024-07-26/24fdfb91/?dataset=figure-multimodal-ims.
Extended Data Fig. 4
Extended Data Fig. 4. Visualization of a CODEX dataset.
CO-Detection by indEXing (CODEX) is a spatial assay which uses oligonucleotide probes conjugated to antibodies specific to a set of antigens of interest. Through multiple rounds of hybridization, up to 50 different antigens may be imaged. We present an example of using Vitessce to explore a human spleen tissue sample in which 29 antigens were targeted. The dataset contains the 29-channel microscopy images, cell segmentations, cell-by-antigen quantification, and unsupervised clustering results. To interact with this dataset, we configure Vitessce with a spatial plot, heatmap, and controllers to select image channels, antigens, and cell clusters of interest. With multiple representations of the same data, we can choose to begin exploration by focusing on one of several entity types. Because this dataset lacks cell type annotations, we are interested in the protein markers which define each cluster. We approach the visual analysis by selecting a cluster in the cell set controller, then searching for cluster-specific patterns in the spatial view. With clustering assignments encoded as cell segmentation mask colors, it appears that cells assigned to cluster 6 within the ‘Cell K-Means [Mean-All-SubRegions] Expression’ localize to a small set of compact regions in the spatial view, suggestive of cellular neighborhoods in the spleen. When we identify cluster 6 in the heatmap view, it is clear that the marker with the highest relative expression in this cluster corresponds to the B cell marker CD20. We can confirm that CD20 is enriched in this spatial region by hiding the cell segmentation masks in the spatial plot, uncovering the underlying image data. Using the spatial layer controller, we can select the CD20 channel and verify that the fluorescence signal indeed appears in the expected regions. The heatmap and image views can help us to find other markers correlated with the CD20 spatial expression pattern. URL: http://vitessce.io/#?dataset=figure-codex&expand=true Alternate URL: https://legacy.vitessce.io/demos/2024-07-26/24fdfb91/?dataset=figure-codex.
Extended Data Fig. 5
Extended Data Fig. 5. Visualization of a CITE-seq dataset.
Stoeckius et al. report the development of the CITE-seq method for measuring gene expression and surface protein abundance in the same cells. The authors validate their technique on a sample of cord blood mononuclear cells (CBMCs) by measuring the abundance of well-characterized immune cell type markers. Using linked scatterplots and heatmaps to visualize protein abundance and gene expression levels simultaneously, we can reproduce the authors’ multimodal characterization of the Natural Killer (NK) cell type based on CD56 levels and the expression of genes GZMB, GZMK, and PRF1. URL: http://vitessce.io/#?dataset=figure-cite-seq&expand=true Alternate URL: https://legacy.vitessce.io/demos/2024-07-26/24fdfb91/?dataset=figure-cite-seq.
Extended Data Fig. 6
Extended Data Fig. 6. Visualization of a 10x Genomics Multiome dataset.
This dataset is provided by 10x Genomics as a demo of the Multiome technology and thus is not intended to answer a particular biological question. Nonetheless, we can use this dataset to validate that the expected cerebellum cell types are present. Using the heatmap, we identify the gene SYT1 based on its expression pattern in the cell cluster corresponding to the microglia cell type. Querying for transcription factors of SYT1 using Cistrome Toolkit,, we can identify SMARCA4 as the top result from a human neuron sample, with a regulatory potential score of 0.50982. Navigating to this gene on chromosome 19 in the genome browser view, we can observe a footprint-like pattern in the track for microglia, which we might want to validate in follow-up analyses. URL: http://vitessce.io/#?dataset=figure-multiome&expand=true Alternate URL: https://legacy.vitessce.io/demos/2024-07-26/24fdfb91/?dataset=figure-multiome.
Extended Data Fig. 7
Extended Data Fig. 7. Visualization of a MALDI IMS dataset processed multiple ways.
Vitessce can be used for visual comparison of the outputs of multiple data processing methods within datasets containing multiple technical conditions, supporting the workflows of algorithm developers and computational biologists. For example, computational biologists tasked with analyzing imaging mass spectrometry (IMS) data may be interested in the consequences of using different interpolation methods for generation of pyramidal image files. Pyramidal image files contain downsampled lower resolution versions of the same image which are generated by pre-aggregating pixels, facilitating multi-scale visualization in a web browser. The choice of a downsampling pre-aggregation interpolation function may affect the visual properties of lower resolution images. The open microscopy image processing toolkit bioformats2raw implements several common interpolation methods: SIMPLE, GAUSSIAN, AREA, LINEAR, CUBIC, and LANCZOS. We use the multi-scale image rendering capabilities of Vitessce to compare the application of these methods to an IMS dataset. The zoom levels and centers of each spatial plot are coordinated to facilitate comparison of the same image region at multiple scales. Vitessce helps to discover that the SIMPLE interpolation method introduces regularly-spaced horizontal streaks into the lowest resolution version of the image. Zooming in prompts Vitessce to load a higher resolution image in which the streaks are absent, indicating that they are artifacts of the downsampling procedure. This insight may steer us away from using the SIMPLE method when processing IMS data. URL: http://vitessce.io/#?dataset=figure-ims&expand=true Alternate URL: https://legacy.vitessce.io/demos/2024-07-26/24fdfb91/?dataset=figure-ims.

References

    1. Yuan, G.-C. et al. Challenges and emerging directions in single-cell analysis. Genome Biol.18, 84–91 (2017). - PMC - PubMed
    1. Samatova, N. F., Breimyer, P., Hendrix, W., Schmidt, M. C. & Rhyne, T. An outlook into ultra-scale visualization of large-scale biological data. In 2008 Workshop on Ultrascale Visualization 29–39 (IEEE, 2008).
    1. Garrison, L. A., Kolesar, I., Viola, I., Hauser, H. & Bruckner, S. Trends and opportunities in visualization for physiology: a multiscale overview. Comput. Graph. Forum41, 609–643 (2022).
    1. Zhuang, X. Spatially resolved single-cell genomics and transcriptomics by imaging. Nat. Methods18, 18–22 (2021). - PMC - PubMed
    1. Megill, C., et al. Cellxgene: a performant, scalable exploration platform for high dimensional sparse matrices. Preprint at bioRxiv10.1101/2021.04.05.438318 (2021).

LinkOut - more resources