Clinical Trial
. 2024 Dec;30(12):3697-3708.
doi: 10.1038/s41591-024-03271-5. Epub 2024 Sep 27.

Cytokine-mediated CAR T therapy resistance in AML

Affiliations
Clinical Trial

Cytokine-mediated CAR T therapy resistance in AML

Anand S Bhagwat et al. Nat Med. 2024 Dec.

Abstract

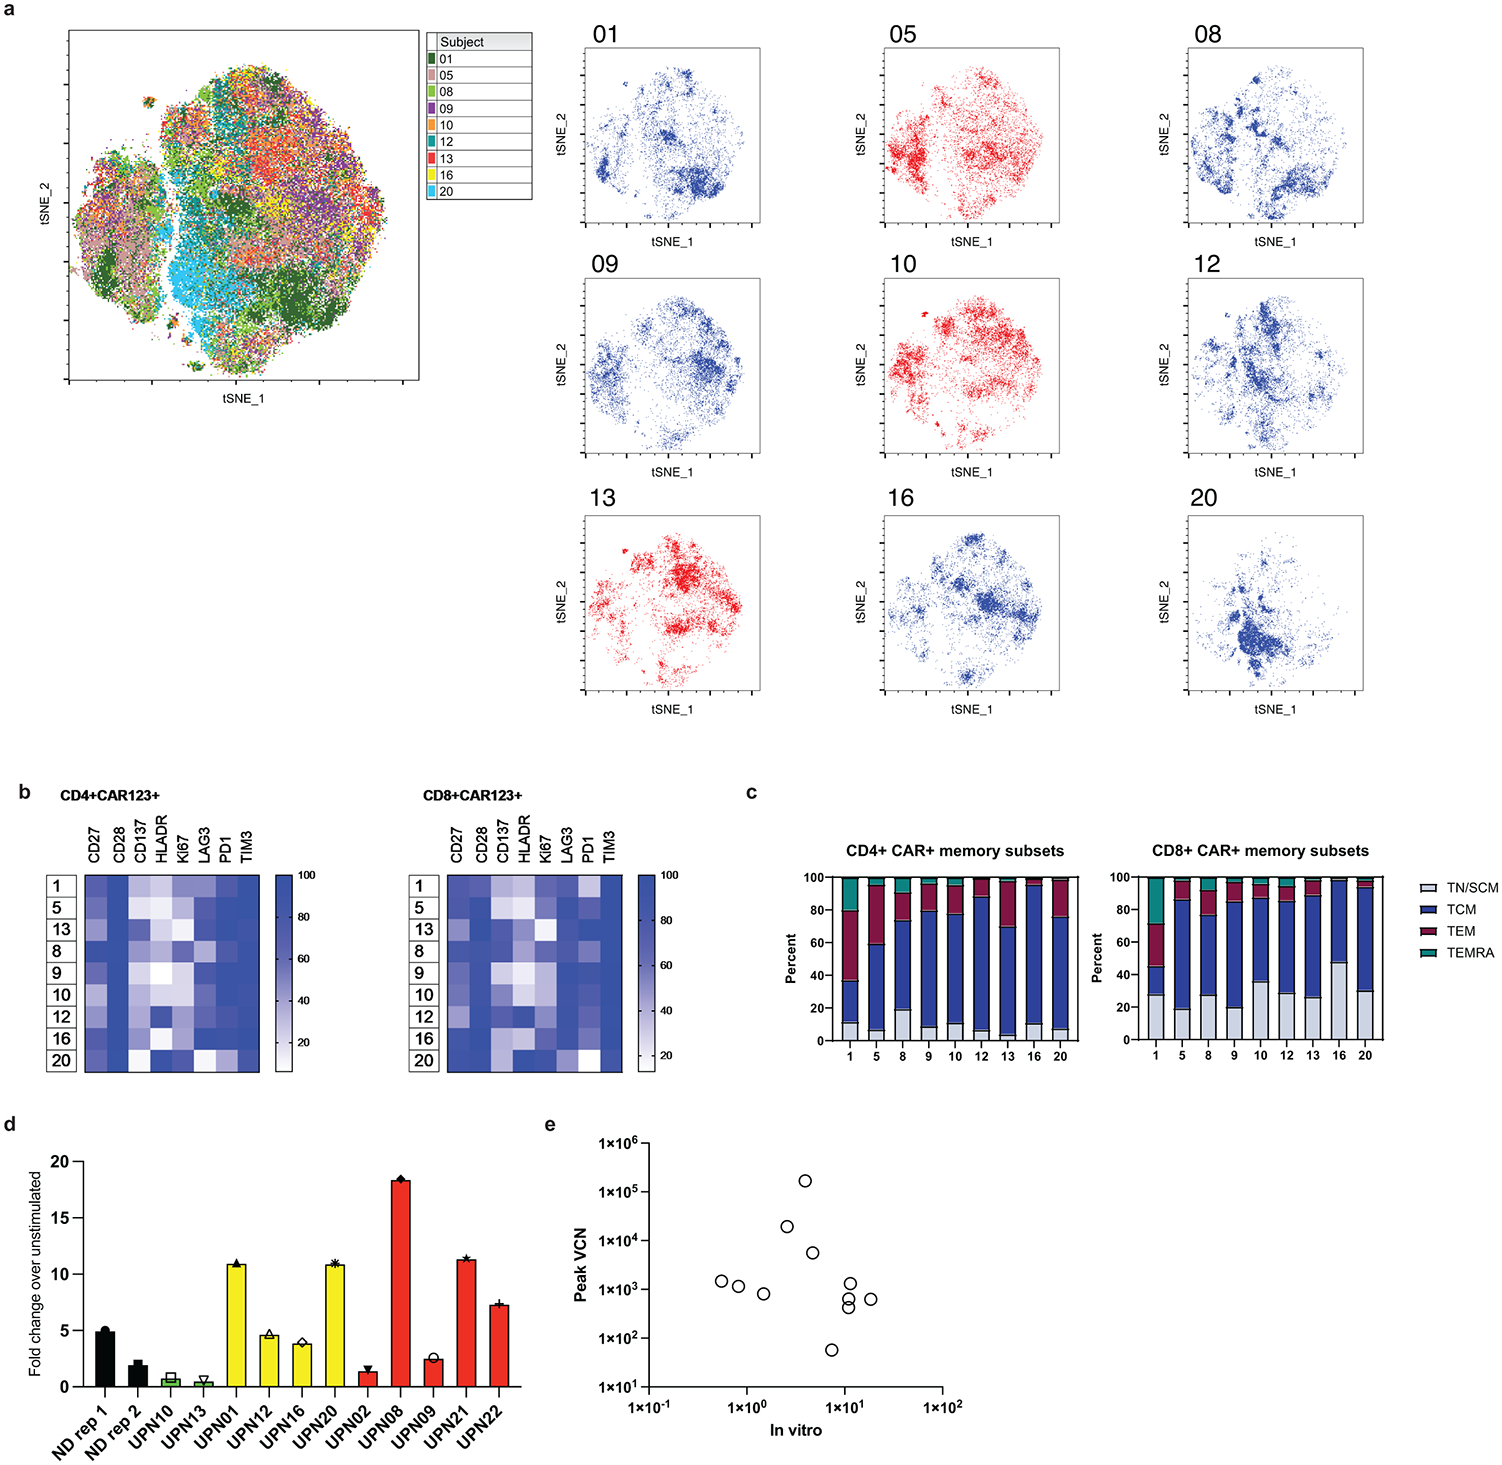
Acute myeloid leukemia (AML) is a rapidly progressive malignancy without effective therapies for refractory disease. So far, chimeric antigen receptor (CAR) T cell therapy in AML has not recapitulated the efficacy seen in B cell malignancies. Here we report a pilot study of autologous anti-CD123 CAR T cells in 12 adults with relapsed or refractory AML. CAR T cells targeting CD123+ cells were successfully manufactured in 90.4% of runs. Cytokine release syndrome was observed in 10 of 12 infused individuals (83.3%, 90% confidence interval 0.5-0.97). Three individuals achieved clinical response (25%, 90% confidence interval 0.07-0.53). We found that myeloid-supporting cytokines are secreted during cell therapy and support AML blast survival via kinase signaling, leading to CAR T cell exhaustion. The prosurvival effect of therapy-induced cytokines presents a unique resistance mechanism in AML that is distinct from any observed in B cell malignancies. Our findings suggest that autologous CART manufacturing is feasible in AML, but treatment is associated with high rates of cytokine release syndrome and relatively poor clinical efficacy. Combining CAR T cell therapies with cytokine signaling inhibitors could enhance immunotherapy efficacy in AML and achieve improved outcomes (ClinicalTrials.gov identifier: NCT03766126 ).


Conflict of interest statement

Competing interests: D.L.P. declares funding from the National Marrow Donor Program; membership on an entity’s Board of Directors or advisory committees of Kite/Gilead, Janssen, Genentech, DeCart, Sana Biotechnology, Verismo and Novartis; is a current equity holder of the American Society for Transplantation and Cellular Therapy and Verismo; declares honoraria for Incyte; and has patents and royalties in Tmunity and Wiley and Sons Publishing. J.A.F. is a member of the scientific advisory boards of Cartography Bio and Shennon Biotechnologies and has patents, royalties and other intellectual property. M.R.L. is an employee of Hematoloics, Inc. J.L.B. is an employee of Novartis. C.H.J. is an inventor of patents related to CAR therapy products and may be eligible to receive a select portion of royalties paid from Kite to the University of Pennsylvania. C.H.J. is a scientific cofounder and holds equity in Capstan Therapeutics, Dispatch Biotherapeutics and Bluewhale Bio. C.H.J. serves on the board of AC Immune and is a scientific advisor to BlueSphere Bio, Cabaletta, Carisma, Cartography, Cellares, Cellcarta, Celldex, Danaher, Decheng, ImmuneSensor, Kite, Poseida, Verismo, Viracta and WIRB-Copernicus group. S.I.G. has patents related to CAR therapy with royalties paid from Novartis to the University of Pennsylvania. S.I.G. is a scientific cofounder and holds equity in Interius Biotherapeutics and Carisma Therapeutics. S.I.G. is a scientific advisor to Carisma, Cartography, Currus, Interius, Kite, NKILT and Mission Bio. The other authors declare no competing interests.

Figures

Extended Data Fig. 1
Extended Data Fig. 1. Patient responses and correlative data.
a, Flow cytometric measurable residual disease (MRD) in bone marrow aspirates using the different-from-normal (DfN) method. b, Copy number of CAR-123 per microgram of genomic DNA as measured by qPCR at indicated time points for each patient. c, Flow cytometry quantification of surface CD123 molecules on AML blasts of each patient (using “difference from normal” approach) at the indicated time points. d, Serial serum cytokine levels as measured serially in subjects on study via clinical Luminex panel. Data presented in log scale, normalized to the first time point ( ~ 1 week prior to initiation of LD chemo). Light red lines represent values from individual subjects, dark red line represents the mean of all patients at each time point for which >1 patient had a detectable value. e, IL-3 ELISA to complement Olink data, comparing clinical subjects’ baseline serum IL-3 level to “peak” IL-3 level. Statistical analysis performed using Welch’s two-tailed t-test.
Extended Data Fig. 2
Extended Data Fig. 2. Responder and non-responder CART-123 infusion products are similar.
a, Percentage of CD4 + CAR+ (left) or CD8 + CAR+ (right) populations expressing the indicated activation markers. b, Dot plot of t-distributed stochastic neighbor embedding (t-SNE) of CAR T products from all available patients (left). Distributions of cells from individual patients are labeled with patient ID (right). Red plots indicate initial partial (patient 10) or complete (patients 5 and 13) responses defined by day 14 bone marrow aspirate/biopsy. Blue plots indicate stable progressive disease on day 14 marrows. All analyzed patients are represented in two main populations. c, Percentage of CD4 + CAR+ (left) or CD8 + CAR+ (right) populations designated as naïve or stem cell memory (TN/TSCM), central memory (TCM), effector memory (TEM), or terminally differentiated effector memory (TEMRA) by CD45RA and CCR7 expression. d, Normal donor CART-123 (two independent replicates, black bars) and left-over infusion product from the indicated clinical trial subjects were incubated with an AML cell line (MOLM14) at a 1:5 effector:target ratio for 5 days. T cells were counted, and proliferation is represented as the fold-change in the MOLM14-stimulated CAR T cells compared with no stimulation control. Normal donor replicates are shown in black. Two of three subjects with early marrow blast reduction (UPN10, UPN13) were available and are shown in green. Four subjects with no change in marrow blasts (UPN 1, 12, 16, 20) are shown in yellow (note that UPN 1 blasts were 0% prior to CART-123 infusion and 0% at day 28 after CART-123 infusion). Five subjects with increase in marrow or blood blasts (UPN 2, 8, 9, 21 and 22) are shown in red. e, Correlation of fold expansion in vitro of subjects’ infusion products with their peak VCN when measured after infusion (expressed as copies/ug gDNA). Each circle represents an individual subject. Pearson r = −0.19, P = 0.57.
Extended Data Fig. 3
Extended Data Fig. 3. Cytokines selectively undermine myeloid-directed cell therapy by supporting AML cell survival.
a, Number of live primary AML or primary ALL cells in culture after 7 days in serum free medium with the addition of G-CSF. Data shown as live, non-apoptotic leukemia cells relative to number of similar cells cultured in serum-free medium for each independent experiment. Data presented as mean +/− SEM. n = 8 independent experiments involving 6 independent AML samples, and n = 5 independent ALL samples. b, Flow cytometry analysis of CD45 and CD34 expression on primary AML sample cultured in serum-free medium supplemented with PBS control or GM-CSF (1 ng/mL) for one week. Data are representative of at least two independent AML samples. CD45-dim / CD34+ cells are gated as “blasts”. c-e, Quantification of proportion of cells expressing the indicated cell surface markers by flow cytometry analysis of primary AML samples cultured in serum-free medium supplemented with PBS control or GM-CSF (1 ng/mL) for one week. Data presented as mean +/− SEM of two independent AML samples. f, Expression of cell-surface CD-123 on primary AML sample. Data representative of multiple independent AML samples. g, Count of live AML cells after 96 hours co-culture with CART-123 at an E:T ratio of 1:1. n = 8 independent experiments involving 4 distinct primary AML samples and 4 CART-123 donors. h, Count of live AML cells after 96 hours co-culture with CART-123 at an E:T ratio of 1:16. n = 13 independent experiments involving 7 primary AML samples and 5 CART-123 donors, presented as mean +/− SEM. i, Count of live AML cells after 96 hours co-culture with CART-123 at an E:T ratio of 1:4. GM-CSF was washed out of media prior to addition of CART-123 cells, and remainder of experiment conducted in serum-free and supplement-free media. Data normalized to AML cell count in PBS control condition for each experiment, and presented as mean +/− SEM. n = 7 independent experiments using 3 distinct primary AML samples. j, Count of live AML cells after 96 hours co-culture with CART-33 at E:T ratio of 1:4 with indicated cytokine supplement. n = 3 independent experiments involving a primary AML sample. Statistical analysis for g-j performed on independent experiments by two-tailed Wilcoxon signed rank test for g-j. k, Number of live CART-123 cells in serum-free medium supplemented with PBS control or GM-CSF for four days. Data presented as mean +/− SEM, n = 9 including 5 individual T cell donors, and statistical analysis performed by two-tailed student’s t-test. l-n, As in a, but depicting number of live CART-123 cells in indicated culture conditions after four days’ co-culture with AML at indicated E:T ratios. Data presented as mean +/− SEM, n = 8 for l, n = 9 for m, n = 9 for n, including 5 individual T cell donors, and statistical analysis performed by student’s t-test. o, CellTrace Violet measurement of proliferation of CART-123 cells upon exposure to AML cells at the indicated E:T ratio in the presence of PBS control or GM-CSF. Results representative of at 5 individual T cell donors. p-q, Count of indicated live primary ALL sample after 96 hours of co-culture with CART-123 at indicated E:T ratios. ALL cells were primed with 48 hours of cytokine (or control PBS) addition, as in Fig. 2h-j. Two independent ALL patient samples are presented, with individual dots indicating technical replicates, presented as mean +/− SEM.
Extended Data Fig. 4
Extended Data Fig. 4. CART-123 dysfunction caused by inability to clear AML antigen.
a, Flow cytometry analysis of expression of additional inhibitory receptors CD38 and CD39 (top) and CTLA4 and CD94 (bottom). Representative of two experiments with different primary AML and CART-123 donors, complements distinct donors shown in Fig. 3. b, Intracellular expression of TCF-1 in the indicated CART-123 + T cell subsets, measured by flow cytometry. MFI displayed to the right. Representative of two experiments with different primary AML and CART-123 donors complements distinct donors shown in Fig. 3. See also, Supplementary Fig. 3. c, Flow cytometry analysis of live single cells depicting residual CD3- (presumed AML cells) after 2 weeks of co-culture. d, Intracellular cytokine analysis of IFNand TNF in two different CART-123 donors after 3 weeks of UPA or CPA co-culture. e, Surface expression of inhibitory receptor ligands on two distinct primary AML samples after one week in co-culture with CART-123 cells. f, UMAP plots of SCFV-expressing, CAR + T cells recovered from patients at time points at least 10 days after infusion. On the left coloration is determined by patient response, and on the subsequent 3 the indicated “gene module score” is overlaid.
Extended Data Fig. 5
Extended Data Fig. 5. Cytokines activate STAT5-mediated survival signaling in AML blasts.
a, PathfindR analysis of selected KEGG pathways in primary AML transcriptomic analysis. Primary AML was exposed to PBS or GM-CSF (1 ng/mL) for 48 hours before RNA was processed from single cells. Blue bars highlight signaling pathways, while red bars highlight pathways relevant to observed phenotypes. b, Phospho-flow cytometry analysis of pSTAT3 in primary AML treated for 30 minutes with the indicated supplement to serum-free medium. “Baseline” serum refers to pre-LD chemotherapy serum sample, “peak” serum refers to serum drawn during peak T cell expansion, as in Fig. 2a. Statistical analysis performed with a two-sided unpaired t test. c, Phospho-flow cytometry analysis of pSTAT5 and pSTAT3 in primary AML samples treated with 30 minutes of PBS, 1 ng/mL GM-CSF, 10 ng/mL FLT3L, or 50 ng/mL IL-6. d, Western blot of total STAT5 and pSTAT5 in primary AML cells treated for one hour with PBS control or 1 ng/mL GMCSF. Shown is a representative blot consistent with sample across two independent AML donors. e, Number of live primary AML in culture after 7 days in serum free medium with the addition of PBS or GM-CSF and DMSO or 300 nM Ruxolitinib. Data shown relative to number of live cells serum free medium for each experiment. Lines represent mean. Statistical analysis performed by two-tailed Wilcoxon signed-rank test, n = 6 for PBS Rux condition, n = 9 for all other conditions. f, Number of live primary AML cells after 96 hours’ co-culture with CART-123 at an E:T ratio of 1:4, normalized to PBS + DMSO condition for each experiment. Data presented as mean +/− SEM of n = 3 replicates of 2 independent primary AML samples and 2 distinct CART-123 donors.
Figure 1.
Figure 1.. Pilot clinical study of CART-123 results in brief responses in patients with relapsed or refractory AML
a, CONSORT diagram b, Table detailing serious adverse events that occurred on study. c, Disease characteristics of enrolled subjects on trial. Each column corresponds to a subject on study. Each row denotes the indicated feature. Top: Disease characteristics as defined by legend. Bottom: Genetic or cytogenetic alterations detected in AML. Blue box indicates that row’s lesion identified in that column’s patient’s AML. d, Swimmer plot showing responses in subjects with AML on CART-123 study. Symbols indicating events, including infusion days (white open circles), individual days on which CRS was experienced (white crosses), relapse (yellow squares), switch to new therapy (green triangles), and death (black Xs), are described in the box on the right. Gray bars indicate AML disease response due to other therapies. e, Percent marrow AML blasts by morphology in samples collected at indicated time points for each enrolled subject. f, Kaplan-Meier plot depicting overall survival of subjects enrolled on study. g, Volcano plot showing log2 Fold Change versus -log10 transformation of adjusted P values for >5000 serum analytes. Fold change and statistical comparisons are made between individual subjects’ paired “baseline” (pre-LD chemo) and “peak” (maximal CART-123 expansion) serum samples. Statistics were performed using a two-tailed Welch paired t-test for each detected protein.
Figure 2.
Figure 2.. Cytokines promote AML resistance to CAR T cells
a, Number of live primary AML cells in culture as measured by Annexin V and PI negativity after culture for seven days with “baseline” serum (control obtained prior to LD chemotherapy) or “peak” serum (day 10 or day 14 after CART-123 infusion) obtained subjects on clinical trial. Data shown relative to live AML cells in serum-free media for seven days and presented as mean +/− SEM. Statistical analysis was performed using Welch’s two-tailed t test comparing “baseline” and “peak” values. n = 7 independent experiments, pairing 4 distinct primary AML samples and 4 distinct clinical subjects’ matched “baseline” and “peak” sera. b-f, Similar to a, number of live, non-apoptotic primary AML or primary ALL cells in culture after 7 days in serum-free medium with the addition of the indicated cytokine, relative to no-cytokine condition (gray line at y = 1), presented as mean +/− SEM. Each dot represents an independent experiment. Statistical analysis was performed on independent experiments using a two-tailed Wilcoxon signed rank test. For b, n = 6 independent AML samples and n = 3 independent ALL samples. For c, n = 6 independent AML samples and n = 3 independent ALL samples. For d, n = 8 independent AML samples, and n = 6 independent ALL samples. For e, n = 23 independent experiments involving 11 AML samples, and n = 10 independent ALL samples. Three data points are marked as above the axis limits for visualization purposes. For f, n = 8 independent AML samples, and n = 6 independent ALL samples. g, Top: relative measurements of serum GM-CSF concentration as in individual patients on study (light red lines lines) Overall average is shown as a dark red line. Bottom: corresponding design of killing assay, designed with BioRender. h-j, Count of live AML cells after 96 hours co-culture with CART-123 at E:T ratio of 1:4 with indicated cytokine. Data normalized to AML cell count in PBS control condition for each experiment, and presented as mean +/− SEM. n = 8 independent experiments involving 4 distinct primary AML samples and 4 CART-123 donors; (h), n = 11 independent experiments involving 6 distinct primary AML samples and 5 CART-123 donors; (i), n = 6 independent experiments involving 3 primary AML samples and 3 CART-123 donors; and (j), n = 8 independent experiments involving 4 distinct primary AML samples and 3 CART-123 donors. Statistical analysis performed on independent experiments by two-tailed Wilcoxon signed rank test comparing cytokine sample normalized to paired PBS-control sample. k, Count of live AML cells after 96 hours co-culture with CART-123 at E:T ratio of 1:4 with baseline or peak patient serum samples (pooled from 8 patients) as a supplement. Serum was either kept in culture when CART-123 was added (black dot), or was removed by washing AML cells prior to addition of CART-123 (white dot).
Figure 3.
Figure 3.. AML exposure to cytokines results in CART-123 exhaustion
a, Unbiased clustering by UMAP on 30-parameter spectral flow cytometry performed on CART-123+ T cells incubated for 14 days with either cytokine-primed primary AML cells (CPA, green dots) or unprimed primary AML cells (UPA, gray dots). b, FlowSOM clustering subsets of CART-123+ T cells (labelled manually) as determined by FlowSOM within the Omiq platform, overlaid on UMAP clustering from a. Shown is data from a representative CART-123 T cell donor. c, Distribution of CART-123+ T cells in clusters as defined in b. d, Embedding analysis of expression of indicated proteins overlaid onto UMAP projection defined in Fig. 3a. Scale represents MFI. e, Simplified Presentation of Incredibly Complex Evaluations (SPICE) analysis plots from spectral flow cytometry data as in a. f, Intracellular IL-2 production in CD8+ CART-123+ UPA or CPA T cells after stimulation with PMA or CD123-expressing NALM-6 leukemia cells. MFIs indicated on right side. g, Violin plot analysis of patient scRNA-seq data, depicting exhaustion scores for CART-123 cells grouped by patient response. Scores derived from gene sets defined in previously published studies (42, 43) and applied to cells with CART-123 SCFV detected at RNA level at least 10 days post-infusion. P < 2e−16, P < 2e−16, and P = 4.6e−14, respectively, based on a two-tailed unpaired t test.
Figure 4
Figure 4. Targeting cytokine-induced STAT5 signaling restores AML sensitivity to CART-123
a, Heatmap summary of -log10(P value) calculated by PathfindR (45) analysis of scRNA-seq performed on trial subjects’ AML cells. P values calculated by a one-sided hypergeometric test with Bonferroni correction for multiple comparisons per the PathfindR package, comparing “peak” (day 10 or day 14) and “baseline” (~day −7) scRNA seq data. b, Phospho-flow cytometry analysis of pSTAT5 in primary AML treated for 30 minutes with the indicated supplement to serum-free medium. “Baseline” serum refers to pre-LD chemotherapy serum sample, “peak” serum refers to serum drawn during peak T cell expansion, as in Fig. 2a. Statistical analysis performed with a two-tailed unpaired t test. c, Western blot of BCL2 and beta actin in primary AML cells treated for one hour with PBS control or 1 ng/mL GMCSF. Shown is a representative blot consistent with sample across two independent AML donors. d, Phospho-flow cytometry analysis of primary AML treated for 30 minutes with the indicated supplements to serum-free medium as well as 300 nM ruxolitinib or DMSO vehicle control. e, Count of live AML cells from one representative primary AML sample after 96 hours co-culture with CART-123 at indicated E:T ratios in the presence of either PBS or GM-CSF and either DMSO or 300 nM ruxolitinib. Data presented as mean +/− SEM. n = 8 replicates from separate vials of one primary AML. Statistical analysis was performed using a two-way ANOVA with Sidak’s multiple comparison test. * P < 0.01; *** P < 0.0001 f, Similar to e, number of live primary AML cells after 96 hours’ co-culture with CART-123 at an E:T ratio of 1:4, normalized to PBS + DMSO condition for each experiment. Data presented as mean +/− SEM of n = 15 replicates of 4 independent primary AML samples and 4 distinct CART-123 donors. Statistical analysis performed on independent experiments using two-tailed Wilcoxon’s signed rank test; **** P < 0.0001.

References

    1. Kantarjian H. Acute myeloid leukemia--major progress over four decades and glimpses into the future. Am J Hematol. 2016;91(1):131–45. - PubMed
    1. Short NJ, Rytting ME, Cortes JE. Acute myeloid leukaemia. Lancet. 2018;392(10147):593–606. - PMC - PubMed
    1. DeWolf S, Tallman MS. How I treat relapsed or refractory AML. Blood. 2020;136(9):1023–32. - PMC - PubMed
    1. Ganzel C, Sun Z, Cripe LD, Fernandez HF, Douer D, Rowe JM, et al. Very poor long-term survival in past and more recent studies for relapsed AML patients: The ECOG-ACRIN experience. Am J Hematol. 2018;93(8):1074–81. - PMC - PubMed
    1. Perl AE, Martinelli G, Cortes JE, Neubauer A, Berman E, Paolini S, et al. Gilteritinib or Chemotherapy for Relapsed or Refractory FLT3-Mutated AML. N Engl J Med. 2019;381(18):1728–40. - PubMed

Publication types

Associated data

LinkOut - more resources