. 2024 Sep 27;14(1):22155.
doi: 10.1038/s41598-024-73411-x.

WingAnalogy: a computer vision-based tool for automated insect wing asymmetry and morphometry analysis

Affiliations

WingAnalogy: a computer vision-based tool for automated insect wing asymmetry and morphometry analysis

Shahab Eshghi et al. Sci Rep. .

Abstract

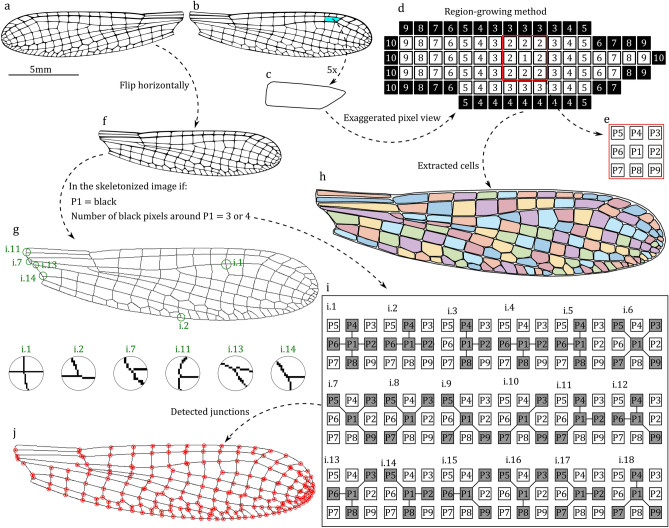
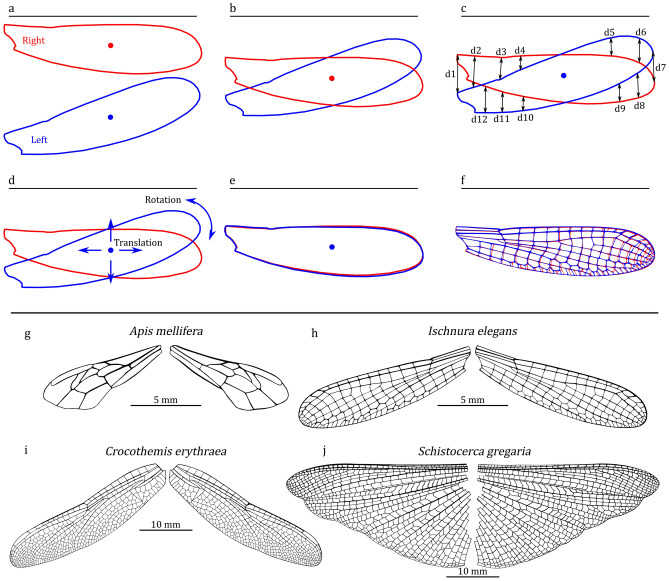
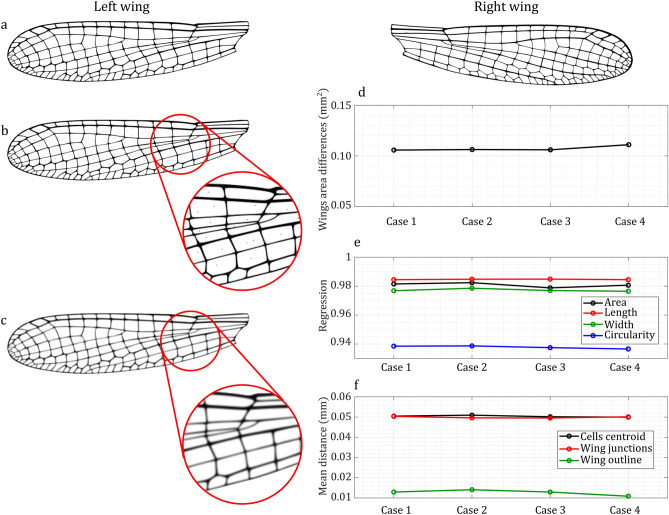
WingAnalogy is a computer tool for automated insect wing morphology and asymmetry analysis. It facilitates project management, enabling users to import pairs of wing images obtained from individual insects, such as left and right, fore- and hindwings. WingAnalogy employs image processing and computer vision to segment wing structures and extract cell boundaries, and junctions. It quantifies essential metrics encompassing cell and wing characteristics, including area, length, width, circularity, and centroid positions. It enables users to scale and superimpose wing images utilizing Particle Swarm Optimization (PSO). WingAnalogy computes regression, Normalized Root Mean Square Error (NRMSE), various cell-based parameters, and distances between cell centroids and junctions. The software generates informative visualizations, aiding researchers in comprehending and interpreting asymmetry patterns. WingAnalogy allows for dividing wings into up to five distinct wing cell sets, facilitating localized comparisons. The software excels in report generation, providing detailed asymmetry measurements in PDF, CSV, and TXT formats.

Keywords: Analogy; Entomology; Fluctuating asymmetry; PSO; Procrustes superimposition.


Conflict of interest statement

The authors declare no competing interests.

Figures

Fig. 1
Fig. 1
Illustration of the WingAnalogy segmentation process. (a) and (b) The left and right wings of damselfly wings, respectively. (c) A selected cell within the right wing. (d) An exaggerated view of the cell is highlighted in (c). (e) A pixel with its surrounding pixels. (f) The mirrored image of the left wing from (a). (g) The skeletonized image of the wing from (f). (h) Extracted wing cell boundaries from the wing image in (b) using the region growing method. (i) The conditions that, if met, classify a pixel as a junction. (j) The detected junctions within the wing.
Fig. 2
Fig. 2
Wing superimposition process and case study selection. (a) The outlines of the right and left wings. (b) The outlines after aligning them at a common center. (c) The measurement of distances between two wing outlines. (d) The translation and rotation of one wing for alignment. (e) The outlines of two wings after successful alignment. (f) Both wings, including their cells, after superimposition. Case study pairs include (g) forewings of Apis mellifera (Honeybee, Hymenoptera), (h) forewings of Ischnura elegans (Blue-tailed damselfly, Odonata: Zygoptera), (i) forewings of Crocothemis erythraea (Scarlet dragonfly, Odonata: Anisoptera), and (j) hindwings of Schistocerca gregaria (Desert locust, Orthoptera).
Fig. 3
Fig. 3
Filled contour plots depicting the distribution of wing cell area, length, width, and circularity, along with corresponding histograms showing a distribution fit for (a) Apis mellifera (Honeybee, Hymenoptera), (b) Ischnura elegans (Blue-tailed damselfly, Odonata: Zygoptera), (c) Crocothemis erythraea (Scarlet dragonfly, Odonata: Anisoptera), and (d) Schistocerca gregaria (Desert locust, Orthoptera).
Fig. 4
Fig. 4
Wing asymmetry comparison for the four case studies of wing pairs. (a,b) Regressions for area, length, width, and circularity across four wing pairs, and respective boxplots. (c,d) NRMSE for cell area, length, width, and circularity, and respective boxplots. (e,f) Mean distances between cell centroids, wing junctions, and wing outlines, and respective boxplots. (g,h) Standard deviation of mean distances between cell centroids, wing junctions, and wing outlines, and respective boxplots. (i,j) The subtracted values in the number of cells and junctions and respective boxplots. (k,l) Wing area and respective boxplot.
Fig. 5
Fig. 5
Analysis of wing cell sets and Superimposing Results. (a,d,g,j) Display the defined wing cell sets for honeybee, damselfly, dragonfly, and desert locust. (b,e,h,k) Depict the regressions of cell area, length, width, and circularity, for the respective insect wing pairs in the case studies. (c,f,i,l) Showcase the results of the Normalized Root Mean Square Error (NRMSE) calculations for cell area, length, width, and circularity in the four insect wings studied. (m,n,o,p) Illustrate the superimposed wings from each of the four case studies, providing insights into the alignment and comparison of these wing pairs.
Fig. 6
Fig. 6
Analysis of defined wing cell sets for the honeybee, damselfly, dragonfly, and desert locust wing pairs. (ae) The outcomes of the Regression, Normalized Root Mean Square Error (NRMSE), mean distances of cell centroids, and the standard deviation of mean distances of cell centroids for Sets 1 to 5 across all pairs. (fi) Feature boxplots corresponding to the regression of wing cell sets’ area, length, width, and circularity for cell sets 1 to 5. (jm) NRMSE values for the area, length, width, and circularity of cells within Sets 1 to 5 for all pairs. (n,o) The mean distance of wing cell centroids and their standard deviations for wing cell sets 1 to 5 across wing pairs, respectively.
Fig. 7
Fig. 7
Impact of image quality and artifacts on insect wing asymmetry analysis. (a) Case 1: Normal images of the left and right wings of a damselfly at 300 DPI. (b) Case 2: Noise added to the left wing image of the damselfly. (c) Case 3: The left wing image blurred using Gaussian Blur with a radius of one pixel in Photoshop. Case 4 (not illustrated): Similar to Case 1, but with increased resolution to 400 DPI. (d) Comparison of wing area differences. (e) Comparison of wing cell area, length, width, and circularity regressions. (f) Comparison of wing centroids, junctions, and outline mean distance across the four cases.

References

    1. Perrard, A., Baylac, M., Carpenter, J. M. & Villemant, C. Evolution of wing shape in hornets: Why is the wing venation efficient for species identification?. J. Evol. Biol. 27(12), 2665–2675. 10.1111/jeb.12523 (2014). - PubMed
    1. Rajabi, H. & Gorb, S. N. How do dragonfly wings work? A brief guide to functional roles of wing structural components. Int. J. Odonatol. 23(1), 23–30. 10.1080/13887890.2019.1677515 (2020).
    1. Rajabi, H., Schroeter, V., Eshghi, S. & Gorb, S. N. The probability of wing damage in the dragonfly Sympetrum vulgatum (Anisoptera: Libellulidae): A field study. Biol. Open 6(9), 1290–1293. 10.1242/bio.027078 (2017). - PMC - PubMed
    1. Dirks, J. H. & Taylor, D. Veins improve fracture toughness of insect wings. PLoS One 7(8), e43411. 10.1371/journal.pone.0043411 (2012). - PMC - PubMed
    1. Johansson, F., Söderquist, M. & Bokma, F. Insect wing shape evolution: Independent effects of migratory and mate guarding flight on dragonfly wings. Biol. J. Lin. Soc. 97(2), 362–372. 10.1111/j.1095-8312.2009.01211.x (2009).

MeSH terms

LinkOut - more resources