Clinical Trial
. 2024 Dec;51(6):887-904.
doi: 10.1007/s10928-024-09939-2. Epub 2024 Sep 27.

Population pharmacokinetics and exposure-response relationships of maribavir in transplant recipients with cytomegalovirus infection

Affiliations
Clinical Trial

Population pharmacokinetics and exposure-response relationships of maribavir in transplant recipients with cytomegalovirus infection

Ivy H Song et al. J Pharmacokinet Pharmacodyn. 2024 Dec.

Abstract

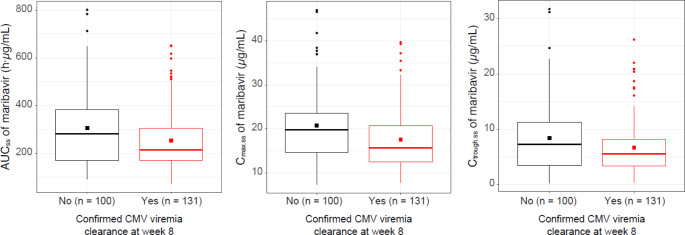
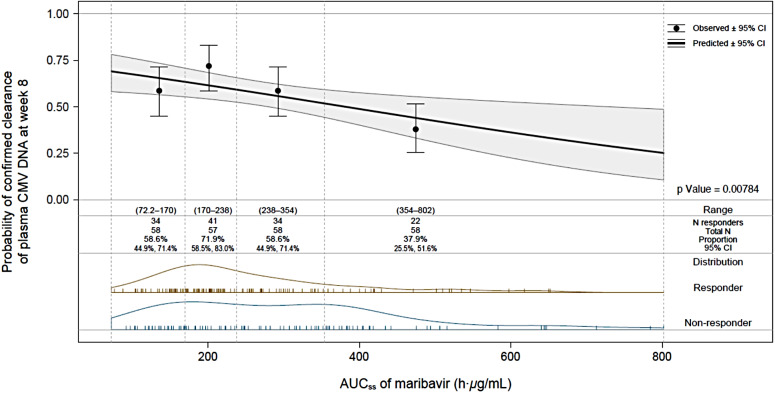
Maribavir is approved for management of post-transplant cytomegalovirus (CMV) infections refractory and/or resistant to CMV therapies at a dose of 400 mg twice daily (BID). Population pharmacokinetic (PopPK) and exposure-response analyses were conducted to support the appropriateness of 400 mg BID dosing. A PopPK model was developed using non-linear mixed-effects modeling with pooled maribavir plasma concentration-time data from phase 1 and 2 studies (from 100 mg up to 1200 mg as single or repeated doses) and the phase 3 SOLSTICE study (400 mg BID). Exposure-response analyses were performed for efficacy, safety, and viral resistance based on data collected in the SOLSTICE study. Maribavir PK after oral administration was adequately described by a two-compartment model with first-order elimination, first-order absorption, and an absorption lag-time. There was no evidence that maribavir PK was affected by age, sex, race, diarrhea, vomiting, disease characteristics, or concomitant use of histamine H2 blockers, or proton pump inhibitors. In the SOLSTICE study, higher maribavir exposure was not associated with increased probability of achieving CMV DNA viremia clearance, nor with reduced probability of treatment-emergent maribavir-resistant CMV mutations. A statistically significant association with maribavir exposure was identified for taste disturbance, fatigue, and treatment-emergent serious adverse events, while transplant type, enrollment region, CMV DNA level at baseline, and/or CMV resistance at baseline were identified as additional risk factors for these safety outcomes. In conclusion, the findings of these PopPK and exposure-response analyses provide further support for the recommended maribavir dose of 400 mg BID.

Keywords: Cytomegalovirus; Exposure response; Maribavir; Population pharmacokinetics; Transplant.


Conflict of interest statement

Declarations. Competing interests: IH Song, G Chen, and K Sun are employees of Takeda Development Center Americas, Inc., and receive stocks (and stock options) from Takeda. S Hayes and C Farrell are employees of ICON plc. C Jomphe and NH Gosselin are employees of Certara.

Figures

Fig. 1
Fig. 1
Prediction-corrected visual predictive check for the final population pharmacokinetic model for transplant recipients with cytomegalovirus infection. Left: Linear Y axis scale; Right: Logarithmic Y axis scale. Linear X Scale. Open circle: observed concentrations; solid line: median of observed concentrations; dashed lines: 2.5th and 97.5th percentile of observed concentrations. Red-shaded region: 95% prediction interval for median of predicted concentrations; blue-shaded regions: 95% prediction intervals for the 2.5th and 97.5th percentiles of predicted concentrations. h, hour
Fig. 2
Fig. 2
Effect of various intrinsic or extrinsic factors on the steady-state AUC0−τ and Cmax.ss of maribavir with corresponding geometric mean ratios and 90% confidence intervals in transplant patients with CMV for (a) weight, sex, age, and race, and (b) transplant type. Underweight = BMI < 18.5 kg/m2, healthy weight = BMI 18.5 to < 25 kg/m2, overweight = BMI 25 to < 30 kg/m2, obese = BMI ≥ 30 kg/m2. AUC0–τ, area under the concentration–time curve from time 0 to the end of the dosing interval; BMI, body mass index; Cmax, maximum plasma concentration; HCT, hematopoietic cell transplant; SOT, solid organ transplant. Figure a was published in Transplantation and Cellular Therapy, 28 3S. Ivy Song, Grace Chen, Siobhan Hayes, Colm Farrell, Claudia Jomphe, Nathalie H Gosselin. Population pharmacokinetics and exposure–response relationships of maribavir in transplant recipients with cytomegalovirus infection. S368-S369, Copyright American Society for Transplantation and Cellular Therapy. Published by Elsevier Inc. (2022). Figure b reproduced from Kefeng Sun, Martha Fournier, Aimee K. Sundberg and Ivy H. Song. Maribavir: mechanism of action, clinical, and translational science. Clin Transl Sci. 2024;17(1):10.1111/cts.13696
Fig. 3
Fig. 3
Maribavir exposure in the exposure–efficacy population by primary endpoint response: confirmed CMV clearance at the end of week 8. The lower and upper hinges correspond to the 25th and 75th percentiles, respectively. The upper and lower whiskers extend from the hinge to the largest or smallest value, respectively, no further than 1.5 * IQR from the hinge. Square symbols represent the arithmetic mean, circles represent outliers (i.e. data beyond the end of the whiskers). AUCss, area under the plasma concentration–time curve at steady state on the last day of exposure; Cmax.ss, maximum concentration of maribavir at steady state on the last day of exposure; CMV, cytomegalovirus; Ctrough.ss, minimum concentration of maribavir at steady state on the last day of exposure; IQR, interquartile range
Fig. 4
Fig. 4
Probability of achieving primary endpoint: confirmed CMV clearance of plasma CMV DNA at week 8, as a function of area under the plasma concentration–time curve at steady state on the last day of exposure. AUCss, area under the plasma concentration–time curve at steady state on the last day of exposure; CI, confidence interval; CMV, cytomegalovirus; N, number of patients; OR, odds ratio
Fig. 5
Fig. 5
Probability of developing treatment-emergent CMV mutations conferring resistance to maribavir as a function of minimum plasma concentration at steady state on the last day of exposure. CI, confidence interval; CMV, cytomegalovirus; Ctrough.ss, minimum plasma concentration at steady state on the last day of exposure; OR, odds ratio; TE, treatment-emergent

References

    1. Griffiths P, Reeves M (2021) Pathogenesis of human cytomegalovirus in the immunocompromised host. Nat Rev Microbiol 19:759–773. 10.1038/s41579-021-00582-z - PMC - PubMed
    1. Steingruber M, Marschall M (2020) The cytomegalovirus protein kinase pUL97: host interactions, regulatory mechanisms and antiviral drug targeting. Microorganisms 8:515. 10.3390/microorganisms8040515 - PMC - PubMed
    1. Pierce B, Richardson CL, Lacloche L, Allen A, Ison MG (2018) Safety and efficacy of foscarnet for the management of ganciclovir-resistant or refractory cytomegalovirus infections: a single-center study. Transpl Infect Dis 20:e12852. 10.1111/tid.12852 - PubMed
    1. Chou S (2015) Approach to drug-resistant cytomegalovirus in transplant recipients. Curr Opin Infect Dis 28:293–299. 10.1097/QCO.0000000000000170 - PMC - PubMed
    1. McIntosh M, Hauschild B, Miller V (2016) Human cytomegalovirus and transplantation: drug development and regulatory issues. J Virus Erad 2:143–148 - PMC - PubMed

Publication types

MeSH terms