. 2024 Sep 27;14(1):22126.
doi: 10.1038/s41598-024-73152-x.

Vitamin D3 reduces the expression of M1 and M2 macrophage markers in breast cancer patients

Affiliations

Vitamin D3 reduces the expression of M1 and M2 macrophage markers in breast cancer patients

Martyna Stachowicz-Suhs et al. Sci Rep. .

Abstract

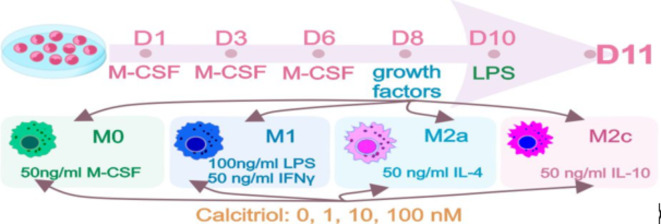
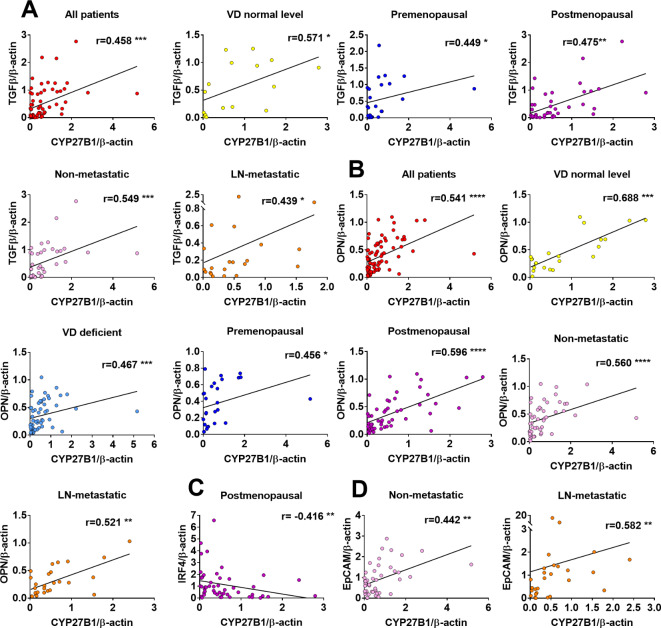
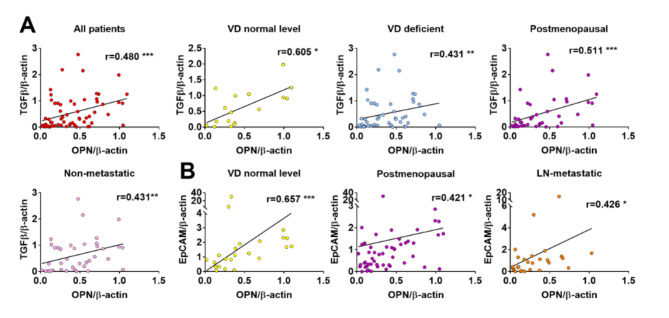
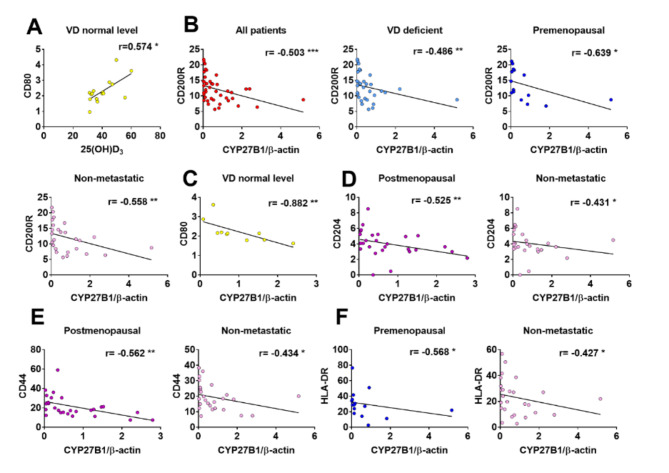
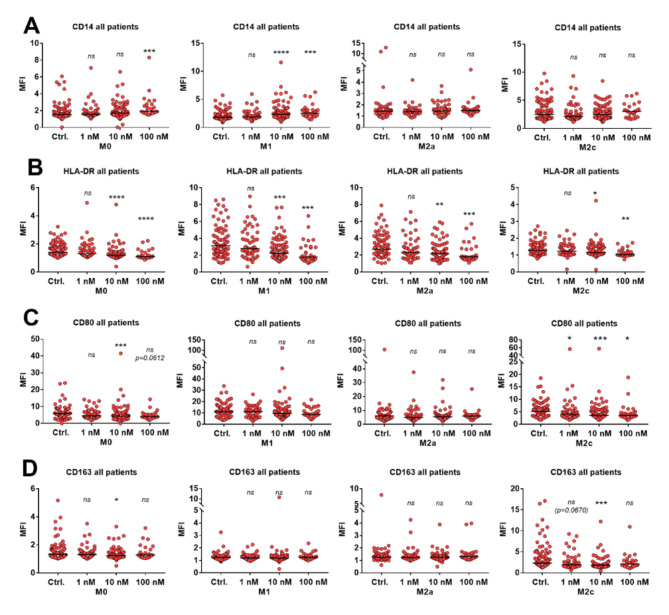
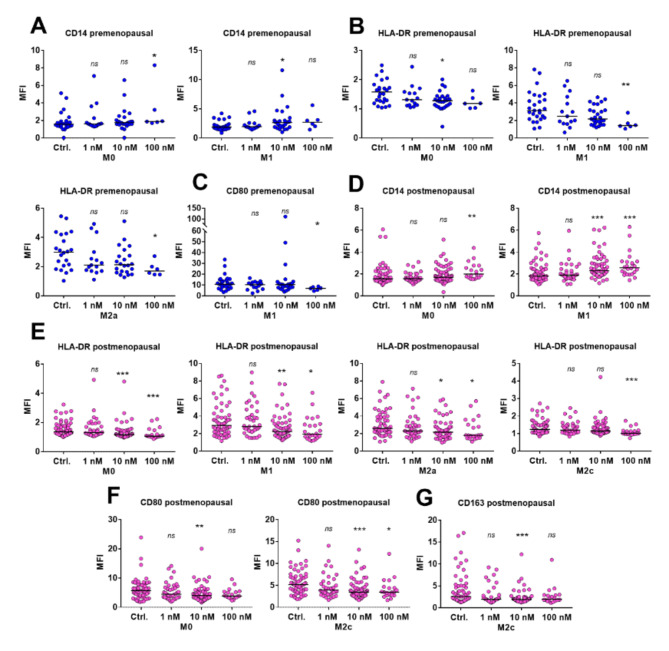
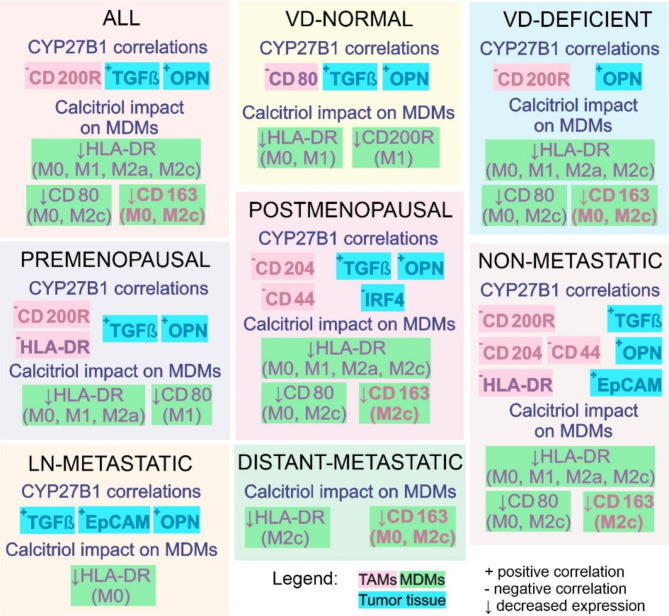
Vitamin D3 (VD) is known for its immunomodulatory and anticancer effects. This study aimed to characterize tumor-associated macrophages (TAMs) in breast cancer (BC) and assess the influence of VD and its active metabolite, calcitriol, on their polarization. TAMs were isolated from BC patients and characterized. Monocytes were differentiated into macrophage classes (M0, M1, M2a, M2c) and treated ex vivo with calcitriol. The expression of VD-related proteins in tumor tissue was correlated with TAMs and monocyte-derived macrophages (MDMs) characteristics. TAM expression of CD200R, CD204, CD80, HLA-DR, and CD44 was negatively correlated with CYP27B1 in selected patient groups. Patients with high CYP27B1 tumor expression showed significantly lower CD200R, CD204, and CD44 expression. In patients with normal VD levels and premenopausal, CD80 expression in M2a and M2c MDMs (control, untreated ex vivo with calcitriol) was negatively correlated with plasma VD. Calcitriol reduced HLA-DR during MDM differentiation in all patients; CD80 decrease significantly except in patients with normal VD levels or metastasis. Calcitriol also decreased CD163 expression. The decrease in both M1 and M2 macrophage markers by calcitriol or their negative correlation with CYP27B1 indicate the modulatory, but rather anticancer activity of VD. The intensity of these effects was the strongest in postmenopausal patients and those without metastases.

Keywords: Breast cancer; Calcitriol; Macrophages; TAMs; Vitamin D3.


Conflict of interest statement

The authors declare no competing interests.

Figures

Fig. 1
Fig. 1
Scheme of the differentiation of monocytes from the peripheral blood of patients into macrophage (MDM) classes. The cells were differentiated in the presence of M-CSF from the day of culture initiation to day 7, and the media were replaced with fresh media on days 3 and 6. On the eighth day, the MDMs were treated with factors differentiating them into macrophage classes: M0 (initial cells, stimulating factor: M-CSF 50 ng/mL), M1 (stimulating factor: LPS 100 ng/mL, INFγ 50 ng/mL), M2a (stimulatory factor: IL-4 50 ng/mL) and M2c (stimulatory factor: IL-10 50 ng/mL). The differentiation process was carried out in the absence or presence of calcitriol (1, 10, and 100 nM). After 48 h, the cells were treated with LPS for another 24 h. On day 11, the cells were collected for phenotypic analysis (flow cytometry). M-CSF, macrophage colony stimulating factor: 50 ng/mL; LPS, lipopolysaccharide: 100 ng/mL; INFγ, interferon gamma: 50 ng/mL; IL-4, interleukin 4:50 ng/mL; IL-10, interleukin 10:50 ng/mL.
Fig. 2
Fig. 2
Tumor tissue and TAM characteristics—selected protein expression. (A) EpCAM expression in tumor tissue from patients with various 25(OH)D3 plasma levels. N = 23 normal; N = 57 deficient. (B) Tumor tissue expression of transforming growth factor β (TGFβ; N = 32), epithelial cell adhesion molecule antigen (EpCAM; N = 39–40), osteopontin (OPN; N = 39–40) and (C) IRF4 (N = 38–40) in patients with low and high CYP27B1 (1α-hydroxylase) expression in tumor tissue. (A-C) Proteins expression was analyzed by western blot and protein tested/β-actin ratio is provided. (D) Representative blots showing EpCAM expression. (E) Representative blots showing TGFβ, OPN, and IRF4 expression. The patients were described as (D) for plasma 25(OH)D3 concentration (normal or deficient) and (D) and (E) for CYP27B1 expression (high + and low −). TAMs expression of (F) HLA-DR and CD44 isolated from metastatic and nonmetastatic patients (N = 14–36) and of G CD11b, CD80, HLA-DR, CD163, CD200R, CD204, and CD44 in patients with low and high CYP27B1 expression in tumor tissue (N = 21) were evaluated. (H) Gating strategy for flow cytometry analyses; CD11b staining is shown as an example. (F-H) The data were visualized using Flowing Software version 2.5.1. (https://flowingsoftware.com) and the fluorescence intensity was determined relative to that of the unstained control (MFI). Statistical analysis: Mann‒Whitney test; *P < 0.05, **P < 0.01, ***P < 0.001, ****P < 0.0001.
Fig. 3
Fig. 3
Correlations of vitamin D3 (VD)-related factors with the expression of selected proteins in tumor tissue. Spearman correlation coefficients for (A) 25(OH)D3 [ng/mL], (B) VDR, and (C) CYP24A1. The numbers of patients were as follows: (A) VD-normal, IRF4, N = 23; ZEB1, N = 20; premenopausal, IRF4, N = 28; lymph node metastatic (LN-metastatic), CYP24A1, N = 27; (B) VD-normal, ZEB1, N = 20; VD-deficient, CYP24A1, N = 57; premenopausal, ZEB1, N = 26; LN-metastatic, CYP24A1, N = 27; and  (C) postmenopausal, EpCAM, N = 51; and LN-metastatic, EpCAM and OPN, N = 27. IRF4, interferon-regulatory factor 4; ZEB1, proteins from the E-Box zinc finger family binding homeobox 1; CYP24A1, 24-hydroxylase; VDR, vitamin D receptor; EpCAM, epithelial cell adhesion molecule antigen; OPN, osteopontin; *P < 0.05, **P < 0.01.
Fig. 4
Fig. 4
CYP27B1 correlations with tumor tissue proteins. Spearman r correlations of CYP27B1 with (A) TGFβ: all patients N = 64, VD-normal N = 16, premenopausal N = 24, postmenopausal N = 40, nonmetastatic N = 39, LN-metastatic N = 21; (B) OPN: all patients N = 79, VD-normal N = 22, VD-deficient N = 57, premenopausal N = 28, postmenopausal N = 51, nonmetastatic N = 48, LN-metastatic N = 27; (C) IRF4: postmenopausal N = 40; (D) EpCAM: nonmetastatic N = 48, LN-metastatic N = 27. TGFβ, transforming growth factor β; OPN, osteopontin; IRF4, interferon-regulatory factor 4; EpCAM, epithelial cell adhesion molecule antigen; CYP27B1, 1α-hydroxylase; VD, vitamin D3; *P < 0.05, **P < 0.01, ***P < 0.001, ****P < 0.0001.
Fig. 5
Fig. 5
Correlations of OPN with other tumor tissue proteins. Spearman r correlations of OPN with (A) TGFβ: all patients, N = 65; VD-normal, N = 17; VD-deficient, N = 48; postmenopausal, N = 41; nonmetastatic, N = 40; (B) EpCAM: VD-normal, N = 23; postmenopausal, N = 52; and LN-metastatic, N = 27. TGFβ, transforming growth factor β; EpCAM, epithelial cell adhesion molecule antigen; OPN, osteopontin; VD, vitamin D3; *P < 0.05, **P < 0.01, ***P < 0.001.
Fig. 6
Fig. 6
Correlations of TAMs with the plasma concentration of 25(OH)D3 and the expression of CYP27B1 in tumor tissue. (A) Spearman r correlations of 25(OH)D3 [ng/mL] with CD80; N = 16. Spearman r correlations of 25(OH)D3 with (B) CD200R (all patients: N = 42, VD-deficient: N = 31, premenopausal: N = 15, nonmetastatic: N = 26), (C) CD80 (N = 16), (D) CD204 (postmenopausal: N = 27, nonmetastatic: N = 26), (E) CD44 (postmenopausal: N = 27, nonmetastatic: N = 26), and F HLA-DR (premenopausal: N = 15, nonmetastatic: N = 26). CYP27B1, 1α-hydroxylase; VD, vitamin D3; The expression of TAMs markers were analyzed using the BD FACS Diva™ 6.2 program, and the fluorescence intensity was determined relative to that of the unstained control (MFI). The expression of CYP27B1 was analyzed by western blot and CYP27B1/β-actin ratio are determined. *P < 0.05, **P < 0.01, ***P < 0.001.
Fig. 7
Fig. 7
Impact of calcitriol on the differentiation of MDMs from breast cancer patients (all). Expression of (A) CD14, (B) HLA-DR, (C) CD80, and (D) CD163 on M0, M1, M2a, and M2c macrophages. The cells were differentiated in the presence of M-CSF for 7 days, and the medium was replaced with fresh medium on days 3 and 6. On the eighth day, the MDMs were treated with factors differentiating them into macrophage classes: M0 (initial cells, stimulating factor: M-CSF 50 ng/mL), M1 (stimulating factor: LPS 100 ng/mL, INFγ 50 ng/mL), M2a (stimulatory factor: IL-4 50 ng/mL) and M2c (stimulatory factor: IL-10 50 ng/mL). The differentiation process was carried out in the absence or presence of calcitriol (1, 10, and 100 nM). After 48 h, the cells were treated with LPS for another 24 h. On day 11, the cells were collected for phenotypic analysis (flow cytometry analysis using the BD FACS Diva™ 6.2 program, and the fluorescence intensity was determined relative to that of the unstained control, MFI). M-CSF, macrophage colony stimulating factor; LPS, lipopolysaccharide; INFγ, interferon gamma; IL-4, interleukin 4; IL-10, interleukin 10. Additional file 1: Table S9 presents the detailed numbers of patients in each group analyzed. Statistical analysis: Dunn’s multiple comparison test; ns, nonsignificant; *P < 0.05, **P < 0.01, ***P < 0.001, ****P < 0.0001.
Fig. 8
Fig. 8
Impact of calcitriol on the differentiation of MDMs from breast cancer patients (VD-normal and VD-deficient). (A) CD14, (B) HLA-DR, and (C) CD200R expression in MDMs from breast cancer patients with normal 25(OH)D3 plasma concentrations. Expression of (D) CD14, (E) HLA-DR, (F) CD80 and (G) CD163 on MDMs from VD-deficient patients. The cells were differentiated in the presence of M-CSF for 7 days, and the medium was replaced with fresh medium on days 3 and 6. On the eighth day, the MDMs were treated with factors differentiating them into macrophage classes: M0 (initial cells, stimulating factor: M-CSF 50 ng/mL), M1 (stimulating factor: LPS 100 ng/mL, INFγ 50 ng/mL), M2a (stimulatory factor: IL-4 50 ng/mL) and M2c (stimulatory factor: IL-10 50 ng/mL). The differentiation process was carried out in the absence or presence of calcitriol (1, 10, and 100 nM). After 48 h, the cells were treated with LPS for another 24 h. On day 11, the cells were collected for phenotypic analysis (flow cytometry analysis using the BD FACS Diva™ 6.2 program, and the fluorescence intensity was determined relative to that of the unstained control, MFI). M-CSF, macrophage colony stimulating factor; LPS, lipopolysaccharide; INFγ, interferon gamma; IL-4, interleukin 4; IL-10, interleukin 10. Additional file 1: Table S9 presents the detailed numbers of patients in each group analyzed. Statistical analysis: Dunn’s multiple comparison test; ns, nonsignificant; *P < 0.05, **P < 0.01, ***P < 0.001.
Fig. 9
Fig. 9
Impact of calcitriol on the differentiation of MDMs from breast cancer patients (premenopausal and postmenopausal). (A) CD14, (B) HLA-DR, and (C) CD80 expression in MDMs from premenopausal breast cancer patients. Expression of (D) CD14, (E) HLA-DR, (F) CD80, and (G) CD163 on MDMs from postmenopausal patients. The cells were differentiated in the presence of M-CSF for 7 days, and the medium was replaced with fresh medium on days 3 and 6. On the eighth day, the MDMs were treated with factors differentiating them into macrophage classes: M0 (initial cells, stimulating factor: M-CSF 50 ng/mL), M1 (stimulating factor: LPS 100 ng/mL, INFγ 50 ng/mL), M2a (stimulatory factor: IL-4 50 ng/mL) and M2c (stimulatory factor: IL-10 50 ng/mL). The differentiation process was carried out in the absence or presence of calcitriol (1, 10, and 100 nM). After 48 h, the cells were treated with LPS for another 24 h. On day 11, the cells were collected for phenotypic analysis (flow cytometry analysis using the BD FACS Diva™ 6.2 program, and the fluorescence intensity was determined relative to that of the unstained control, MFI). M-CSF, macrophage colony stimulating factor; LPS, lipopolysaccharide; INFγ, interferon gamma; IL-4, interleukin 4; IL-10, interleukin 10. Additional file 1: Table S9 presents the detailed numbers of patients in each group analyzed. Statistical analysis: Dunn’s multiple comparison test; ns, nonsignificant; *P < 0.05, **P < 0.01, ***P < 0.001.
Fig. 10
Fig. 10
Impact of calcitriol on the differentiation of MDMs from breast cancer patients (nonmetastatic, LN-metastatic and with distant metastases). Expression of (A) CD14, (B) HLA-DR, (C) CD80, and (D) CD163 in MDMs from nonmetastatic breast cancer patients. Expression of (E) CD14 and F HLA-DR on MDMs from LN-metastatic patients. Expression of (G) CD14, (H) HLA-DR, and (I) CD163 on MDMs from patients with distant metastases. (J) Example histograms illustrating the data presented in Graph I (CD163 expression on M0 and M2c MDMs from patients with distant metastases). Monocytes were differentiated in the presence of M-CSF for 7 days, and the medium was replaced with fresh medium on days 3 and 6. On the eighth day, the MDMs were treated with factors differentiating them into macrophage classes: M0 (initial cells, stimulating factor: M-CSF 50 ng/mL), M1 (stimulating factor: LPS 100 ng/mL, INFγ 50 ng/mL), M2a (stimulatory factor: IL-4 50 ng/mL), and M2c (stimulatory factor: IL-10 50 ng/mL). The differentiation process was carried out in the absence or presence of calcitriol (1, 10, and 100 nM). After 48 h, the cells were treated with LPS for another 24 h. On day 11, the cells were collected for phenotypic analysis (flow cytometry analysis using the BD FACS Diva™ 6.2 program, and the fluorescence intensity was determined relative to that of the unstained control, MFI). M-CSF - macrophage colony stimulating factor; LPS, lipopolysaccharide; INFγ, interferon gamma; IL-4, interleukin 4; IL-10, interleukin 10; LN, lymph nodes. Additional file 1: Table S9 presents the detailed numbers of patients in each group analyzed. Statistical analysis: Dunn’s multiple comparison test; ns, nonsignificant; *P < 0.05, **P < 0.01, ***P < 0.001.
Fig. 11
Fig. 11
Correlations of the plasma 25(OH)D3 concentration with macrophage markers on MDMs differentiated into various classes. Spearman r correlations of 25(OH)D3 with CD80 on M2a (N = 23) and M2c (N = 27) and with CD163 on M0 (N = 23) MDMs. *P < 0.05, **P < 0.01.
Fig. 12
Fig. 12
VD decreased M1 and M2 macrophage markers. Summary of the most frequently observed correlations in tumor tissue and the ex vivo effect of calcitriol on the differentiation of MDMs into different classes.

References

    1. Vanhevel, J., Verlinden, L., Doms, S., Wildiers, H. & Verstuyf, A. The role of Vitamin D in Breast cancer risk and progression. Endocrine-Relat. Cancer.10.1530/ERC-21-0182 (2022). - PubMed
    1. Filip-Psurska, B., Zachary, H., Strzykalska, A., Wietrzyk, J. & Vitamin, D. Th17 lymphocytes, and breast cancer. Cancers (Basel)14, 3649. 10.3390/cancers14153649 (2022). - PMC - PubMed
    1. Eliassen, A. H. et al. Plasma 25-hydroxyvitamin D and risk of breast cancer in women followed over 20 years. Cancer Res.76, 5423–5430. 10.1158/0008-5472.CAN-16-0353 (2016). - PMC - PubMed
    1. Mohr, S. B., Gorham, E. D., Kim, J., Hofflich, H. & Garland, C. F. Meta-analysis of vitamin D sufficiency for improving survival of patients with breast cancer. Anticancer Res.34, 1163–6 (2014). - PubMed
    1. Chen, P. et al. Meta-analysis of vitamin D, calcium and the prevention of breast cancer. Breast Cancer Res. Treat.121, 469–477. 10.1007/s10549-009-0593-9 (2010). - PubMed

MeSH terms