. 2024 Oct;6(10):1939-1962.
doi: 10.1038/s42255-024-01134-4. Epub 2024 Sep 27.

Inhibition of hepatic oxalate overproduction ameliorates metabolic dysfunction-associated steatohepatitis

Affiliations

Inhibition of hepatic oxalate overproduction ameliorates metabolic dysfunction-associated steatohepatitis

Sandeep Das et al. Nat Metab. 2024 Oct.

Abstract

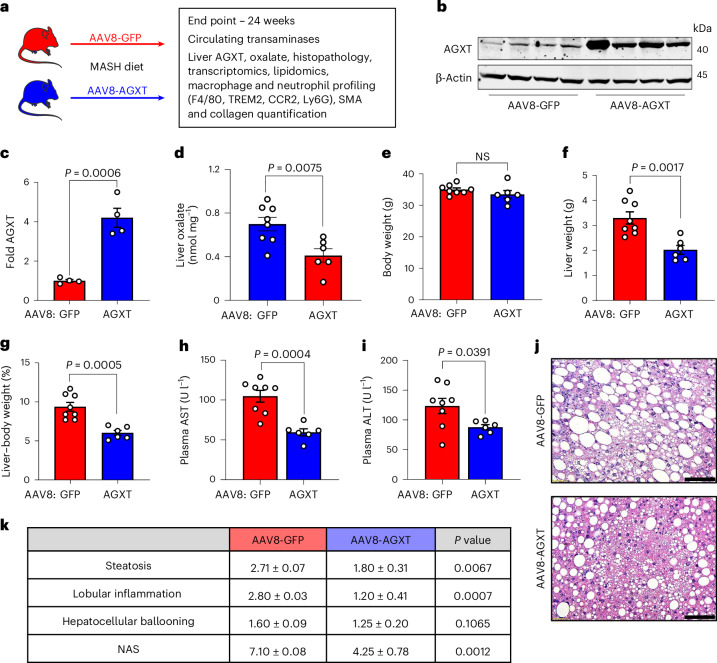
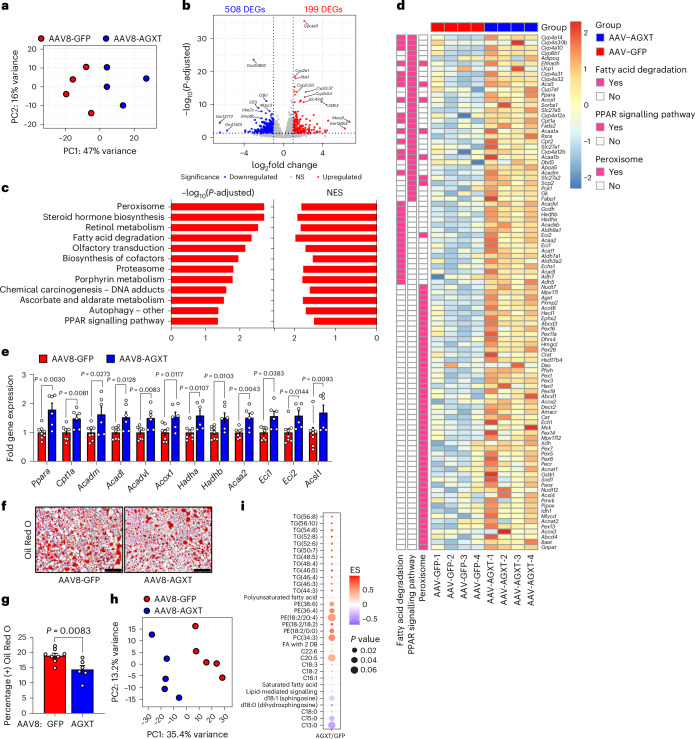
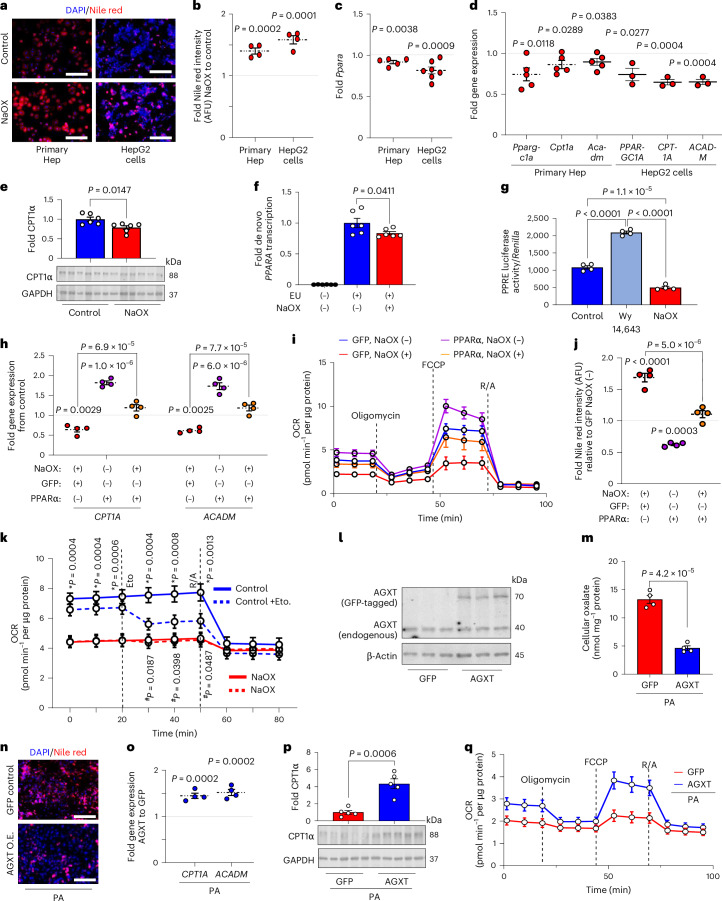
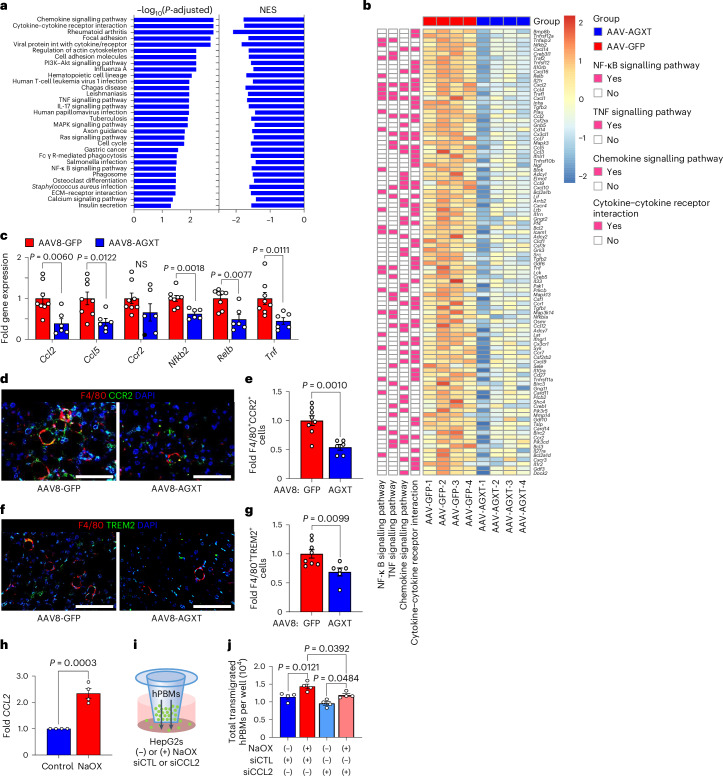
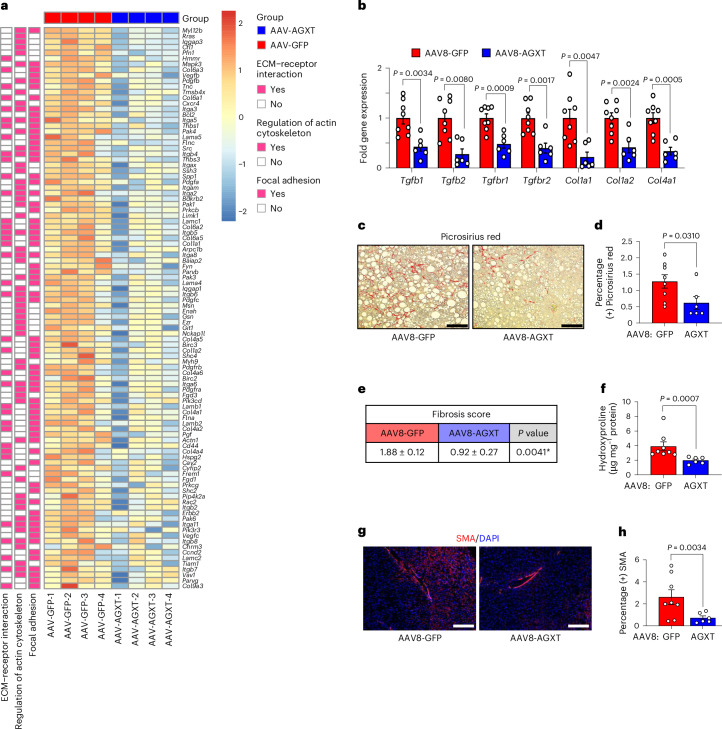
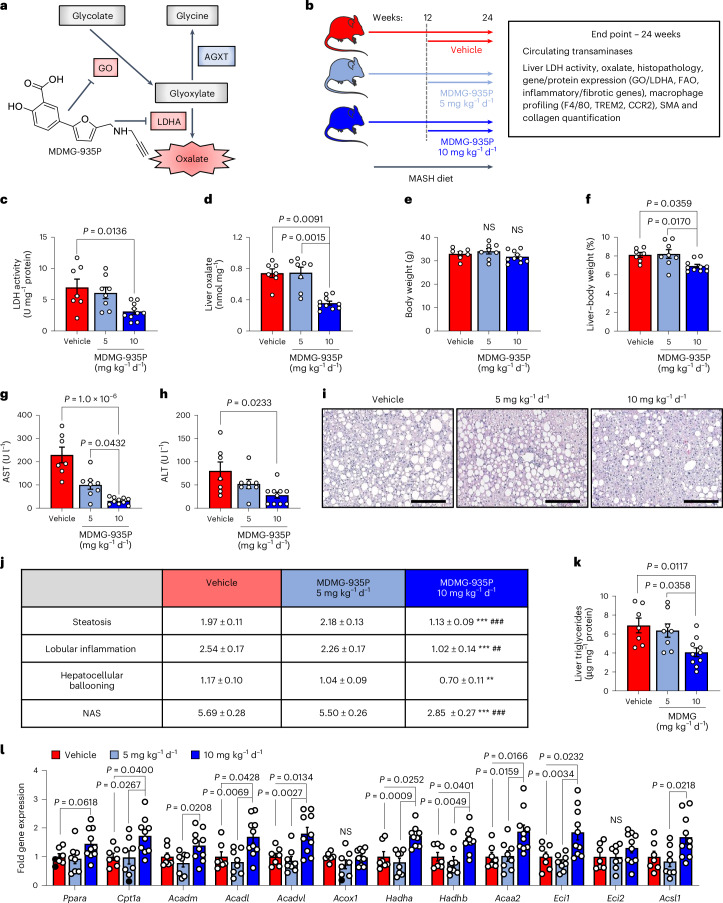
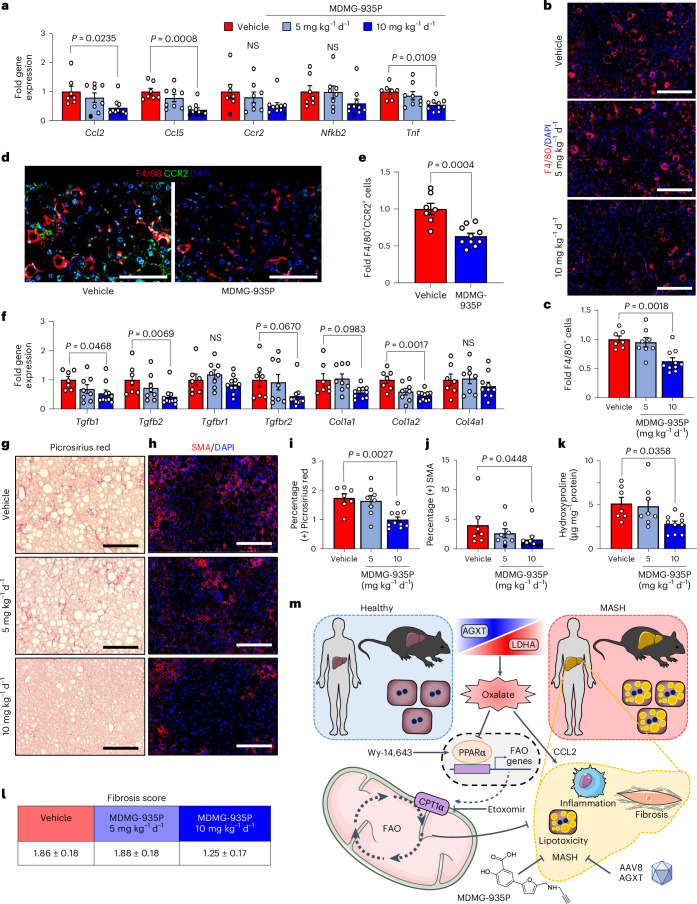
The incidence of metabolic dysfunction-associated steatohepatitis (MASH) is on the rise, and with limited pharmacological therapy available, identification of new metabolic targets is urgently needed. Oxalate is a terminal metabolite produced from glyoxylate by hepatic lactate dehydrogenase (LDHA). The liver-specific alanine-glyoxylate aminotransferase (AGXT) detoxifies glyoxylate, preventing oxalate accumulation. Here we show that AGXT is suppressed and LDHA is activated in livers from patients and mice with MASH, leading to oxalate overproduction. In turn, oxalate promotes steatosis in hepatocytes by inhibiting peroxisome proliferator-activated receptor-α (PPARα) transcription and fatty acid β-oxidation and induces monocyte chemotaxis via C-C motif chemokine ligand 2. In male mice with diet-induced MASH, targeting oxalate overproduction through hepatocyte-specific AGXT overexpression or pharmacological inhibition of LDHA potently lowers steatohepatitis and fibrosis by inducing PPARα-driven fatty acid β-oxidation and suppressing monocyte chemotaxis, nuclear factor-κB and transforming growth factor-β targets. These findings highlight hepatic oxalate overproduction as a target for the treatment of MASH.


Conflict of interest statement

O.R., M.D-G., J.A.G.-V. and F.A. have filed a patent application based on this work: targeting hepatic oxalate overproduction for the treatment of cardiometabolic diseases (PCT/US2024/17626). The other authors declare no competing interests.

Figures

Fig. 1
Fig. 1. AGXT is suppressed and LDHA is activated leading to oxalate overproduction in livers from humans and mice with MASH.
a, Schema of glyoxylate metabolism and oxalate formation. Spearman’s correlations were calculated between the expression of genes regulating glyoxylate metabolism or oxalate formation and hepatic fat in livers from transplantation donors (n = 206, GSE26106). A significant inverse correlation is denoted by blue arrows (*P < 0.05, **P < 0.01). The association between the expression of genes regulating glyoxylate metabolism or oxalate formation and MASH was assessed through regression models and a meta-analysis based on transcriptomics of livers from patients with or without MASH (MASH, n = 104; control, n = 44, GSE83452; MASH, n = 24; control, n = 24, GSE61260). A significant inverse association is denoted by purple arrows (**P < 0.01). b, H&E and Picrosirius red staining of liver samples obtained from patients with end-stage MASH (n = 22) compared with healthy donors as control (n = 10). cg, Expression of AGXT, GRHPR, PRODH2, HOGA1, HAO1 and LDHA relative to GAPDH (c), protein abundance (d) and quantification of AGXT relative to GAPDH (e), from liver samples of MASH patients (n = 23) and control (n = 10), LDH activity, from liver samples of patients with MASH (n = 20) and control (n = 10) (f) and oxalate concentrations normalized to tissue weight in liver samples from patients with end-stage MASH (n = 23) and controls (n = 10) (g). h,i, Liver samples were collected from C57BL/6J mice fed a standard chow diet (control, n = 6) or a high-fat, high-fructose, high-cholesterol diet (MASH diet, n = 6) for 24 weeks (h) and stained with H&E and Picrosirius red (i). jn, Expression of Agxt, Grhpr, Prodh2, Hoga1, Hao1 and Ldha relative to Gapdh (j), protein abundance (k) and quantification of AGXT relative to β-actin (l), LDH activity (m) and oxalate concentrations normalized to tissue weight in liver samples from mice (n) with (n = 6) or without MASH (n = 6). o, Primary hepatocytes (Hep) from mice fed a standard chow diet and HepG2 cells were treated with either BSA-conjugated PA (200 µM) or BSA control overnight. p, Protein abundance and quantification of AGXT relative to GAPDH (primary hepatocytes, n = 5) or β-actin (HepG2 cells, n = 6). q, Intracellular oxalate normalized to protein concentrations in primary hepatocytes treated with PA (200 µM) or increasing concentrations of sodium oxalate (NaOX; 0–250 µM, n = 4). For primary hepatocytes, each point represents an individual mouse. For HepG2 cells, each point represents an independent experiment that included at least two biological repetitions. The samples derived from the same experiment and blots were processed in parallel for d,e. All data are expressed as mean ± s.e.m. Statistical comparisons were made using two-tailed unpaired t-test (c,f,j,l,m), Mann–Whitney U-test (c,e,g,j,n,p) or one-way ANOVA with Tukey’s multiple comparisons test (q). All individual points and P values are shown. A P value < 0.05 was considered statistically significant; NS, not significant. Scale bars, 200 µm. Parts of h were drawn by using pictures from Servier Medical Art (licensed under a Creative Commons Attribution 3.0 Unported License at https://creativecommons.org/licenses/by/3.0). Source data
Fig. 2
Fig. 2. Oxalate lowering via hepatocyte-specific overexpression of AGXT ameliorates MASH.
a, Male C57BL/6J mice were injected with AAV8-TBG-GFP or AAV8-TBG-AGXT (2 × 1011 viral genomes per mouse) and placed on the MASH diet for 24 weeks before end point analyses. b,c, Protein abundance (b) and quantification (c) of AGXT relative to β-actin in liver samples from mice treated with AAV8-GFP (n = 4) or AAV-AGXT (n = 4). d, Oxalate concentrations normalized to tissue weight in liver samples from mice treated with AAV8-GFP (n = 8) or AAV8-AGXT (n = 6). eg, Body weight (e), liver weight (f) and liver-to-body weight ratios (g) in mice treated with AAV8-GFP (n = 8) or AAV8-AGXT (n = 6). h,i, Plasma samples were analysed for AST (h) and ALT (i) in mice treated with AAV8-GFP (n = 8) or AAV8-AGXT (n = 6). j,k, Liver samples were sectioned and stained with H&E (j) and scored for steatosis, lobular inflammation, hepatocellular ballooning and NAS (k) from mice treated with AAV8-GFP (n = 8) or AAV8-AGXT (n = 6). All data are expressed as mean ± s.e.m. Statistical comparisons were made using two-tailed unpaired t-test (c,ei,k), or Mann–Whitney U-test (d,k). A P value < 0.05 was considered statistically significant. Scale bars, 200 µm. Parts of a were drawn by using pictures from Servier Medical Art. Servier Medical Art by Servier is licensed under a Creative Commons Attribution 3.0 Unported License at https://creativecommons.org/licenses/by/3.0/. Source data
Fig. 3
Fig. 3. Oxalate lowering via hepatocyte-specific overexpression of AGXT curbs hepatic steatosis through induction of fatty acid β-oxidation pathways.
Male C57BL/6J mice were injected with AAV8-TBG-GFP or AAV8-TBG-AGXT (2 × 1011 viral genomes per mouse) and placed on the MASH diet for 24 weeks before end point analyses. a, PCA was performed based on RNA sequencing of livers from mice treated with AAV8-GFP or AAV8-AGXT (n = 4). b, Volcano plot of DEGs significantly upregulated (red) or downregulated (blue) in livers from mice treated with AAV8-AGXT compared to AAV8-GFP based on RNA sequencing (n = 4). c, Pathways significantly enriched in the upregulated DEGs and normalized enrichment scores (NES), based on KEGG pathway analysis comparing livers from mice treated with AAV8-GFP or AAV8-AGXT (n = 4). d, Heatmap of DEGs related to FAO pathways comparing livers from mice treated with AAV8-GFP or AAV8-AGXT (n = 4; colour bar, log2 fold change in AAV8-AGXT versus AAV-GFP). e, qRT–PCR validation of selected FAO-related DEGs relative to Gapdh in livers from mice treated with AAV8-GFP (n = 8) or AAV8-AGXT (n = 6). f, Liver samples were collected from mice treated with AAV8-GFP (n = 8) or AAV8-AGXT (n = 6) and stained with Oil Red O (red) and Harris hematoxylin nuclear counterstain. g, Percent-positive Oil Red O area from mice treated with AAV8-GFP (n = 8) or AAV8-AGXT (n = 6). h, PCA was performed based on untargeted lipidomics of livers from mice treated with AAV8-GFP or AAV8-AGXT (n = 5). i, Representation of lipid species increased (red) or decreased (blue) in livers from mice treated with AAV8-AGXT compared with AAV8-GFP (n = 5; colour bar, enrichment score (ES)). All data are expressed as mean ± s.e.m. Statistical comparisons were made using a two-tailed unpaired t-test (e,g) or Mann–Whitney U-test (e). A two-sided Wald test was used to identify DEGs (b). The significance of the enriched pathways (c) was determined by a right-tailed Fisher’s exact test followed by Benjamini–Hochberg multiple testing adjustment. All individual points and P values are shown. P < 0.05 was considered statistically significant. Scale bars, 200 µm. Source data
Fig. 4
Fig. 4. Oxalate induces lipid accumulation in hepatocytes by suppressing PPARα-regulated FAO.
Primary hepatocytes (Hep) isolated from mice fed a standard chow diet (n = 4) and HepG2 cells (n = 4) were treated with or without sodium oxalate (NaOX; 250 μM, primary mouse hepatocytes; 500 μM, HepG2 cells). a, Neutral lipids were visualized with Nile red stain (red) and nuclei were labelled with DAPI (blue). b, Intensity of Nile red staining was normalized to number of nuclei (DAPI) and expressed as fold change. AFU, arbitrary fluorescence units. c,d, Expression of PPARA (n = 5–7) (c) and its target genes regulating fatty acid β-oxidation (d) in primary hepatocytes (relative to Gapdh, n = 5) and in HepG2 cells (relative to GAPDH, n = 3) treated with or without NaOX. e, Protein abundance and quantification of CPT1α relative to GAPDH in HepG2 cells treated with and without NaOX overnight and expressed as fold change from control (without NaOX) (n = 6). f, De novo PPARA transcription assessed by the Click-iT Nascent RNA Capture assay in HepG2 cells incubated in the presence or absence of NaOX and the alkyne-modified nucleoside EU overnight. The EU-containing newly synthesized mRNAs were captured and precipitated with streptavidin magnetic beads and analysed by qRT–PCR for de novo synthesis of PPARA transcripts (n = 6). g, PPRE luciferase activity relative to Renilla luminescence in HepG2 cells transfected with PPREx3-TK-luciferase, human PPARα and Renilla constructs, and treated with vehicle (control), Wy 14,643 or NaOX for 24 h (n = 4). HepG2 cells were transfected with either GFP control (GFP) or PPARα plasmids. hj, After 24 h, the cells were treated overnight with or without NaOX followed by analyses of CPT1A and ACADM expression relative to GAPDH (n = 4) (h), OCRs determined by Seahorse and normalized to protein concentrations (n = 4) (i) and neutral lipids visualized with Nile red stain and normalized to number of nuclei (n = 4) (j). k, HepG2 cells were treated with or without NaOX overnight followed by Seahorse analysis of OCR in the absence or presence of etomoxir (Eto; *, control versus NaOX; #, control versus Control +Eto, n = 6). l, HepG2 cells were transfected with either GFP control (GFP) or GFP-tagged AGXT (AGXT) plasmids. Western blot analysis for AGXT protein abundance 48 h post-transfection (n = 3). mq, After 24 h, the cells were treated with BSA-conjugated PA (200 µM) overnight followed by analysis of intracellular oxalate normalized to protein concentrations (n = 4) (m), neutral lipids visualized with Nile red stain (red) with nuclei labelled with DAPI (blue) (n = 3) (n), expression of CPT1A and ACADM relative to GAPDH (n = 4) (o), protein abundance of CPT1α relative to GAPDH (n = 5–6) (p) and OCR determined by Seahorse analysis and normalized to protein concentrations (n = 3) (q). For primary hepatocytes, each point represents an individual mouse. For HepG2 cells, each point represents an independent experiment that included at least two biological repetitions. All data are expressed as mean ± s.e.m. Statistical comparisons were made using two-tailed unpaired t-test (be,m,o,p), Mann–Whitney U-test (f), or one-way ANOVA with Tukey’s multiple comparisons test (gk). Seahorse analysis and statistical comparisons for i and q are shown in Extended Data Fig. 7f and Extended Data Fig. 7k, respectively. All individual points and P values are shown. P < 0.05 was considered statistically significant. Scale bars, 200 µm. O.E., overexpression. Source data
Fig. 5
Fig. 5. Oxalate lowering via AGXT overexpression blunts monocyte infiltration and hepatic inflammation and fibrosis in MASH.
Mice were injected with AAV8-GFP or AAV8-AGXT (2 × 1011 viral genomes per mouse) and placed on the MASH diet for 24 weeks before end point analyses. a, Pathways significantly enriched in the downregulated DEGs and NES, based on KEGG pathway analysis comparing livers from mice treated with AAV8-GFP or AAV8-AGXT (n = 4). b, Heatmap of DEGs related to inflammatory pathways comparing livers from mice treated with AAV8-GFP or AAV8-AGXT (colour bar, log2 fold change in AAV8-AGXT versus AAV-GFP, n = 4). c, qRT–PCR validation of selected inflammation-related DEGs relative to Gapdh in livers from mice treated with AAV8-GFP (n = 8) or AAV8-AGXT (n = 6). d,e, Liver samples were collected from mice treated with AAV8-GFP (n = 8) or AAV8-AGXT (n = 6), stained for F4/80 (red), CCR2 (green) and DAPI (blue) to visualize nuclei (d), analysed for F4/80+ and CCR2+ cells and expressed as fold change from AAV8-GFP (e), from mice treated with AAV8-GFP (n = 8) or AAV8-AGXT (n = 6). f,g, Liver samples were collected from mice treated with AAV8-GFP (n = 8) or AAV8-AGXT (n = 6), stained for F4/80 (red), TREM2 (green) and DAPI (blue) to visualize nuclei (f), analysed for F4/80+ and TREM2+ cells (g) and expressed as fold change from AAV8-GFP, from mice treated with AAV8-GFP (n = 8) or AAV8-AGXT (n = 6). h, Expression of CCL2 relative to GAPDH in HepG2 cells treated with or without NaOX overnight and expressed as fold change from control (n = 4). i, HepG2 cells were plated into the bottom chamber of a Transwell and transfected with siRNA against CCL2 (siCCL2) or scrambled siRNA control (siCTL). After 24 h, cells were treated with or without NaOX overnight. Fluorescently labelled hPBMs (green) were loaded into the top chamber of the Transwell and allowed to pass through a membrane overnight. j, Number of transmigrated hPBMs per well (n = 4). All data are expressed as mean ± s.e.m. Statistical comparisons were made using two-tailed unpaired t-test (c,e,g,h), Mann–Whitney U-test (c) or one-way ANOVA with Tukey’s multiple comparisons test (j). The significance of the enriched pathways (a) was determined by right-tailed Fisher’s exact test followed by Benjamini–Hochberg multiple testing adjustment. All individual points and P values are shown. P < 0.05 was considered statistically significant. Scale bars, 200 µm. Source data
Fig. 6
Fig. 6. Oxalate lowering via AGXT overexpression decreases hepatic fibrosis in MASH.
Mice were injected with AAV8-GFP or AAV8-AGXT (2 × 1011 viral genomes per mouse) and placed on the MASH diet for 24 weeks before end point analyses. a, Heatmap of DEGs related to fibrosis pathways comparing livers from mice treated with AAV8-GFP or AAV8-AGXT (colour bar, log2 fold change in AAV8-AGXT versus AAV-GFP, n = 4). b, qRT–PCR validation of selected fibrosis-related DEGs relative to Gapdh in livers from mice treated with AAV8-GFP (n = 8) or AAV8-AGXT (n = 6). c, Liver samples were collected from mice treated with AAV8-GFP (n = 8) or AAV8-AGXT (n = 6) and stained with Picrosirius red (red). d, Percent-positive Picrosirius red area from mice treated with AAV8-GFP (n = 8) or AAV8-AGXT (n = 6). e, Liver sections from mice treated with AAV8-GFP (n = 8) or AAV8-AGXT (n = 6) were scored for fibrosis. f, Hydroxyproline contents normalized to protein concentrations in liver samples from mice treated with AAV8-GFP (n = 8) or AAV8-AGXT (n = 6). g, Liver samples were collected from mice treated with AAV8-GFP (n = 8) or AAV8-AGXT (n = 6) and stained with α-SMA (red) and DAPI (blue). h, Percent-positive α-SMA area from mice treated with AAV8-GFP (n = 8) or AAV8-AGXT (n = 6). All data are expressed as mean ± s.e.m. Statistical comparisons were made using two-tailed unpaired t-test (b,e,h) or Mann–Whitney U-test (b,d,f). All individual points and P values are shown. P < 0.05 was considered statistically significant. Scale bars, 200 µm. Source data
Fig. 7
Fig. 7. Pharmacological targeting of hepatic oxalate overproduction ameliorates established MASH.
a, Schema of glyoxylate/oxalate metabolism, including the chemical structure of MDMG-935P and its inhibitory effects. b, Male C57BL/6J mice were fed the MASH diet for 12 weeks, then orally administered vehicle (n = 7), 5 mg kg−1 d−1 (n = 8) or 10 mg kg−1 d−1 (n = 10) of MDMG-935P for an additional 12 weeks on the MASH diet before end point analyses. c,d, Liver LDH activity (c) and oxalate concentrations normalized to tissue weight (d) in liver samples from mice administered vehicle (n = 7), 5 mg kg−1 d−1 (n = 8) or 10 mg kg−1 d−1 (n = 10) of MDMG-935P. ej, Body weight (e) and liver-to-body weight ratios (f) in mice administered vehicle (n = 7), 5 mg kg−1 d−1 (n = 8) or 10 mg kg−1 d−1 (n = 10) of MDMG-935P. Plasma samples were analysed for AST (g) and ALT (h) in mice administered vehicle (n = 7), 5 mg kg−1 d−1 (n = 8) or 10 mg kg−1 d−1 (n = 10) of MDMG-935P. Liver samples were collected from mice administered vehicle (n = 7), 5 mg kg−1 d−1 (n = 8) or 10 mg kg−1 d−1 (n = 10) of MDMG-935P, stained with H&E (i) and scored for steatosis, lobular inflammation, hepatocellular ballooning and NAS (j). **P < 0.01, ***P < 0.001 versus vehicle; ##P < 0.01, ###P < 0.001 versus 5 mg kg−1 d−1 of MDMG-935P. k, Liver triglycerides normalized to protein concentrations from mice treated with vehicle (n = 7), 5 mg kg−1 d−1 (n = 8) or 10 mg kg−1 d−1 (n = 10) of MDMG-935P. l, Liver samples were collected from mice treated with vehicle (n = 7), 5 mg kg−1 d−1 (n = 8) or 10 mg kg−1 d−1 (n = 10) of MDMG-935P and FAO-related genes relative to Gapdh were assessed by qRT–PCR. All data are expressed as mean ± s.e.m. Statistical comparisons were made using one-way ANOVA with Tukey’s multiple comparisons test (cg,jl) or Kruskal–Wallis with Dunn’s multiple comparisons test (h,j,l). P < 0.05 was considered statistically significant. Scale bars, 200 µm. Parts of b were drawn by using pictures from Servier Medical Art. Servier Medical Art by Servier is licensed under a Creative Commons Attribution 3.0 Unported License at https://creativecommons.org/licenses/by/3.0/. Source data
Fig. 8
Fig. 8. Pharmacological targeting of hepatic oxalate overproduction reduces hepatic inflammation and fibrosis.
Male C57BL/6J mice were fed the MASH diet for 12 weeks, then orally administered vehicle (n = 7), 5 mg kg−1 d−1 (n = 8) or 10 mg kg−1 d−1 (n = 10) of MDMG-935P for an additional 12 weeks on the MASH diet before end point analyses. a, Liver samples were collected from the treated mice, and inflammation-related genes were assessed by qRT–PCR relative to Gapdh from mice treated with vehicle (n = 7), 5 mg kg−1 d−1 (n = 8) or 10 mg kg−1 d−1 (n = 10) MDMG-935P. b,c, Liver samples were collected from the mice treated with vehicle (n = 7), 5 mg kg−1 d−1 (n = 8) or 10 mg kg−1 d−1 (n = 10) MDMG-935P, stained with F4/80 (red) and DAPI (blue) to visualize nuclei (b), analysed for F4/80+ cells and expressed (c) as fold change from vehicle. d,e, Liver samples were collected from mice treated with vehicle (n = 7) or 10 mg kg−1 d−1 (n = 10) of MDMG-935P, stained for F4/80 (red), CCR2 (green) and DAPI (blue) (d), analysed for F4/80+ and CCR2+ cells (e) and expressed as fold change from vehicle. f, Liver samples were collected from the treated mice and fibrosis-related genes were assessed by qRT–PCR relative to Gapdh from mice treated with vehicle (n = 7), 5 mg kg−1 d−1 (n = 8) or 10 mg kg−1 d−1 (n = 10) MDMG-935P. g,i, Liver sections were stained with Picrosirius red (red) (g) and quantified for percent-positive Picrosirius red area (i) from mice treated with vehicle (n = 7), 5 mg kg−1 d−1 (n = 8) or 10 mg kg−1 d−1 (n = 10) MDMG-935P. h,j, Liver sections were stained with α-SMA and DAPI (blue) (h) and analysed for percent-positive α-SMA area (j) from mice treated with vehicle (n = 7), 5 mg kg−1 d−1 (n = 8) or 10 mg kg−1 d−1 (n = 10) MDMG-935P. k, Hydroxyproline contents normalized to protein concentration in liver samples from mice treated with vehicle (n = 7), 5 mg kg−1 d−1 (n = 8) or 10 mg kg−1 d−1 (n = 10) MDMG-935P. l, Liver sections were scored for fibrosis based on Picrosirius red staining. m, Schematic summary of oxalate overproduction in MASH, the effects of oxalate on MASH, and inhibition of oxalate production by either AAV-AGXT overexpression or pharmacological targeting using MDMG-935P. All data are expressed as mean ± s.e.m. Statistical comparisons were made using one-way ANOVA with Tukey’s multiple comparisons test (a,c,i,k,l), Kruskal–Wallis with Dunn’s multiple comparisons test (a,f,j), or two-tailed unpaired t-test (e). All individual points and P values are shown. P < 0.05 was considered statistically significant. Scale bars, 200 μm. Parts of m were drawn by using pictures from Servier Medical Art. Servier Medical Art by Servier is licensed under a Creative Commons Attribution 3.0 Unported License at https://creativecommons.org/licenses/by/3.0/. Source data
Extended Data Fig. 1
Extended Data Fig. 1. Dysregulated oxalate metabolism in human MASH.
a, Distribution of age, sex (M, male; F, female), and race among patients with end-stage MASH (n=23) or healthy donors (Control, n=10). b, protein abundance and (c) quantification of LDHA relative to GAPDH in liver specimens from patients with MASH (n=23) or controls (n=10). d, Spearman’s correlation between the relative abundance of AGXT protein and liver oxalate in samples from patients with MASH (n=23) and controls (n=10). e, Liver sections from patients with MASH (n=22) and controls (n=10) were scored for steatosis, lobular inflammation, hepatocellular ballooning, and NAS, then correlated with the relative abundance of AGXT protein, and (f) liver oxalate concentrations. g, Distribution of age, sex (M, male; F, female), and race, and levels of aspartate aminotransferase (AST), alanine aminotransferase (ALT), alkaline phosphatase (ALP), and oxalate in plasma samples from patients with (n=27) or without (Control, n=32) MASH. The samples were derived from the same experiment and blots were processed in parallel for (b, c). All data are expressed as mean ± SEM. Statistical comparisons were made using two-sided Chi-squared test (a, g), two-tailed Mann–Whitney U test (a, c, g), or Spearman’s correlation (d-f). A p value <0.05 was considered statistically significant. Source data
Extended Data Fig. 2
Extended Data Fig. 2. Dysregulated oxalate metabolism in murine MASH.
a, Liver samples were collected from C57BL/6J mice fed a standard chow diet (Control, n=6) or a high-fat, high-fructose, high-cholesterol diet (MASH diet, n=6) for 12 weeks, and (b) stained with H&E and Picrosirius Red. c, Expression of Agxt, Grhpr, Prodh2, Hoga1, Hao1, and Ldha relative to Gapdh, (d, e) protein abundance and quantification of AGXT, and (f, g) LDHA relative to β-Actin, (h) LDH activity, and (i) oxalate concentrations normalized to tissue weight in liver samples from mice with (n=6) or without early MASH (12 weeks, n=6). j, Protein abundance and (k) quantification of LDHA in liver samples from mice with or without advanced MASH (24 weeks, n=6). l, Ion chromatography coupled with mass spectrometry (IC-MS) validation of oxalate concentrations normalized to tissue weight in liver samples from mice with or without MASH (24 weeks, n=4). m, Liver sections from mice fed the standard chow or MASH diet for 12 weeks (n=6) or 24 weeks (n=6) were scored for steatosis, lobular inflammation, hepatocellular ballooning, and NAS, then correlated with the relative abundance of AGXT protein, and (n) liver oxalate concentrations. Statistical comparisons were made using two-tailed unpaired t-test (c, e, g, h, i, k, l), Mann–Whitney U test (c), or Spearman’s correlation (m, n). A p value <0.05 was considered statistically significant. Scale bars = 200 µm. Parts of Extended Data Fig. 2a were drawn by using pictures from Servier Medical Art. Servier Medical Art by Servier is licensed under a Creative Commons Attribution 3.0 Unported License (https://creativecommons.org/licenses/by/3.0/. Source data
Extended Data Fig. 3
Extended Data Fig. 3. Suppression and hypermethylation of AGXT in MASH and optimization of sodium oxalate studies in hepatocytes.
Liver samples were collected from (a) male and (b) female mice fed a standard chow diet (Control) or the fructose-palmitate-cholesterol (FPC) diet for 4 months and stained with H&E. Protein abundance and quantification of AGXT relative to GAPDH in livers from males (c, d) and female mice (e, f) with and without MASH (n=6). (g) Methylation analysis using the methylKit R package (methylKit_1.28.0) from mice with advanced MASH (24 weeks on the MASH diet) or controls (n=4). h, Neutral lipids visualized by Nile Red staining (red) and nuclei labelled with DAPI (blue) in primary hepatocytes from mice fed a standard chow diet (n=3) and HepG2 cells (n=4) (i) treated with either BSA-conjugated palmitic acid (BSA-PA, 200 µM) or BSA control overnight. j, Expression of Agxt relative to Gapdh in primary mouse hepatocytes (n=3), and of AGXT relative to GAPDH in HepG2 cells (n=6). k, Intracellular oxalate normalized to protein concentrations in HepG2 cells treated with PA (200 µM) or increasing concentrations of sodium oxalate (NaOX, 0–500 µM, n=4). For primary hepatocytes, each point represents an individual mouse. For HepG2 cells, each point represents an independent experiment that included at least 2 biological repetitions. l, Assessment of calcium-oxalate deposition as birefringent crystals detected by polarization microscopy in HepG2 cells (n=4), and primary hepatocytes (n=4) (m) treated overnight with increasing concentrations of NaOX (0–10 mM). All data are expressed as mean ± SEM. Statistical comparisons were made using two-tailed unpaired t-test (d, f, j), Fisher’s exact test for pairwise comparison (g), or one-way ANOVA with Tukey’s multiple comparisons test (k). All individual points and p values are shown. A p value <0.05 was considered statistically significant. Scale bars = 200 µm. Source data
Extended Data Fig. 4
Extended Data Fig. 4. Hepatocyte-specific overexpression of AGXT on MASH or standard chow diet.
Male C57BL/6J mice were injected with AAV8-TBG-GFP or AAV8-TBG-AGXT (2x10¹¹ viral genomes per mouse) and placed on the MASH diet for 24 weeks prior to end point analyses. a, Livers from mice injected with AAV8-TBG-GFP (n=4) were sectioned and assessed by immunofluorescence for GFP (green) expression in hepatocytes (Arg1, red, scale bar = 50 μm). b, Kidney lysates from mice injected with AAV8-GFP or AAV8-AGXT were assessed for AGXT by Western blot (n=4). Equal protein loading was verified using GAPDH expression and Ponceau S staining. c, Representative gross appearance of the abdominal cavity from mice treated with AAV8-GFP (n=8) or AAV8-AGXT (n=6). d, Representative gross appearance of the livers from mice treated with AAV8-GFP (n=8) or AAV8-AGXT (n=6). Male C57BL/6J mice were injected with AAV8-TBG-GFP or AAV8-TBG-AGXT (2x10¹¹ viral genomes per mouse) and placed on the standard chow diet for 12 weeks prior to end point analyses. e, Protein abundance, and (f) quantification of AGXT relative to β-Actin in liver samples from mice treated with AAV8-GFP (n=8) or AAV8-AGXT (n=10). g, Oxalate normalized to liver tissue weight in samples from mice treated with AAV8-GFP (n=9) or AAV8-AGXT (n=10). h, Body weight, (i) liver weight, and (j) liver-to-body weight ratios in mice treated with AAV8-GFP (n=9) or AAV8-AGXT (n=10). k, Plasma samples were analysed for aspartate transaminase (AST), and (l) alanine transaminase (ALT) in mice treated with AAV8-GFP (n=9) or AAV8-AGXT (n=10). m, Liver samples from mice treated with AAV8-GFP (n=9) or AAV8-AGXT (n=10) were sectioned and stained with H&E (scale bar = 200 μm). The samples were derived from the same experiment and blots were processed in parallel for (e, f). All data are expressed as mean ± SEM. Statistical comparisons were made using two-tailed unpaired t-test (f-j, l), or Mann–Whitney U test (k). All individual points and p values are shown. A p value <0.05 was considered statistically significant. Source data
Extended Data Fig. 5
Extended Data Fig. 5. Effects of hepatocyte-specific overexpression of AGXT on hepatic lipids on MASH or standard chow diet.
Male C57BL/6J mice were injected with AAV8-TBG-GFP or AAV8-TBG-AGXT (2x10¹¹ viral genomes per mouse) and placed on the MASH diet for 24 weeks prior to end point analyses. a, Liver triglycerides normalized to protein concentrations in livers from mice treated with AAV8-GFP (n=8) or AAV8-AGXT (n=6). b, Volcano plot of lipid metabolites significantly increased (red) or decreased (blue) in livers from mice treated with AAV8-AGXT compared to AAV8-GFP based on untargeted lipidomics (n=5). c, Pathway enrichment analysis (scale bar = enrichment score, ES), and heatmaps of (d) sphingomyelins, (e) ceramides, and (f) hexosylceramides in livers from mice treated with AAV8-AGXT compared to AAV8-GFP based on untargeted lipidomics (n=5, scale bar: relative abundance). g, Relative liver malondialdehyde (MDA) levels normalized to protein concentrations in mice treated with AAV8-GFP (n=8) or AAV8-AGXT (n=6). h, Male C57BL/6J mice were injected with AAV8-TBG-GFP or AAV8-TBG-AGXT (2x10¹¹ viral genomes per mouse) and placed on a standard chow diet for 12 weeks prior to end point analyses. qRT-PCR analyses of Ppara and its target genes relative to Gapdh in livers from mice treated with AAV8-GFP (n=9) or AAV8-AGXT (n=10). i, Liver triglycerides normalized to protein concentrations in livers from mice treated with AAV8-GFP (n=9) or AAV8-AGXT (n=10). All data are expressed as mean ± SEM. Statistical comparisons were made using two-tailed unpaired t-test (a-c, g, h), or Mann–Whitney U test (i). All individual points and p values are shown. A p value <0.05 was considered statistically significant. Source data
Extended Data Fig. 6
Extended Data Fig. 6. Effects of oxalate and its precursors on genes regulating lipid metabolism and lipid accumulation in hepatocytes.
Primary hepatocytes isolated from mice fed a standard chow diet and HepG2 cells were treated overnight with or without sodium oxalate (NaOX, 250 μM, primary mouse hepatocytes; 500 μM, HepG2 cells). Expression of genes regulating fatty acid uptake/transport in (a) primary hepatocytes relative to Gapdh (n=5), and (b) in HepG2 cells relative to GAPDH (n=4). Expression of genes regulating fatty acid and lipid biosynthesis in (c) primary hepatocytes relative to Gapdh (n=5), and (d) in HepG2 cells relative to GAPDH (n=3). Primary hepatocytes and HepG2 cells were treated overnight with increasing concentrations of the oxalate precursor, hydroxyproline (0–10 mM). e, Neutral lipids were visualized with Nile Red stain (red) and nuclei were labelled with DAPI. Intensity of Nile Red staining in primary hepatocytes (n=4) (f) and HepG2 cells (n=4) (g) was normalized to number of nuclei (DAPI) and expressed as fold change. Primary hepatocytes and HepG2 cells were treated overnight with increasing concentrations of the oxalate precursor, glycolate (0–10 mM). h, Neutral lipids were visualized with Nile Red stain (red) and nuclei were labelled with DAPI. Intensity of Nile Red staining in primary hepatocytes (i) and HepG2 cells (j) was normalized to number of nuclei (DAPI) and expressed as fold change (n=4). Primary hepatocytes and HepG2 cells were treated overnight with 10 mM of hydroxyproline (k) or glycolate (l). The expression of Ppara and Cpt1a in primary hepatocytes was normalized to Gapdh, and the expression of PPARA and CPT1A in HepG2 cells was normalized to GAPDH (n=4). Primary hepatocytes and HepG2 cells were treated overnight with 10 mM of hydroxyproline (m, n) or glycolate (o, p), followed by analysis of intracellular oxalate normalized to protein concentrations (n=4). For primary hepatocytes, each point represents an individual mouse. For HepG2 cells, each point represents an independent experiment that included at least 2 biological repetitions. All data are expressed as mean ± SEM. Statistical comparisons were made using two-tailed unpaired t-test (a-d, k-p), or one-way ANOVA with Tukey’s multiple comparisons test (e-j). All individual points and p values are shown. A p value <0.05 was considered statistically significant. Scale bar = 200 µm. Source data
Extended Data Fig. 7
Extended Data Fig. 7. Effects of oxalate and AGXT overexpression on PPARα, mitochondrial bioenergetics and function in hepatocytes.
HepG2 cells were treated overnight with or without sodium oxalate (NaOX, 500 μM). a, PPARA gene expression relative to GAPDH in HepG2 cells treated with (red dots) or without (control, blue dots) NaOX and with (dashed line) or without (vehicle, solid line) actinomycin D (5 μg/mL) overnight and expressed as fold change from control (without NaOX or actinomycin D) (n=4). b, HepG2 cells were transfected with either GFP control (GFP) or PPARα plasmids. After 48 h, the cells were lysed for Western blot analysis of PPARα relative to GAPDH (n=4). c, Expression of CPT1A and ACADM relative to GAPDH in HepG2 cells treated with or without NaOX, Wy 14,643 or vehicle control (ethanol) overnight and expressed as fold change from control (without NaOX with ethanol) (n=5). d, Oxygen consumption rate (OCR) determined by Seahorse analysis in HepG2 cells treated with or without NaOX overnight. OCR was normalized to protein concentrations, and (e) data were analysed for non-mitochondrial consumption, basal respiration, maximal respiration, proton leak, and ATP production and expressed as fold change from control cells (n=5). HepG2 cells were transfected with either GFP control (GFP) or PPARα plasmids. After 24 h, the cells were treated overnight with or without NaOX followed by analyses of (f) OCR by Seahorse and determination of mitochondrial consumption, basal respiration, maximal respiration, proton leak, and ATP production (n=4), and (g) neutral lipids visualized with Nile Red stain (red) with nuclei labelled with DAPI (blue) (n=4). h, Mitochondrial superoxide was visualized with MitoSOX (red) and nuclei were labelled with Hoechst (blue) in HepG2 cells treated with or without sodium oxalate (NaOX, 500 μM). i, Intensity of MitoSOX was normalized to number of nuclei (Hoechst) and expressed as fold change from control (n=3). HepG2 cells were transfected with either GFP control (GFP) or GFP-tagged AGXT (AGXT) plasmids. After 24 h, the cells were treated with either BSA control or BSA-conjugated palmitic acid (PA 200 µM) overnight. j, Neutral lipids were visualized with Nile Red stain and nuclei were labelled with DAPI. Intensity of Nile Red staining was normalized to number of nuclei (DAPI) and expressed as fold change from GFP control (n=3). k, Seahorse analysis of non-mitochondrial consumption, basal respiration, maximal respiration, proton leak, and ATP production expressed as fold change from GFP control (n=3). l, Mitochondrial superoxide was visualized with MitoSOX (red) and nuclei were labelled with Hoechst (blue). m, Intensity of MitoSOX was normalized to number of nuclei (Hoechst) and expressed as fold change from GFP control (n=3). Each point represents an independent experiment that included at least 2 biological repetitions. All data are expressed as mean ± SEM. Statistical comparisons were made using two-tailed unpaired t-test (e, i-k, m), two-way ANOVA with Bonferroni’s multiple comparisons test (c, f). All individual points and p values are shown. A p value <0.05 was considered statistically significant. Scale bar = 200 µm. Source data
Extended Data Fig. 8
Extended Data Fig. 8. Oxalate lowering via AGXT overexpression reduces hepatic macrophages, while oxalate induces monocyte chemotaxis via CCL2.
Mice were injected with AAV8-GFP or AAV8-AGXT (2x10¹¹ viral genomes per mouse) and placed on the MASH diet for 24 weeks prior to end point analyses. a, Liver samples were collected from mice treated with AAV8-GFP (n=8) or AAV8-AGXT (n=6), stained for F4/80 (red) and DAPI (blue) to visualize nuclei, analysed for (b) F4/80+ cells and expressed as fold change from AAV8-GFP. c, Liver samples were collected from mice treated with AAV8-GFP (n=8) or AAV8-AGXT (n=6), stained for Ly6G (green) and DAPI (blue) to visualize nuclei, analysed for (d) Ly6G+ cells and expressed as fold change from AAV8-GFP. e, HepG2 cells were transfected with either GFP control (GFP) or PPARα plasmids. After 24 h, the cells were treated overnight with or without sodium oxalate (NaOX) followed by analysis of CCL2 expression relative to GAPDH (n=4). f, HepG2 cells were plated into the bottom chamber of a transwell and treated with or without NaOX overnight. Fluorescently labelled human peripheral blood monocytes (hPBMs, green) were loaded into the top chamber of the transwell and allowed to pass through a membrane overnight. g, Number of transmigrated hPBMs per well (n=4). h, hPBMs were visualized (green) and shown with HepG2 cells (brightfield, inset) (n=4). i, HepG2 cells were transfected with siRNA against CCL2 (siCCL2) or scrambled siRNA control (siCTL). After 48 hours, the expression of CCL2 relative to GAPDH was determined by qRT-PCR (n=4). j, HepG2 cells were plated into the bottom chamber of a transwell and transfected with siRNA against CCL2 (siCCL2) or scrambled siRNA control (siRNA). After 24 hours, cells were treated with or without NaOX overnight. Fluorescently labelled human peripheral blood monocytes (hPBMs, green) were loaded into the top chamber of the transwell and allowed to pass through a membrane overnight. hPBMs were visualized (green) and shown with HepG2 cells (brightfield, inset) (n=4). All data are expressed as mean ± SEM. Statistical comparisons were made using two-tailed unpaired t-test (b, d, g, i) or one-way ANOVA with Tukey’s multiple comparison’s test (e). All individual points and p values are shown. A p value <0.05 was considered statistically significant. Scale bars = 200 µm. Source data
Extended Data Fig. 9
Extended Data Fig. 9. Integration of the hepatic lipidome and transcriptome in mice overexpressing AGXT.
Male C57BL/6J mice were injected with AAV8-TBG-GFP or AAV8-TBG-AGXT (2x10¹¹ viral genomes per mouse) and placed on the MASH diet for 24 weeks prior to end point analyses. a, Principal component analysis was performed based on untargeted lipidomics integrated with RNA-sequencing of livers from the same mice treated with AAV8-GFP or AAV8-AGXT (n=4). b, Heatmap of proinflammatory and lipotoxic sphingolipid metabolites (sphingomyelins, ceramides, and hexosylceramides) integrated with DEGs related to inflammatory and fibrotic pathways comparing livers from mice treated with AAV8-GFP or AAV8-AGXT (n=4, scale bar: relative abundance). Spearman’s correlations were calculated between the expression of proinflammatory/fibrotic genes and the abundance of (c) proinflammatory sphingolipid metabolites, and (d) PUFAs in triglycerides in livers from mice treated with AAV8-GFP or AAV8-AGXT. A p value <0.05 was considered statistically significant. Source data
Extended Data Fig. 10
Extended Data Fig. 10. Effects of MDMG-935P treatment on MASH or standard chow diet.
Male C57BL/6J mice were fed the MASH diet for 12 weeks, then orally administered vehicle (n=7), 5 mg/kg/day (n=8) or 10 mg/kg/day (n=10) of MDMG-935P for an additional 12 weeks on the MASH diet prior to end point analyses. Liver samples were collected from the treated mice and the expression of (a) Hao1, and (b) Ldha relative to Gapdh was assessed by qRT-PCR. Protein abundance of GO (c, e), and LDHA (d, f) relative to β-Actin in liver samples from mice treated with vehicle, 5 mg/kg/day or 10 mg/kg/day of MDMG-935P. g, Liver weight, and (h) representative gross appearance of abdominal cavities and livers from mice treated with vehicle, 5 mg/kg/day or 10 mg/kg/day of MDMG-935P. C57BL/6J mice were fed a standard chow diet for 12 weeks, then orally administered vehicle (n=10), or 10 mg/kg/day of MDMG-935P (n=8) for an additional 12 weeks on the standard chow diet prior to end point analyses. i, body weight, (j) liver weight, and (k) liver oxalate in mice treated with vehicle (n=10) or 10 mg/kg/day of MDMG-935P (n=8). l, Plasma samples were analysed for aspartate transaminase (AST), and (m) alanine transaminase (ALT) in mice treated with vehicle (n=10) or 10 mg/kg/day of MDMG-935P (n=8). n, Liver triglycerides normalized to protein concentrations in livers from mice treated with vehicle (n=10) or 10 mg/kg/day of MDMG-935P (n=8). o, Livers from mice treated with vehicle (n=10) or 10 mg/kg/day of MDMG-935P (n=8) were sectioned and stained with H&E. p, Liver samples were collected from mice treated with vehicle (n=10), or 10 mg/kg/day of MDMG-935P (n=8), and FAO-related genes relative to Gapdh were assessed by qRT-PCR. q, Male C57BL/6J mice were fed the MASH diet for 12 weeks, then orally administered vehicle or 10 mg/kg/day of MDMG-935P for an additional 12 weeks on the MASH diet prior to end point analyses. Liver samples were collected from mice treated with vehicle (n=7), or 10 mg/kg/day (n=10) of MDMG-935P, stained for F4/80 (red), TREM2 (green), and DAPI (blue) to visualize nuclei, analysed for (r) F4/80+ and TREM2+ cells and expressed as fold change from vehicle. The samples were derived from the same experiment and the blots were processed in parallel for (c, d, e, f). All data are expressed as mean ± SEM. Statistical comparisons were made using one-way ANOVA with Tukey’s multiple comparisons test (a, b, e, f, g), or two-tailed unpaired t-test (i-n, p, r). All individual points and p values are shown. A p value <0.05 was considered statistically significant. Scale bars = 200 μm. Source data

References

    1. Riazi, K. et al. The prevalence and incidence of NAFLD worldwide: a systematic review and meta-analysis. Lancet Gastroenterol. Hepatol.7, 851–861 (2022). - PubMed
    1. Chalasani, N. et al. The diagnosis and management of nonalcoholic fatty liver disease: practice guidance from the American Association for the Study of Liver Diseases. Hepatology67, 328–357 (2018). - PubMed
    1. Friedman, S. L., Neuschwander-Tetri, B. A., Rinella, M. & Sanyal, A. J. Mechanisms of NAFLD development and therapeutic strategies. Nat. Med.24, 908–922 (2018). - PMC - PubMed
    1. Cusi, K. Role of obesity and lipotoxicity in the development of nonalcoholic steatohepatitis: pathophysiology and clinical implications. Gastroenterology142, 711–725 e6 (2012). - PubMed
    1. Softic, S., Cohen, D. E. & Kahn, C. R. Role of dietary fructose and hepatic de novo lipogenesis in fatty liver disease. Dig. Dis. Sci.61, 1282–1293 (2016). - PMC - PubMed

Grants and funding