. 2024 Nov;16(11):2976-3004.
doi: 10.1038/s44321-024-00147-6. Epub 2024 Sep 27.

Mutation in the mitochondrial chaperone TRAP1 leads to autism with more severe symptoms in males

Affiliations

Mutation in the mitochondrial chaperone TRAP1 leads to autism with more severe symptoms in males

Małgorzata Rydzanicz et al. EMBO Mol Med. 2024 Nov.

Abstract

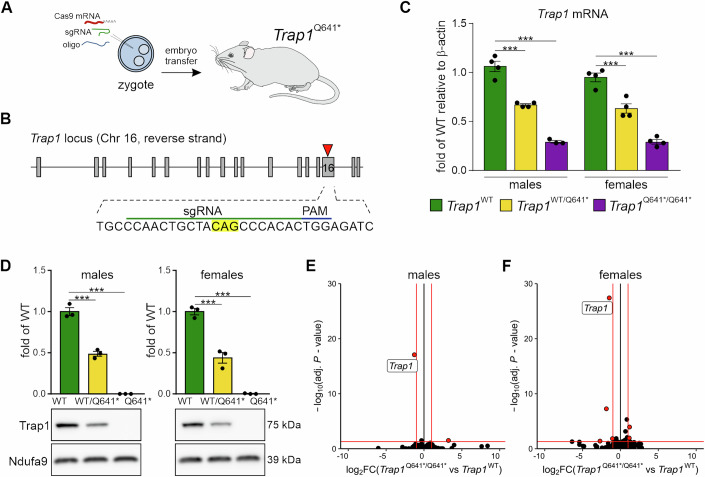
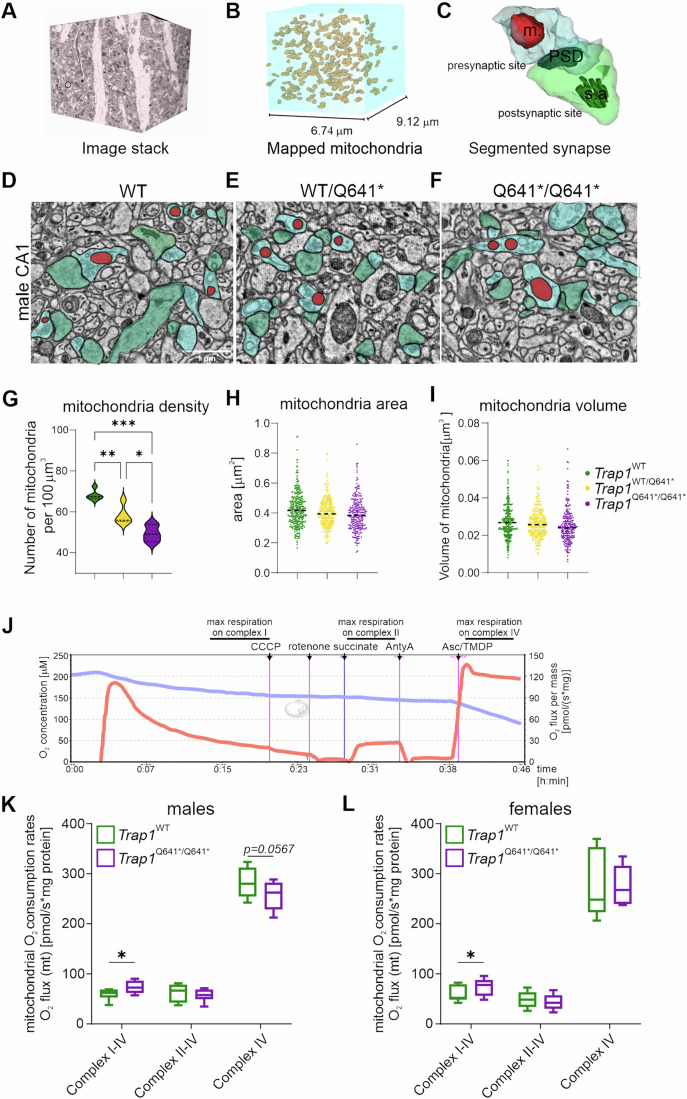
There is increasing evidence of mitochondrial dysfunction in autism spectrum disorders (ASD), but the causal relationships are unclear. In an ASD patient whose identical twin was unaffected, we identified a postzygotic mosaic mutation p.Q639* in the TRAP1 gene, which encodes a mitochondrial chaperone of the HSP90 family. Additional screening of 176 unrelated ASD probands revealed an identical TRAP1 variant in a male patient who had inherited it from a healthy mother. Notably, newly generated knock-in Trap1 p.Q641* mice display ASD-related behavioral abnormalities that are more pronounced in males than in females. Accordingly, Trap1 p.Q641* mutation also resulted in sex-specific changes in synaptic plasticity, the number of presynaptic mitochondria, and mitochondrial respiration. Thus, the TRAP1 p.Q639* mutation is the first example of a monogenic ASD caused by impaired mitochondrial protein homeostasis.

Keywords: Autism; Mitochondria; Mouse Model; Synapses; Trap1.


Conflict of interest statement

Disclosure and competing interests statement The authors declare no competing interests.

Figures

Figure 1
Figure 1. Identification of a TRAP1 p.Q639* variant in ASD-affected individuals.
Pedigree with phenotype and genotype denoted for (A) the examined MZT family and (B) the family of an additional ASD patient bearing the same TRAP1 mutation from the replication cohort; circle denotes female, square denotes male, symbol fill indicates ASD diagnosis. In a case of MZTs, genotype derives from hair follicle DNA samples. (C) Results of the psychological evaluation of the ASD- unaffected twin, patient 1 (ASD-discordant MZT) and patient 2 (from replication cohort) using the Autism Diagnostic Interview—Revisited (ADI-R). (D) Diagram depicting the location of identified p.Q639* variant in the TRAP1 protein. (E) Comparative sequence alignment of the TRAP1 protein in different species shows universal Q639 residue conservation in these species (highlighted).
Figure 2
Figure 2. Generation and transcriptomic analysis of a mouse with the proband Trap1 mutation (p.Q639*) equivalent.
(A) Schematic of the strategy to introduce a knock-in mutation into the Trap1 locus using CRISPR/Cas9. (B) Diagram of sgRNA targeting site in the mouse Trap1 locus. Codon for Q641 is highlighted; PAM   protospacer adjacent motif. (C) Trap1 mRNA levels in the cortex of Trap1WT, Trap1WT/Q641* and Trap1Q641*/Q641* mice as assessed by qPCR. Data are presented as fold change of Trap1WT, relative to β-actin mRNA; n = 3–4 animals/group; ***P < 0.0001, one-way ANOVA, post hoc Sidak’s multiple comparisons test; error bars indicate SEM. (D) Trap1 protein levels in the hippocampus of Trap1WT, Trap1WT/Q641*, and Trap1Q641*/Q641* mice. Ndufa9 as loading control and SDS-PAGE TGX-gel are shown; n = 3 animals/group; ***P < 0.0001, one-way ANOVA, post hoc Sidak’s multiple comparisons test; error bars indicate SEM. (E, F) Volcano plots representing the global differential gene expression in RNA-Seq analysis of the hippocampi of Trap1WT and Trap1Q641*/Q641* for male (E) and female (F) mice (n = 3–4 animals/group). The x-axis indicates log2 fold changes (log2FC) of gene expression levels in Trap1Q641*/Q641* versus Trap1WT mice, and the y-axis indicates –log10 of adjusted P value (adj.P value). P values were calculated with Wald test statistics and were adjusted with the Benjamini–Hochberg method. Black circles represent transcripts not differentially expressed, red circles represent transcripts significantly differentially expressed ( | log2(FC)| >1, adj.P value < 0.05–thresholds designated by red lines on the plot). The topmost differential gene is labeled by gene symbol. See also Appendix Figs. S1 and S2. Source data are available online for this figure.
Figure 3
Figure 3. Trap1 mutation in mice leads to more pronounced social deficits in males.
(A) Schematic of the Eco-HAB apparatus, which consists of four housing compartments linked together with tube-shaped passages, where RFID antennas track mouse location. Food and water are available in two compartments: boxes (B, D). (B, C) Analysis of the locomotor activity of Trap1WT, Trap1WT/Q641*, and Trap1Q641*/Q641* mice of both sexes. No significant differences were observed. (D, E) Histograms show the distribution of “in-cohort sociability” parameters for all pairs of animals in the Trap1WT, Trap1WT/Q641*, and Trap1Q641*/Q641* cohorts in males (D) and females (E). In-cohort sociability measures how much time a pair of familiar animals voluntarily spends together. Data are presented as a relative frequency distribution histogram; n = 7–12 animals/group; ***P < 0.001, **P < 0.01; Kolmogorov–Smirnov test. (F) Scheme of the three-chamber social approach task. (G, H) Results of the social approach task of Trap1WT and Trap1Q641*/Q641* mice of both sexes. Both male and female Trap1WT mice show preference for the social cue (unfamiliar mouse) over non-social cue (*P < 0.05). In contrast, Trap1Q641*/Q641*mice spend the same amount of time exploring social and non-social cues (P > 0.05) and less time exploring the social cue as compared to Trap1WT animals (*P < 0.05). n = 9–12 and 16–18 animals/group for males and females respectively; two-way ANOVA, post hoc uncorrected Fisher’s LSD test; error bars indicate SEM). Source data are available online for this figure.
Figure 4
Figure 4. Altered dendritic spine density, morphology, and excitatory synaptic transmission in Trap1Q641*/Q641* mutant mice.
(A) Representative images of DiI stained dendrites in the CA1 region of the hippocampus in males. Scale bars 2 µm. (B) The mean density of dendritic spines/100 µm of dendrite in the hippocampus in males. (CE) Dendritic spine morphology in the CA1 region of the hippocampus, including spine length (C), spine head width (D), and spine area (E). (F) Representative images of DiI stained dendrites in the CA1 region of the hippocampus in females. Scale bars 2 µm. (G) The mean density of dendritic spines/100 µm of dendrite in the hippocampus in females. (HJ) Dendritic spine morphology in the CA1 region of the hippocampus, including spine length (H), spine head width (I), and spine area (J). (B, G) n = 27–38 (males), n = 21–31 (females) images/group; *P < 0.05, **P < 0.001; one-way ANOVA, post hoc Tukey’s test (CE, HJ) n = 5274–8555 (males), n = 4010–6118 (females) analyzed spines/experimental group; *P < 0.05, **P < 0.001, ***P < 0.0001; nested ANOVA, post hoc Tukey’s test. N = 3–6 animals/group (males), N = 3–4 animal/group (females). (K) Male Trap1Q641*//Q641* mice exhibited significantly enhanced AMPAR-mediated synaptic responses recorded in response to monotonically increasing stimuli compared to WT (*P < 0.05) and Trap1WT/Q641* (***P < 0.001) littermates (Kruskal–Wallis test, Dunn’s Method for multiple pairwise comparisons). (L) Averaged synaptic responses recorded following monotonically increasing stimuli applied to presynaptic fibers. Male Trap1Q641*/Q641* mice exhibited significantly larger NMDARs-mediated synaptic responses compared to WT and Trap1WT/Q641* littermates (Kruskal–Wallis test, Dunn’s Method for multiple pairwise comparisons, **P < 0.001). (M) The average paired-pulse ratio for 25 ms and 50 ms interstimulus intervals was significantly reduced in the male Trap1Q641*/Q641* group compared to both Trap1WT/Q641* and WT littermates (two-way RM ANOVA, Tukeys multiple comparisons test, *P < 0.05, **P < 0.001). (N) Female Trap1WT/Q641* and WT littermates exhibited significantly enhanced AMPAR-mediated synaptic transmission compared to the Trap1Q641*/Q641* group but were not different from each other (Kruskal–Wallis test, Dunn’s Method for multiple pairwise comparisons, **P < 0.001). (O) Averaged synaptic responses recorded in females. Trap1Q641*/Q641* and Trap1WT/Q641* groups had significantly reduced NMDARs-mediated synaptic responses compared to wild-type littermates (Kruskal–Wallis test, Dunn’s Method for multiple pairwise comparison, *P < 0.05). (P) Average paired-pulse ratios were not significantly different in any of the female genotype groups (two-way RM ANOVA, post hoc Tukey’s test, P > 0.05). Males: N = 3–6 animals, n = 12–25 slices; Females: N = 3–4 animals, n = 12–17 slices. (KP) Error bars indicate SEM. Source data are available online for this figure.
Figure 5
Figure 5. Decreased number of presynaptic mitochondria in Trap1Q641*/Q641* and Trap1WT/Q641* male mice.
(A) Representative Serial Block-Face Electron Microscopy (SBF-EM) image stack of stained striatum radiatum in the CA1 region of the hippocampus. (B) Illustration of mapped mitochondria in the image stack following manual segmentation. (C) An example of a segmented synapse with a presynaptic site (blue) with a mitochondrion (m, red), and a postsynaptic site (green) containing postsynaptic density (PSD) and spine apparatus (sa). (DF) Representative electron micrographs of the CA1 region of the hippocampus in Trap1 mice; pre- and postsynaptic sites with mitochondria are depicted as in (C). Scale bar 1 µm. (G) Decreased mitochondria density in Trap1Q641*/Q641* and Trap1WT/Q641* male mice. Plot shows mean density/100 µm3; N = 3–5 animals/group; *P < 0.05, **P < 0.01, ***P < 0.001; one-way ANOVA, post hoc Tukey’s. (H, I) No differences in mitochondria area (H) or volume (I) among tested genotypes. P > 0.05, nested ANOVA; N = 3–5 animals/group; n = 200–300 mitochondria/animal. (JL) High-resolution respirometry of brain mitochondria (isolated from cortex and hippocampus) performed in an O2k Oxygraph. (J) Representative trace of oxygen concentration (blue line) and oxygen consumption (red line) as a function of time. Arrows indicate times of substrates and inhibitors addition. The following respiratory substrates were used: malate, pyruvate, and glutamate for complexes I–IV, succinate for complexes II–IV, and ascorbate and TMPD for complex IV. (K, L) Trap1Q641*/Q641* male and female mitochondria show elevated levels of respiration in the presence of malate and pyruvate (*P < 0.05). Male Trap1Q641*/Q641* mitochondria show also a trend towards decreased respiration in the presence of ascorbate and TMPD (P = 0.0567). Data are presented as a box-and-whiskers graph (the box extends from 25th to 75th percentiles, the central horizontal line is plotted at the median, and whiskers show 5th–95th percentile); n = 6 per genotype/sex, ratio paired two-tailed t test. Source data are available online for this figure.
Figure EV1
Figure EV1. NGS-based deep amplicon sequencing of postzygotic TRAP1 and RUVBL1 variants identified by whole-exome sequencing in a pair of ASD-discordant MZTs and the TRAP1 p.Q639* variant from a replication cohort individual.
(A) Variants TRAP1 p.Q639* and RUVBL1 p.F329L were verified in the ASD-affected twin and his ASD-unaffected twin brother in DNA samples purified from hair follicles (HF) and blood; parental analysis was done on blood samples only. In the ASD-affected twin the VAF of TRAP1 p.Q639* in HF DNA sample was 8% (genomic position coverage 13368×), and in the blood DNA sample, the VAF was 2% (genomic position coverage 27384x). In the unaffected brother HF DNA the variant was not present (genomic position coverage 7779x), while in the blood, the VAF was 2% (genomic position coverage 31972x). In the parent samples, only the wild-type sequence was identified (coverage 26714x for mother and 28222x for father). In the ASD-affected twin, the VAF of RUVBL1 p.F329L in HF DNA was 48% (coverage 54610×) and in the blood sample the VAF was 22% (coverage 49383×). In the unaffected brother’s HF DNA only the wild-type sequence was identified (coverage 52237×), while in blood the VAF was 22% (coverage 40726×). In the parents, only the wild-type sequence was identified (coverage 57498× for mother and 51788× for father). (B) Verification of the heterozygous TRAP1 p.Q639* variant in an ASD patient from the replication cohort revealed inheritance from a ASD-unaffected mother (VAF 50% in both proband and mother); DNA from the proband’s father was not available for testing. Deep amplicon sequencing results were viewed with the Integrative Genomics Viewer (IGV) tool.
Figure EV2
Figure EV2. Transcriptional changes in Trap1Q641*/Q641*, Trap1WT/Q641*and Trap1WT mice.
(AG) Volcano plots representing the global differential gene expression in RNA-Seq analysis of the hippocampi of Trap1WT, Trap1WT/Q641* and Trap1Q641*/Q641* for male and female mice (n = 3–4 animals/group). (AE) The x-axis indicates log2 fold changes (log2FC) of gene expression levels in Trap1WT/Q641* versus Trap1WT mice in males (A) and females (B) or changes in males versus females in Trap1WT (C), Trap1WT/Q641* (D) and Trap1Q641*/Q641* (E). The y-axis indicates –log10 of adjusted P value (adj.P value). P values were calculated with Wald test statistics and were adjusted with Benjamini–Hochberg method. Black circles represent transcripts not differentially expressed, red circles represent transcripts significantly differentially expressed ( | log2(FC)| >1, adj.P value < 0.05–thresholds designated by red lines on the plot). The topmost differential genes are labeled by gene symbols. (F, G) Volcano plots representing the global differential gene expression in RNA-Seq analysis of the hippocampi of Trap1WT and Trap1Q641*/Q641* for male (F) and female (G) mice (n = 3–4 animals/group). The x-axis indicates log2 fold changes (log2FC) of gene expression levels in Trap1Q641*/Q641* versus Trap1WT mice, and the y-axis indicates –log10 of P value (not the adj.P value). Black circles represent transcripts not differentially expressed, gray circles represent genes coding proteins with mitochondrial localization, circles with blue outlines represent transcripts significantly differentially expressed ( | log2(FC)| >0.38, P value < 0.05–thresholds designated by blue lines on the plot). The triangle shapes on the plots are for the outlier transcripts that had values out of the scale presented on the plot and their values were displaced by the maximum/ minimum plotted value (changes applied on both axis). (H) Heatmap representation of expression changes of 103 genes coding proteins with mitochondrial localization on transcript levels from the RNA-Seq analysis. The genes were chosen if were significantly differentially expressed ( | log2(FC)| >0.38, P value < 0.05) in any of the plotted comparisons. The colors represent log2 of fold changes. Green represents genes which expression was lower in Trap1Q641*/Q641* or Trap1WT/Q641* and higher in Trap1WT, whereas violet represents the opposite.
Figure EV3
Figure EV3. Eco-HAB and three-chamber behavioral analysis of Trap1WT, Trap1WT/Q641* and Trap1Q641*/Q641* mice.
(A, B) Eco-HAB behavioral analysis of Trap1WT, Trap1WT/Q641* and Trap1Q641*/Q641* mouse cohorts. (A) Schematic depicting the experimental timeline and data used for analysis of Eco-HAB behavioral measures. Locomotor activity was assessed in 12-h bins and “in-cohort sociability” was calculated from the data collected during the 2nd and 3rd dark phase. (B) Heat maps depicting “in-cohort sociability” results. Each small square represents the “sociability” parameter for one pair of subjects, the color scale used is blue to red, with the blue representing “low sociability” and red “high sociability”. N = 7–12 animals/group. Frequency distribution histograms for all pairs of animals from different cohorts are presented in main Fig. 3D,E. (C, D) Habituation phases of the three-chamber social approach task in Trap1WT and Trap1Q641*/Q641* mice. (C) Scheme showing the first habituation phase—with closed doors (left panel). The graphs show distance traveled by each mouse in the center chamber during 10 min. No differences in the locomotor activity were observed between the genotypes neither in males nor in females (P > 0.05, Mann–Whitney test; error bars indicate SEM). (D) Scheme showing the second habituation phase—with doors opened (left panel). The graphs show time spent by a mouse in each of the chambers during 10 min. Male Trap1Q641*/Q641* mice preferred to spend more time in the already familiar center chamber as compared to the novel side chambers (P < 0.0001, two-way ANOVA, post hoc Tukey’s multiple comparisons test; error bars indicate SEM). N = 9–12 and 16–18 animals/group for males and females respectively.
Figure EV4
Figure EV4. Electrophysiological recordings of compound AMPAR- and NMDAR-mediated fEPSPs in the CA1 hippocampal region of Trap1 mice.
(A) Schematic of the electrophysiological recording setup depicting positions of stimulating (STIM) and recording (REC) electrodes in the CA1 hippocampal region. Top right, example trace of fEPSPs scaling in response to paired stimulation of Schaffer collaterals (interstimulus interval 50 ms). Bottom right, example traces of compound fEPSPs recorded in response to monotonically increasing stimuli applied to Schaeffer collaterals. (B) Quantification of changes in fEPSP amplitude following the application of the AMPAR antagonist DNQX. (20 µM). Sensitivity to DNQX and thus AMPAR/NMDAR ratio was not significantly different among male groups (one-way ANOVA, P > 0.05; error bars indicate SEM). (C) Quantification of changes in fEPSP amplitude following the application of the AMPAR antagonist DNQX. Sensitivity to DNQX was not significantly different among female groups (one-way ANOVA, P > 0.05; error bars indicate SEM). Insets in (B, C) show example recordings of compound fEPSPs before and after DNQX application. N = 3–6 animals, n = 12–25 slices (males); N = 3–4 animals, n = 12–17 slices (females).
Figure EV5
Figure EV5. Functional mitochondrial phenotyping of synaptoneurosomes isolated from mouse brains (cortex and hippocampus) of male and female Trap1 mice.
The electron flow rates in the electron transport chain from 31 different bioenergetic substrates, including glycolysis, TCA cycle intermediates, fatty acids and amino acids, were measured using MitoPlates™. (A) Scheme showing the experimental workflow. (B) Scheme depicting selected substrate supply for mitochondrial respiration. Substrates differentially utilized in Trap1Q641*/Q641* synaptoneurosomes are marked in yellow. (C) In male Trap1Q641*/Q641* mice decreased usage of succinate (***P < 0.001) and fumarate (**P < 0.01) was observed. Also, increased consumption of pyruvate +malate (*P < 0.05) was noticed. (D) In contrast, in females no differences in usage of mitochondrial energy substrates were observed. Results are presented as the average rate/min/μg of protein, +/− SEM (n = 3 per genotype/sex; two‐way ANOVA, post hoc Sidak’s multiple comparisons test).

References

    1. Alonso-Gonzalez A, Calaza M, Amigo J, Gonzalez-Penas J, Martinez-Regueiro R, Fernandez-Prieto M, Parellada M, Arango C, Rodriguez-Fontenla C, Carracedo A (2021) Exploring the biological role of postzygotic and germinal de novo mutations in ASD. Sci Rep 11:319 - PMC - PubMed
    1. Anitha A, Nakamura K, Thanseem I, Yamada K, Iwayama Y, Toyota T, Matsuzaki H, Miyachi T, Yamada S, Tsujii M, Tsuchiya KJ, Matsumoto K, Iwata Y, Suzuki K, Ichikawa H, Sugiyama T, Yoshikawa T, Mori N (2012) Brain region-specific altered expression and association of mitochondria-related genes in autism. Mol Autism 3:12 - PMC - PubMed
    1. Baron-Cohen S, Ring HA, Bullmore ET, Wheelwright S, Ashwin C, Williams SC (2000) The amygdala theory of autism. Neurosci Biobehav Rev 24:355–364 - PubMed
    1. Boles RG, Hornung HA, Moody AE, Ortiz TB, Wong SA, Eggington JM, Stanley CM, Gao M, Zhou H, McLaughlin S, Zare AS, Sheldon KM, Skolnick J, McKernan KJ (2015) Hurt, tired and queasy: Specific variants in the ATPase domain of the TRAP1 mitochondrial chaperone are associated with common, chronic “functional” symptomatology including pain, fatigue and gastrointestinal dysmotility. Mitochondrion 23:64–70 - PMC - PubMed
    1. Chae YC, Angelin A, Lisanti S, Kossenkov AV, Speicher KD, Wang H, Powers JF, Tischler AS, Pacak K, Fliedner S, Michalek RD, Karoly ED, Wallace DC, Languino LR, Speicher DW, Altieri DC (2013) Landscape of the mitochondrial Hsp90 metabolome in tumours. Nat Commun 4:2139 - PMC - PubMed

LinkOut - more resources