. 2024 Sep 27;15(1):8359.
doi: 10.1038/s41467-024-50824-w.

Uridylation regulates mRNA decay directionality in fission yeast

Affiliations

Uridylation regulates mRNA decay directionality in fission yeast

Maciej Grochowski et al. Nat Commun. .

Abstract

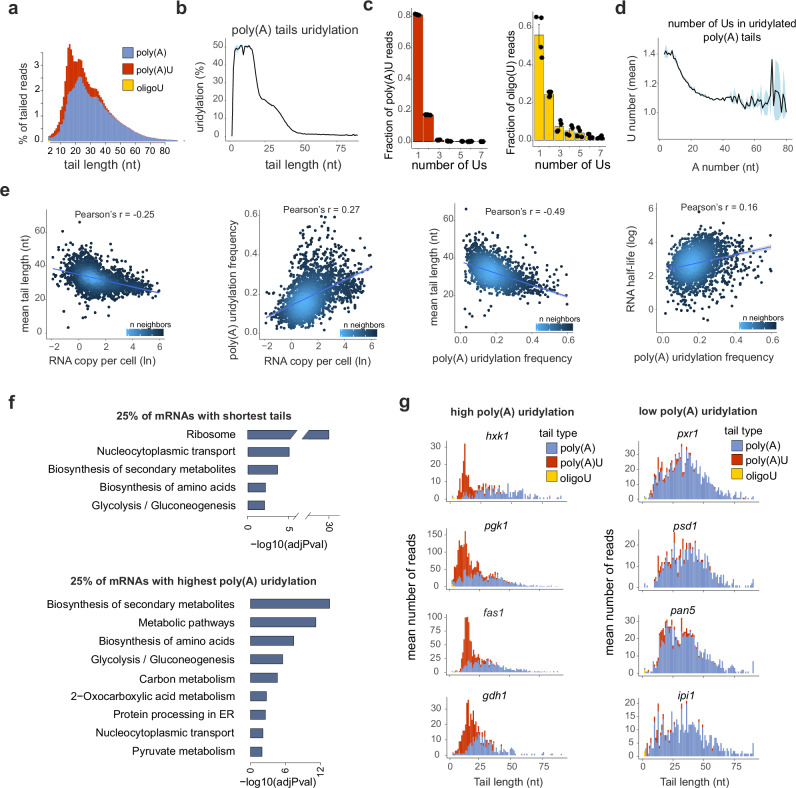
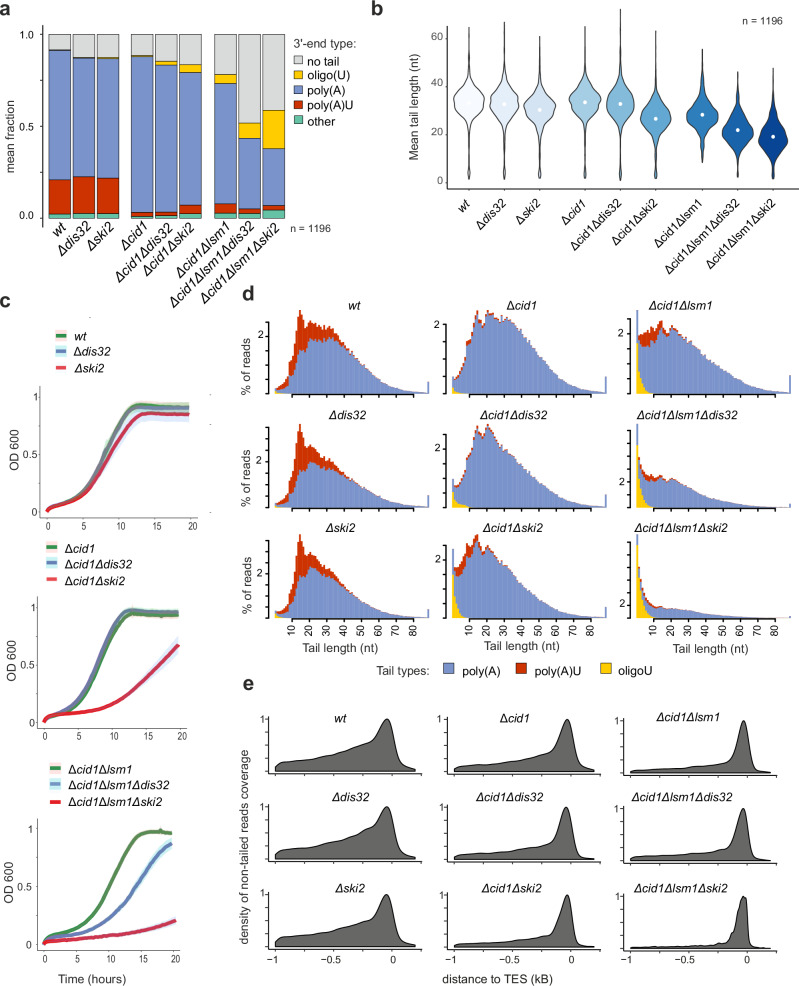
Cytoplasmic mRNA decay is effected by exonucleolytic degradation in either the 5' to 3' or 3' to 5' direction. Pervasive terminal uridylation is implicated in mRNA degradation, however, its functional relevance for bulk mRNA turnover remains poorly understood. In this study, we employ genome-wide 3'-RACE (gw3'-RACE) in the model system fission yeast to elucidate the role of uridylation in mRNA turnover. We observe widespread uridylation of shortened poly(A) tails, promoting efficient 5' to 3' mRNA decay and ensuring timely and controlled mRNA degradation. Inhibition of this uridylation process leads to excessive deadenylation and enhanced 3' to 5' mRNA decay accompanied by oligouridylation. Strikingly we found that uridylation of poly(A) tails and oligouridylation of non-polyadenylated substrates are catalysed by different terminal uridyltransferases Cid1 and Cid16 respectively. Our study sheds new light on the intricate regulatory mechanisms underlying bulk mRNA turnover, demonstrating the role of uridylation in modulating mRNA decay pathways.


Conflict of interest statement

The authors declare no competing interests.

Figures

Fig. 1
Fig. 1. gw3’-RACE provides a comprehensive picture of RNA 3’-ends.
a schematic overview of gw3’-RACE protocol. b an example of read coverage obtained from RNA-seq and gw3’-RACE experiment. c density plot quantifying the varying-length adenosine homopolymers that were spiked into NovaSeq libraries. Expected lengths are indicated with dashed lines. d the architecture of 3’-ends in different RNA classes. Depicted is a mean fraction of each type of 3’-end detected for genes with more than 20 mapped reads and calculated for each class of RNA (average of two repeats). n equals the number of genes passing the read count threshold. e correlation of mean tail length per protein coding genes obtained for two biological repeats. Depicted are genes with more than 20 tailed reads. f correlation of mean tail length per protein-coding gene detected in our data (average of two repeats) with mean tail length detected using the PAL-seq method for fission yeast mRNAs. g distribution of 3’-end positions of different 3’-end types relative to transcription end site (TES).
Fig. 2
Fig. 2. Metabolic and highly expressed genes are extensively uridylated.
a Distribution of lengths of tails mapped to mRNAs (average of two repeats). The amount of tails (y-axis) of a given length (x-axis) is indicated as a percentage in all tailed reads. A stacked bar plot was used to visualise the split of tails of a given length into three categories. The tail length equals the sum of all non-templated nucleotides. Depicted are tails of length of 2nt or more. b the percentage of poly(A) uridylation calculated per tail length for reads mapped to mRNAs. Depicted is the mean of two repeats (data as in a) +/- SD as shaded area. c Barplot depicting the fraction of tails (y-axis) with indicated number of uridines added (x-axis); left panel: Us added to poly(A) tails, right panel: Us in oligo(U) tails. Bars depict mean values +/- SE of four biological replicates. d The mean number of uridines (y-axis) added to adenine tails of different lengths (x-axis). Depicted is the mean of two repeats (data as in a) +/- SD as shaded area. e from left: the relationship between mean mRNA tail length (this study) and mRNA copy per cell (data from). Tail length is an average of two repeats calculated for all genes with at least 20 tailed reads (n = 2611 genes); the relationship between mRNA uridylation frequency and mRNA copy per cell. mRNA uridylation frequency was calculated by dividing the number of poly(A)U reads by all tailed reads mapped to the given gene (average of two repeats); the relationship between mean mRNA tail length and mRNA uridylation frequency; the relationship between mRNA uridylation frequency and mRNA half-life (data from). f KEGG categories enriched in the 25% of genes with mRNAs with shortest tails or 25% of genes with most highly-uridylated mRNAs. Results were obtained using gProfiler; Probability was calculated using Fisher’s one-tailed test and adjusted using Bonferroni correction. g examples of tail length and uridylation distribution for genes with high and low poly(A) tail uridylation frequency. A stacked bar plot was used to visualise the split of tails of a given length in three categories: poly(A), poly(A)U and oligo(U).
Fig. 3
Fig. 3. Cid1 mediated uridylation protects mRNA tails from excessive deadenylation.
a Change in the fraction of reads with poly(A) uridylated tails in TUT-ases deletion strains. Results are presented as a fraction of the given category of reads in all reads. Depicted is the mean value calculated based on two (mutants) or four (wt) independent repeats +/- SD. b Changes of mRNA tails architecture in TUT-ase mutants. For each mutant, a mean fraction of each type of 3’-end detected in mRNA aligned reads is depicted. Common genes with more than 20 mapped reads in all mutants were considered (average of two repeats) (n = 1828). c Change in the fraction of reads with oligouridylated tails (oligo(U)) in different deletion strains. Results are presented in (a). d Distribution of mean mRNA tail lengths per gene detected in different TUT-ase deletion strains (genes with more than 20-tailed reads detected in all tested samples are considered). e Distribution of tail-length of gw3’-RACE derived reads mapped to mRNA in different strains (average of two repeats). Amounts of tails (y-axis) of a given length (x-axis) are indicated as percentage in all tailed reads detected. A stacked bar plot was used to visualise the split of detected tails of a given length into three categories. The tail length equals the number of all non-templated nucleotides (like in Fig. 2a). f For each TUT-ase deletion strain, the change in the percentage of reads with a certain tail length over the wild-type strain was calculated. The average fold change for the two repeats for each tail length is depicted as a line with a standard deviation indicated as a shaded area. g Change in the distribution of 3’-end mapping position relative to the transcription end site (TES) of non-tailed reads detected in different yeast strains. A normalised density plot was used with a maximum value of the y-axis adjusted to 1 in each plot.
Fig. 4
Fig. 4. Uridylated mRNAs accumulate the absence of Lsm1.
a Changes in the composition of mRNA 3’-end architecture in different strains. Data for common genes with more than 10 reads in both repeats for each strain (n = 1335 genes). b Distribution of mean mRNA tail lengths per gene for different strains for common genes with more than 10 reads detected in each sample (n = 1335). c Growth curves of yeast grown in YES media, depicted is an average growth curve for at least four repeats with standard deviation indicated by a shaded area. d colony growth of different strains in complete (YES) or synthetic (EMM) media. Yeast strains were plated in rows in a series of 5-fold dilutions. e Distribution of tail-length of gw3’-RACE derived fragments mapped to mRNA in different strains (average of two repeats). Amounts of tails (y-axis) of a given length (x-axis) are indicated as percentages in all tailed reads detected. A stacked bar plot was used (like in Fig. 2a), and data as in (a). f Distribution of tail-length of fragments mapped to mRNA in different strains as in (e), (average of two repeats). g Change in the distribution of 3’-end mapping positions relative to the transcription end site (TES) of non-tailed reads. Normalised density plot was used with the maximum value of the y-axis adjusted to 1 in each plot; data as in (a). h Relationship between uridylation frequency and transcript fold change in Δlsm1 relative to the wild-type strain. i Change in mRNA uridylation frequency in Δlsm1 strain (y-axis) compared to the wild-type strain (x-axis). j Volcano plot depicting changes of mRNA expression level in Δlsm1 relative to the wild-type strain. Padj was obtained by the Wald test and corrected using the Benjamini and Hochberg method. k KEGG categories significantly enriched among genes up-regulated in the Δlsm1 strain. Enrichment probability was calculated using Fisher’s one-tailed test, and Bonferroni correction was used to obtain adjusted p-values. l Pearson correlation heatmap describing the relationship between proteome or transcriptome changes and uridylation frequency in Δlsm1 strain. The correlation value is indicated as the number and colour of the heatmap square.
Fig. 5
Fig. 5. Compromising poly(A) tail uridylation promotes 3’−5’ mRNA decay.
a Changes in the composition of mRNA 3’-end architecture in different strains. Data for genes with more than 10 reads in both repeats for each strain (n = 1196 genes). b Distribution of mean mRNA tail lengths per gene for different strains for common genes with more than 10 reads detected in each sample (c) Growth curves of different yeast strains. Yeast was grown in YES media, depicted is an average growth curve for at least four repeats with standard deviation indicated by a shaded area. d Distribution of tail-length of gw3’-RACE derived fragments mapped to mRNA in different strains (average of two repeats). Amounts of tails (y-axis) of a given length (x-axis) are indicated as percentages in all tailed reads detected. A stacked bar plot was used to visualise the split of detected tails of a given length into three categories. The tail length equals the number of all non-templated nucleotides (like in Fig. 2a),; data as in (a). e Change in the distribution of 3’-end mapping positions relative to the transcription end site (TES) of non-tailed reads detected in different yeast strains. Normalised density plot was used with the maximum value of the y-axis adjusted to 1 in each plot; data as in (a).
Fig. 6
Fig. 6. Model of bulk mRNA decay in fission yeast.
We propose a model of bulk mRNA decay that takes into account the dual role of uridylation in the process. Under standard conditions, uridylation of mRNA poly(A) tails by Cid1 helps to direct mRNA toward the 5’ to 3’ decay pathway by enhancing Lsm1–7 complex binding and protecting the 3’-end from extensive deadenylation. By providing 3’-end protection, uridylation represses the 3’ to 5’ decay pathways that target predominantly excessively deadenylated transcripts. Deadenylated mRNAs are removed by the exosome complex or can be oligouridylated by Cid16 TUTase which targets their degradation by Dis3l2 U-dependent exonuclease.

Similar articles

References

    1. Pérez-Ortín, J. E., Tordera, V. & Chávez, S. Homeostasis in the Central Dogma of molecular biology: the importance of mRNA instability. RNA Biol.16, 1659–1666 (2019). - PMC - PubMed
    1. Parker, R. RNA Degradation in saccharomyces cerevisae. Genetics191, 671 (2012). - PMC - PubMed
    1. Passmore, L. A. & Coller, J. Roles of mRNA poly(A) tails in regulation of eukaryotic gene expression. Nat. Rev. Mol. Cell Biol.23, 93–106 (2022). - PMC - PubMed
    1. Halbach, F., Reichelt, P., Rode, M. & Conti, E. The yeast ski complex: Crystal structure and rna channeling to the exosome complex. Cell154, 814–826 (2013). - PubMed
    1. Anderson, J. S. J. & Parker, R. The 3’ to 5’ degradation of yeast mRNAs is a general mechanism for mRNA turnover that requires the SKI2 DEVH box protein and 3’ to 5’ exonucleases of the exosome complex. EMBO J.17, 1497–1506 (1998). - PMC - PubMed

Publication types

MeSH terms

Associated data

LinkOut - more resources