. 2024 Sep 27;15(1):8304.
doi: 10.1038/s41467-024-52617-7.

CD38 in SLE CD4 T cells promotes Ca2+ flux and suppresses interleukin-2 production by enhancing the expression of GM2 on the surface membrane

Affiliations

CD38 in SLE CD4 T cells promotes Ca2+ flux and suppresses interleukin-2 production by enhancing the expression of GM2 on the surface membrane

Eri Katsuyama et al. Nat Commun. .

Abstract

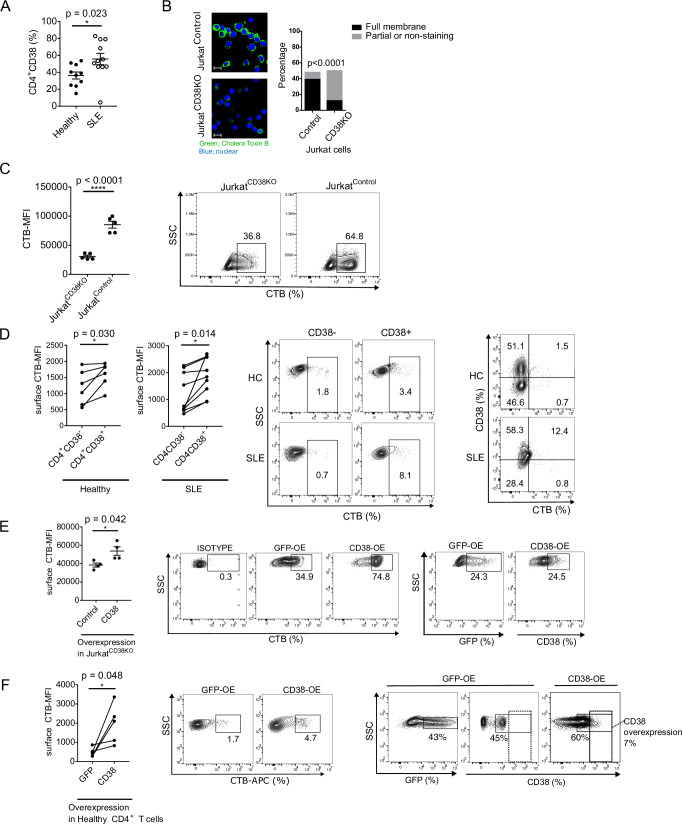
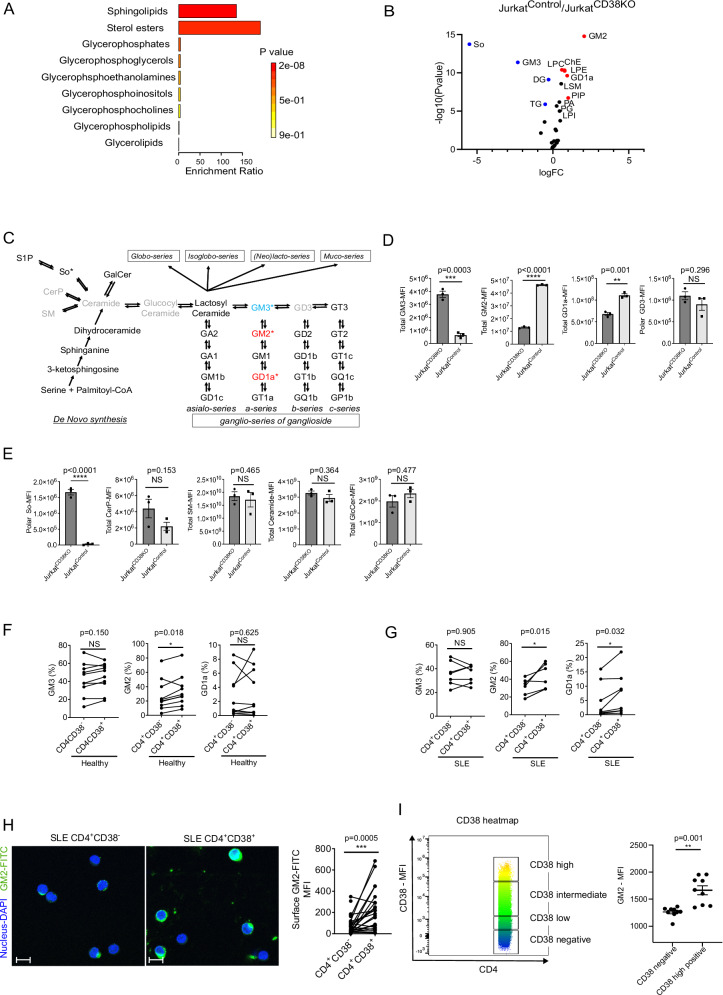
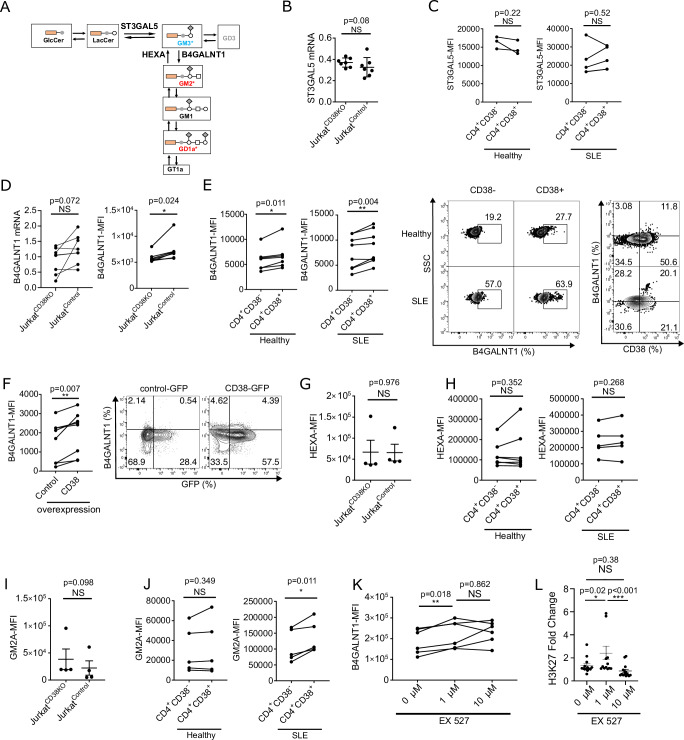
CD38 has emerged as a potential therapeutic target for patients with systemic lupus erythematosus (SLE) but it is not known whether CD38 alters CD4+ T cell function. Using primary human T cells and CD38-sufficient and CD38-deficient Jurkat T cells, we demonstrate that CD38 shifts the T cell lipid profile of gangliosides from GM3 to GM2 by upregulating B4GALNT1 in a Sirtuin 1-dependent manner. Enhanced expression of GM2 causes ER stress by enhancing Ca2+ flux through the PLCγ1-IP3 pathway. Interestingly, correction of the calcium overload by an IP3 receptor inhibitor, but not by a store-operated calcium entry (SOCE) inhibitor, improves IL-2 production by CD4+ T cells in SLE. This study demonstrates that CD38 affects calcium homeostasis in CD4+ T cells by controlling cell membrane lipid composition that results in suppressed IL-2 production. CD38 inhibition with biologics or small drugs should be expected to benefit patients with SLE.


Conflict of interest statement

GCT is on the scientific advisory boards of Cugene, Biolojic, ABPRO, A2 biotherapeutics, COREVITAS. VCK is site PI for clinical trial for BMS, Astra Zeneca and Novartis. VK is advisory board member for Janssen and Aurinia. VK is in the clinical trial adjudication committee member for Cabaletta. ASF currently employed at Abbvie. The remaining authors declare no competing interests.

Figures

Fig. 1
Fig. 1. Increased expression of CD38 on the surface membrane of SLE CD4+ T cells correlates with increased lipid microdomain formation.
A Flow cytometry analysis of CD38 expression (%) in CD4+ T cells derived from healthy participants (n = 10) and patients with SLE (n = 11). B Immunofluorescence analysis of cholera toxin B (CTB) binding in JurkatCD38KO and JurkatControl cells. CTB-FITC is evaluated as surface staining. Green is CTB and Blue is DAPI (left panel), scale bar = 20 μm. The number of cells with full, partial or non-staining with CTB on the cell surface were calculated (right panel, 3 independent experiments). C Flow cytometry analysis of CTB binding on the surface membrane comparing JurkatCD38KO and JurkatControl cells (n = 5, 3 independent experiments, cumulative data (left panel) and a representative plot (right panel)). D Flow cytometry analysis of surface CTB binding comparing CD4+CD38- and CD4+CD38+ derived from healthy participants (n = 6) and patients with SLE (n = 9). Cumulative data (left panel) and representative dot plots (middle and far right panel). E Surface CTB expression was compared between control-vector and CD38 overexpressing-vector in JurkatCD38KO cells (n = 4 biological replicates). Cumulative data (left panel) and representative dot plots of CTB expression after overexpression (middle panel) and representative dot plots of transfection efficacy of GFP-control vector and CD38 overexpression vector (far right panels). F Surface CTB binding was compared between control-vector and CD38 overexpressing-vector in CD4+ T cells from healthy participants (n = 5. Cumulative data, left panel) and representative dot plots of CTB expression after overexpression (middle panel) and representative dot plots of transfection efficacy of GFP-control vector and CD38 overexpression vector (far right panels). Dotted quadrant shows the increased CD38 expression (7%) in transfected compared to GFP-control transfected cells). MFI mean fluorescence intensity. Data analysis using unpaired 2-tailed Student’s t test with Welch’s correction (A), unpaired 2-tailed Student’s t test (B, C, E) or paired 2-tailed Student’s t test (D, F). All data are represented as mean ± SEM. *p < 0.05, ****p < 0.0001. Source data are provided as a Source Data file.
Fig. 2
Fig. 2. CD38 skews lipid raft profile into α-series monosialoganglioside.
A, B Enrichment analysis (A) and volcano plot (B) of lipidomics analysis comparing JurkatCD38KO (n = 3) and JurkatControl (n = 3). The threshold was set as 1.5 for fold change (FC) and 0.05 for p-value in the ratio of JurkatControl/JurkatCD38KO. C Schematics of ceramide and ganglioside synthesis pathway. The ganglioside pathway is composed of the sequential addition of sugars and/or sialic acids. *; statistically significant in the lipidomics data. Red indicates higher expression and blue a lower expression, gray color shows no statistically significant alteration in expression. D Changes in the levels of lipids in the ganglioside series from the lipidomics data comparing JurkatCD38KO and JurkatControl cells (n = 3 independent data points, biological replicates). E Changes in the levels of lipids in the ceramide synthesis from the lipidomics data comparing JurkatCD38KO and JurkatControl cells (n = 3 independent data points, biological replicates). F, G Changes of the lipids in the group of α-series of gangliosides comparing CD4+CD38 and CD4+CD38+ T cells from healthy participants (F, n = 10) and from patients with SLE (G, n = 7). H Fluorescence microscopic analysis of GM2 expression on CD4+ T cells. CD4+CD38 and CD4+CD38+ T cells were sorted by Aria and subsequently stained for GM2 (FITC-green) and DAPI (blue), scale bar = 20 μm. Representative images (left panel). Quantification of GM2 expression as mean fluorescence intensity (25 cells per group from n = 5 biological replicates, right panel). I Flow cytometry-based quantification of GM2 and CD38 in CD4+ cells. The heatmap of CD38 expression gated in CD38 negative, CD38 low-positive, CD38 intermediate-positive and CD38 high-positive based on the expression of CD38 (left panel). Right panel shows GM2 MFI in CD38 negative and CD38 high-positive cells (n = 9 biological replicates). Data analysis using unpaired 2-tailed Student’s t test D, E unpaired 2-tailed Student’s t test with Welch’s correction (I) or paired 2-tailed Student’s t test (FH). All data are represented as mean ± SEM. *p < 0.05, **p < 0.01, ***p < 0.001, ****p < 0.0001. Source data are provided as a Source Data file.
Fig. 3
Fig. 3. B4GALNT1 promotes GM2 dominance in lipid microdomains in CD4+CD38+ cells.
A Schematic depicting the α-series of ganglioside synthesis pathway. B,C Quantitative PCR analysis comparing JurkatCD38KO and JurkatControl (B, n = 7) and Flow cytometry analysis comparing CD4+CD38- and CD4+CD38+ T cells from healthy participants (C, n = 3, left panel) or from patients with SLE (C, n = 5, right panel) of ST3GAL5. D Quantitative PCR analysis (left panel, n = 8) and flow cytometry analysis (right panel, n = 7) of B4GALNT1 expression comparing JurkatCD38KO and JurkatControl cells (n = 7, 3 independent experiments). E Flow cytometry analysis of B4GALNT1 comparing CD4+CD38- and CD4+CD38+ T cells from healthy participants (n = 7, left panel) and from patients with SLE (n = 8, middle panel). Representative dot plots of B4GALNT1 expression and representative dot plots of B4GALNT1 versus CD38 expression in CD4+CD38- and CD4+CD38+ T cells from a healthy participants and a SLE patient (right panels). F Flow cytometry analysis of B4GALNT1 after transfection with a control vector or a CD38-overexpression plasmid in CD4+ cells from healthy participants (n = 8). Cumulative data (left panel) and representative dot plots (right panel). G Flow cytometry analysis of HEXA expression comparing JurkatCD38KO and JurkatControl cells (n = 4, 3 independent experiments). H Flow cytometry analysis of HEXA expression comparing CD4+CD38- and CD4+CD38+ T cells from healthy participants (n = 7) and from patients with SLE (n = 5). I, J Flow cytometry analysis of GM2A expression in JurkatCD38KO and JurkatControl cells (I, n = 4, 3 independent experiments) and in CD4+CD38- and CD4+CD38+ T cells from healthy participants (J, n = 5, left panel) and patients with SLE (J, n = 5, right panel). K Flow cytometry analysis of B4GALNT1 expression. CD4+ T cells from healthy participants were isolated from whole blood and treated with indicated concentrations of the SIRT1 inhibitor (EX527) at 37 °C overnight (n = 5). L ChIP assay analysis of H3K27 (fold change) on B4GALNT1. A ChIP assay was performed in CD4+ T cells isolated from whole blood of healthy participants treated with the indicated concentrations of the SIRT1 inhibitor (EX527) at 37 °C overnight (n = 3), using an H3K27 antibody. Data analysis using unpaired 2-tailed Student’s t test (B, G, I) or paired 2-tailed Student’s t test (CF, H, J) or 1-way ANOVA with Tukey-Kramer test (K, L). All data are represented as mean ± SEM. *p < 0.05, **p < 0.01. Source data are provided as a Source Data file.
Fig. 4
Fig. 4. CD4+CD38+ T cells display enhanced early CD3/TCR signaling response through the CD38-B4GALNT1-GM2 pathway.
A Schematic of calcium signaling in T cells through T cell receptor. B Representative confocal images of CD4+ T cells from healthy participants stained for nucleus (blue), lipid rafts (CTB, green), CD38 (orange) and GM2 (red) acquired at an original magnification of 62X (left panel), scale bar represents 10 μm. Scatter plot of colocalization score of CD38 within and outside of LR in CD4+ T cells of healthy individuals (n = 5, for each 5 patients 5 images analyzed with Imaris). C Representative confocal images of CD4+ T cells from healthy participants stained for nucleus (blue), LAT (green), CD38 (orange), and GM2 (red) acquired at an original magnification of 62X (left panel) scale bar represents 10μm. Scatter dot plots of colocalization scores of CD38 with LAT or LAT alone (middle panel); and GM2 colocalization with LAT in CD4+CD38+ and CD4+CD38- T cells (right panel) of healthy individuals (n = 5, for each 5 patients 5 images analyzed with Imaris). D Flow cytometry analysis of pCD3ζ (healthy n = 5, SLE n = 5), pZAP70 (healthy n = 7, SLE n = 6), pLCK (healthy n = 6, SLE n = 6) and pPLCγ1 (Thr783) (healthy n = 7, SLE n = 7), comparing CD4+CD38- and CD4+CD38+ T cells from healthy participants (top row) and SLE patients (bottom row), with representative dot plots of pPLCγ1 (right panel). Cells were coated with 20 μg/mL of anti-CD3ε mAb (OKT3 clone) in 50 µl of PBS for 30 min on ice. To induce phosphorylation of downstream signaling molecules we added 10 μg of crosslinker (goat-anti-mouse) and incubated the cells for 2 min at 37 °C. E Flow cytometry analysis of pCD3ζ (Healthy n = 5, SLE n = 5). Representative histogram comparing CD4+CD38+ T cells from healthy participants and CD4+CD38+ T and CD4+CD38- T cells from patients with SLE (left panel) and cumulative data (right panel) comparing CD4+CD38+ T cells from healthy participants and CD4+CD38+ T cells from patients with SLE. Cells were coated with 20 μg/mL of anti-CD3ε mAb (OKT3 clone) in 50 µl of PBS for 30 min on ice. To induce phosphorylation of downstream signaling molecules we added 10 μg of crosslinker (goat-anti-mouse) and incubated the cells for 2 min at 37 °C. Data analysis using unpaired 2-tailed Student’s t test with Welch’s correction (B, C), paired 2-tailed Student’s t test (D) or unpaired 2-tailed Student’s t test (E). All data are represented as mean ± SEM. *p < 0.05, **p < 0.01, ****p < 0.0001. Source data are provided as a Source Data file.
Fig. 5
Fig. 5. Increased calcium entry in CD4+CD38+ cells through CRAC channels.
A Schematics of calcium signaling in T cells. B Intracellular calcium kinetics comparing CD4+CD38- and CD4+CD38+ T cells from healthy participants (n = 3, summary figure in left panel). CD4+ T cells loaded with Fluo-4 were stimulated with anti-CD3 and a cross-linker in calcium-sufficient RPMI medium. PMA and ionomycin were added as a positive control. Quantification of peak MFI of Fluo-4 after anti-CD3 stimulation (n = 5, cumulative data in right panel). C Same experimental conditions as (B) comparing CD4+CD38+ T cells from healthy participants and patients with SLE. Intracellular calcium kinetics (n = 3, summary figure in left panel). Quantification of peak MFI of Fluo-4 after anti-CD3 stimulation (cumulative data in the right panel, n = 4). D Same experimental conditions as (B) comparing CD4+CD38- T cells from healthy participants and from patients with SLE. Intracellular calcium kinetics (n = 3, summary figure in left panel). Quantification of peak MFI of Fluo-4 after anti-CD3 stimulation (cumulative data in the right panel, n = 6). E Thapsigargin-induced intracellular calcium kinetics comparing CD4+CD38- and CD4+CD38+ T cells from healthy participants (Representative figure in left panel) and quantification of peak MFI of Fluo-4 after 1 mM Ca2+ addition (Summary scatter plot in right panel, n = 3). CD4+ T cells loaded with Fluo-4 were stimulated with 1 μM of thapsigargin in HBSS to induce passive Ca2+ release from ER (ER-Ca2+). F Calcium kinetics focusing on ER-Ca2+ presented in Figure E. Representative figure (left panel) and quantification of peak MFI of Fluo-4 after 1 μM of thapsigargin addition (Cumulative data in the right panel, n = 8). CD4+ T cells loaded with Fluo-4 were stimulated with anti-CD3 in HBSS to measure release of ER-Ca2+. G Anti-CD3-induced intracellular calcium kinetics comparing CD4+CD38- and CD4+CD38+ T cells from healthy participants (Representative figure in left panel) and quantification of peak MFI of Fluo-4 after 1 mM Ca2+ addition (Summary scatter plot in the right panel, n = 4 biological replicates). CD4+ T cells loaded with Fluo-4 were stimulated with anti-CD3 in HBSS to release of ER-Ca2+ which is induced by TCR-IP3 pathway. Data analysis using unpaired 2-tailed Student’s t test (C, D) or paired 2-tailed Student’s t test (B, EG). All data are represented as mean ± SEM. *p < 0.05, **p < 0.01. Source data are provided as a Source Data file.
Fig. 6
Fig. 6. Calcium flux in CD4+CD38+ T cells leads to ER stress in T cells.
A Scatter plot of flow cytometry analysis of IL-2 comparing CD4+CD38- and CD4+CD38+ T cells from patients with SLE (n = 10, left panel) and from healthy participants (n = 6, middle panel) and representative dot plot of IL-2 production in healthy participants and SLE patients in CD38- and CD38+ in CD4+T cells (right panel). CD4+ T cells were stimulated with PMA/Ionomycin for 6 h with brefeldin and intracellular staining for IL-2 was performed. B Cumulative data (left panel) and representative plots (right panel) of flow cytometry analysis of IL-2 positive CD4+CD38+ T cells from patients with SLE (n = 3) and from healthy participants (n = 4). CD4+ T cells were stimulated with PMA/Ionomycin for 6 h with brefeldin and intracellular staining for IL-2 was performed. C Cumulative data of flow cytometry analysis of IL-2 production in total CD4+ T cells comparing healthy participants (n = 6) and patients with SLE (n = 5). Cells were stimulated with PMA/Ionomycin for 5 h and intracellular staining for IL-2 was performed. D Pathway analysis of RNA-seq data comparing JurkatControl and JurkatCD38KO cells (n = 3 from each group). Bar graphs represent GO Cellular Component 2018 pathway that was upregulated in JurkatControl compared to JurkatCD38KO cells with adjusted p values < 0.05 and Fold Change > 1.5 (2-sided tests). E Gene set enrichment plot of the genes upregulated in response to ER stress calculated by GSEA (gene set from GO:1990440 was used). F Flow cytometry analysis of IRE1 comparing CD4+CD38- and CD4+CD38+ T cells from healthy participants (n = 6, left panel) and from patients with SLE (n = 6, right panel). G Flow cytometry analysis of spliced XBP1 comparing CD4+CD38- and CD4+CD38+ T cells from healthy participants (n = 5, left panel) and from patients with SLE (n = 5, middle panel) and representative dot plot (right panel). H Representative electron microscope images of ER morphology in CD4+CD38- and CD4+CD38+ T cells from patients with SLE and healthy participants. The arrow points to a normal strand of ER in a CD4+CD38- cell of a patient with SLE and the star marks point to dilated strands of ER in the cytoplasm and adjacent to the nuclear membrane (inset) in a CD4+ CD38+ cell from another patient with SLE. Cells from healthy individuals (low panels) show no ER changes. 3 independent experiments were performed. Scale bars, 500 nm. Data analysis using unpaired 2-tailed Student’s t test with Welch’s correction (B, C) or paired 2-tailed Student’s t test (A, F, G). All data are represented as mean ± SEM. *p < 0.05, **p < 0.01, ***p < 0.001. Source data are provided as a Source Data file.
Fig. 7
Fig. 7. Inhibition of proximal calcium flux restores IL-2 production in CD4+CD38+ cells.
A Scatter plot of flow cytometry analysis of spliced XBP1 in CD4+ T cells treated with 2-APB (IP3 receptor inhibitor) in indicated concentration following overnight incubation (n = 5 biological replicates). B SOCE activity of CD4+ T cells treated with 2-APB (left panel) or with YM-58483 (SOCE inhibitor) (right panel). CD4+ T cells loaded with Fluo-4 were stimulated with anti-CD3 in HBSS to release ER-Ca2+ and subsequently added 1 mM Ca2+ to activate SOCE. Peak MFI of Fluo-4 after 1 mM Ca2+addition is shown (scatter plot of n = 6 biological replicates in each experiment). C Flow cytometry analysis of IL-2 in CD4+ T cells from healthy participants (left panel) or patients with SLE (right panel) treated with 2-APB overnight at indicated concentration. Cells were stimulated with PMA/Ionomycin for 5 h (n = 6 in healthy participants and n = 5 in patients with SLE, Paired T-test). D Same experimental condition as (C) except for the treatment was done with YM-58483, not with 2-APB (n = 6 in healthy participants and n = 5 in patients with SLE). Data analysis using paired 2-tailed Student’s t test (A, B, D) and 1-way ANOVA with Tukey-Kramer test (C). All data are represented as mean ± SEM. *p < 0.05, **p < 0.01; ***p < 0.001, ****p < 0.0001. Source data are provided as a Source Data file.

References

    1. Tsokos, G. C. Systemic lupus erythematosus. N. Engl. J. Med365, 2110–2121 (2011). - PubMed
    1. Tsokos, G. C. Autoimmunity and organ damage in systemic lupus erythematosus. Nat. Immunol.21, 605–614 (2020). - PMC - PubMed
    1. Alcocer-Varela, J., Alarcon-Riquelme, M., Laffon, A., Sanchez-Madrid, F. & Alarcon-Segovia, D. Activation markers on peripheral blood T cells from patients with active or inactive systemic lupus erythematosus. Correlation with proliferative responses and production of IL-2. J. Autoimmun.4, 935–945 (1991). - PubMed
    1. Cole, S. et al. Integrative analysis reveals CD38 as a therapeutic target for plasma cell-rich pre-disease and established rheumatoid arthritis and systemic lupus erythematosus. Arthritis Res Ther.20, 85 (2018). - PMC - PubMed
    1. Erkeller-Yuksel, F. M., Lydyard, P. M. & Isenberg, D. A. Lack of NK cells in lupus patients with renal involvement. Lupus6, 708–712 (1997). - PubMed

Publication types

MeSH terms

Associated data