. 2024 Sep 27;15(1):8279.
doi: 10.1038/s41467-024-52580-3.

Decoding Missense Variants by Incorporating Phase Separation via Machine Learning

Affiliations

Decoding Missense Variants by Incorporating Phase Separation via Machine Learning

Mofan Feng et al. Nat Commun. .

Abstract

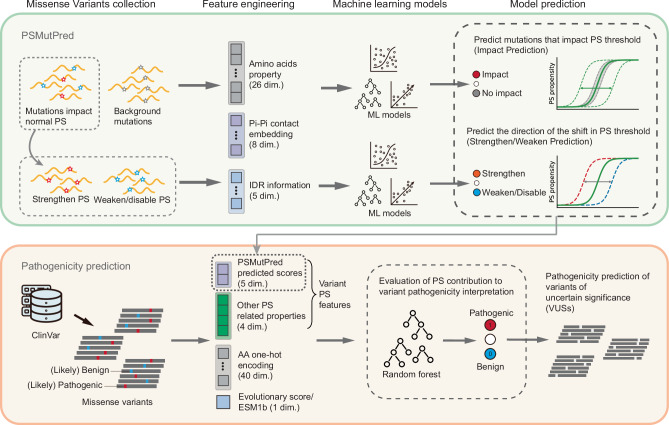
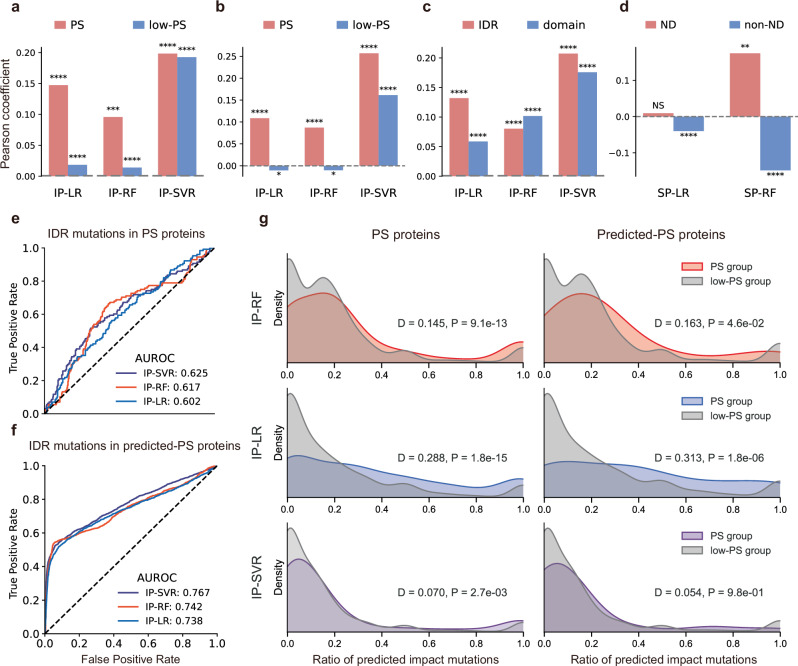
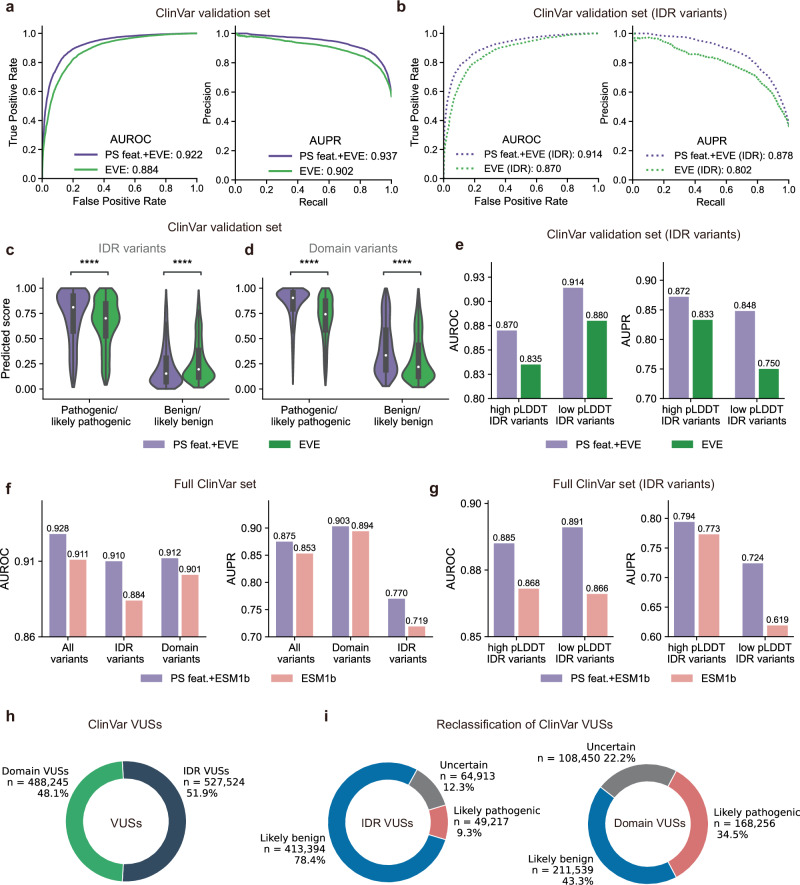
Computational models have made significant progress in predicting the effect of protein variants. However, deciphering numerous variants of uncertain significance (VUS) located within intrinsically disordered regions (IDRs) remains challenging. To address this issue, we introduce phase separation, which is tightly linked to IDRs, into the investigation of missense variants. Phase separation is vital for multiple physiological processes. By leveraging missense variants that alter phase separation propensity, we develop a machine learning approach named PSMutPred to predict the impact of missense mutations on phase separation. PSMutPred demonstrates robust performance in predicting missense variants that affect natural phase separation. In vitro experiments further underscore its validity. By applying PSMutPred on over 522,000 ClinVar missense variants, it significantly contributes to decoding the pathogenesis of disease variants, especially those in IDRs. Our work provides insights into the understanding of a vast number of VUSs in IDRs, expediting clinical interpretation and diagnosis.


Conflict of interest statement

The authors declare no competing interests.

Figures

Fig. 1
Fig. 1. Overview of the study.
The upper green panel illustrates PSMutPred, a machine learning approach designed to predict the effect of missense mutations on natural phase separation. Each mutation is converted into a feature vector and distinct models were employed for two main tasks: Identifying mutations that impact PS (termed ‘Impact Prediction’) and determining whether a mutation strengthens or weakens the PS threshold (labeled as ‘Strengthen/Weaken Prediction’). Additionally, PS features, including the output from PSMutPred, were evaluated for their utility in predicting the pathogenicity of missense variants (lower orange panel). dim. dimension.
Fig. 2
Fig. 2. Analyses of mutations that impact phase separation (PS).
a Comparison of the PS propensity of proteins corresponding to collected mutations (70 proteins) with that of the human proteome. (PScore, Left; PhaSePred-SaPS, Right; ****P < 0.0001, two-sided Mann–Whitney U test, p = 4.6e-11 and 3.3e-14, respectively; the boxplot components within each violin, from top to bottom are maxima, upper quartile, median, lower quartile, and minima.). b The proportion of ‘Impact’ mutations (Left) located in IDRs and Domains, compared with the total proportion of IDRs and Domains (Right). c The top 30 high-frequency mutations among collected ‘Impact’ mutations. d Distribution of amino acid (AA) distances from each mutation site to the nearest domain boundary. Distances of ‘Impact’ mutations and random ‘Background’ positions were compared within Domains (Left) and within IDRs (Right) (The number of data points were 139, 1000, 202, and 1000, respectively; ****P < 0.0001, two-sided Mann–Whitney U test, p = 4.4e-40 and 1.4e-30, respectively; the boxplot components within each violin plot from top to bottom are maxima, upper quartile, median, lower quartile, and minima). e Distribution of eight pi-contact prediction values (PPVs) for mutation sites. Values of ‘Impact’ mutations (in red) and ‘Background’ mutations (in gray) were compared. The dot in each violin represents the average of values. (NS not significant, **P < 0.01, ****P < 0.0001, two-sample Kolmogorov–Smirnov test; P-values are 0.0029, 0.140, 5.9e-11, 1.2e-7, 0.106, 3.3e-8, 4.5e-6, and 4.1e-14, respectively). f Statistical comparison of the changes of AA property index before and after mutation between collected ‘Strengthen’ (n = 79, orange) and ‘Weaken/Disable’ groups (n = 228, blue) under two-sample Kolmogorov–Smirnov D test (WT wild-type AA, MT mutant AA). The direction of the D statistic was set as positive when the mean value of the ‘Strengthen’ group was higher and as negative when that of the ‘Weaken’ group was higher. Source data are provided as a Source Data file.
Fig. 3
Fig. 3. Evaluation of methods’ performance on predicting missense mutations that impact natural phase separation (PS) (‘Impact’ mutation).
Methods with abbreviations include DeePha (DeePhase), FuzDro (FuzDrop), and catGRA (catGRANULE). a Discriminative power evaluation of representative PS prediction methods for ‘Impact’ mutations against random ‘Background’ mutations, comparing absolute score changes pre- and post-mutation (P-values computed by a two-sided Mann–Whitney U test, left for ‘Impact’ mutations, n = 307 and right for ‘Background’ mutations n = 35,000; the boxplot components within each violin plot, from top to bottom are maxima, upper quartile, median, lower quartile, and minima.). b Performance evaluation of representative PS prediction methods on discerning ‘Impact’ mutations against random ‘Background’ mutations (IP task). AUROC is based on the absolute score changes. ch Model performance evaluation in identifying ‘Impact’ mutations. For LOSO, 50 replicates of subset sampling from the background dataset were used to evaluate performance, and the average AUROC and the area under the curve of the precision-recall curve (PRC) (AUPR) were computed and visualized. For LOSO AUPR, data are presented as mean values ± SD (Standard Deviation), and the scatter points represent the distribution of background dataset sampling repeats. c, d Model performance in identifying ‘Impact’ mutations evaluated using leave-one-source-out (LOSO, Left) and an independent test set (Right), measured by AUROC (c) and AUPR (d). e, f A parallel evaluation similar to (c and d) but the ‘Background’ mutations were generated following the same IDRs: Domains ratio as the collected ‘Impact’ samples (weighted sampling). (g, h) A parallel evaluation similar to (c, d) but the ‘Background’ mutations were generated by aligning the frequency of different mutations with their frequency in the impact dataset (AA weighted sampling). We assigned weights to each type of mutation based on the number of occurrences in the impact dataset, with a minimum weight of 1 to ensure all mutation types are considered. Source data are provided as a Source Data file.
Fig. 4
Fig. 4. Experimental validation of Eps8 missense mutations predicted by PSMutPred to impact PS.
a Representative images of overexpressed GFP-Eps8 and its mutants in HEK293 cells (scale bars: 10 μm; n = 10 randomly picked cells). WT denotes wild type. b Quantification of puncta within the wild type and mutants of Eps8 in HEK293 cells (n = 10 randomly picked cells; ****P < 0.0001 by two-tailed Student’s t test, p = 8.1e-9 and 4.0e-10, respectively). Error bars represent SD, and center lines represent mean values. c Ribbon diagram representation of mouse EPS8 structure predicted by AlphaFold2, showing both front (left) and back (right) views. df Detailed regions involving missense mutations with their neighboring residues (d, f), and interaction analysis (e). The mutations are shown with the stick mode in red while hydrogen bonds are shown as blue dashed lines. Sequence alignments within critical residues are shown in bold. Source data are provided as a Source Data file.
Fig. 5
Fig. 5. Evaluation of PSMutPred scores across ClinVar variants.
ad Comparison of variants’ Pearson correlation between groups. Groups include a PS-prone group (83 known PS proteins, 1451 variants) and a low-PS-prone group (8528 proteins, 84,840 variants) defined by PS proteins, and a predicted PS-prone group (1276 proteins, 30,889 variants) and a predicted low-PS-prone group (7335 proteins, 56,853 variants). (two-tailed P-values computed by sci-kit learn pearsonr package; *P < 0.05; **P < 0.01; ***P < 0.001; ****P < 0.0001; NS = no significance). a Comparison between the PS-prone group and the low-PS-prone group. P-values are 1.7e-8, 5.8e-8, 2.6e-4, 3.4e-5, 2.4e-14, and 1.2e-275 respectively. b Comparison between the predicted PS-prone group and the predicted low-PS-prone group. P-values are 9.9e-82, 0.01, 4.9e-53, 0.02, 3.6e-198, and 7.7e-223 respectively. c Comparison between variants located in IDRs (n = 15,427) and Domains (n = 15,462) within the predicted PS-prone group. P-values are 6.4e-61, 2.8e-13, 1.7e-23, 6.0e-37, 1.5e-149, and 1.4e-107 respectively. d Comparison between variants from neurodegenerative disease (ND) related proteins (19 proteins, n = 252) and variants from other proteins (non-ND) (within the predicted PS-prone group). P-values are 0.88, 3.1e-8, 0.005, and 2.6e-95 respectively. e AUROC scores of PSMutPred-IP models on pathogenicity prediction of IDR missense variants from the PS-prone group (n = 489 variants). f A parallel evaluation of (e) but focuses on the predicted PS-prone group (n = 8188). g Comparison of the proportion values defined by different PSMutPred-IP models, including IP-RF (top), IP-LR (middle), and IP-SVR (bottom). Comparison of the PS-prone group and the low-PS-prone group on the left (PS proteins), and comparison between the predicted PS-prone group and the predicted low-PS-prone group (Predicted-PS proteins). Differences are based on 2-sample Kolmogorov’s D statistic, with positive values indicating higher proportions in the PS-prone group and negative values indicating higher proportions in another. Source data are provided as a Source Data file.
Fig. 6
Fig. 6. Analysis of phase separation-related feature contributions to pathogenicity prediction.
ae Pathogenicity prediction performance evaluation of the model combining EVE with PS-related features. a AUROC (Left) and AUPR (Right) evaluations on the independent test set (n = 15,394). The purple line represents the model trained with both EVE and PS features; the green line represents the EVE score alone. b AUROC (Left) and AUPR (Right) evaluations specifically on variants within IDRs from the data set analyzed in (a) (n = 5656). c, d The divergence of predicted scores distributions between the standalone EVE (green) and the combined model (purple), quantified using a two-sided Mann–Whitney U test on the independent test set (****P < 0.0001; P-values are 2.4e-27; 1.7e-15, 9.6e-59; and 7.2e-293 respectively, the boxplot components within each violin plot, from top to bottom are maxima, upper quartile, median, lower quartile, and minima.). c Score distributions for pathogenic-prone variants (pathogenic and likely pathogenic, n = 2044, left graph) and benign-prone variants (benign and likely benign, n = 3612, right graph) with a focus on variants located in IDRs. d A parallel evaluation of (c) but focusing on variants located in Domains (6665 pathogenic or likely pathogenic and 3073 benign or likely benign). e Evaluation of IDRs variants with high AlphaFold2 pLDDT scores (pLDDT ≥ 70, n = 2763) and low pLDDT scores (pLDDT < 50, n = 2407). fi Pathogenicity prediction performance evaluation of the model combining ESM1b with PS-related features. f Evaluation of the model trained with ESM1b and PS features using 5-fold cross-validation under the ClinVar dataset (n = 140,321). g Evaluation of IDRs variants with high AlphaFold2 pLDDT scores (pLDDT ≥ 70, n = 36,032) and low pLDDT scores (pLDDT < 50, n = 25,755). h, i Pathogenicity prediction for 1,015,769 ClinVar VUSs by combining PS features with ESM1b scores. Source data are provided as a Source Data file.

Similar articles

Cited by

References

    1. Vacic, V. & Iakoucheva, L. M. Disease mutations in disordered regions–exception to the rule? Mol. Biosyst.8, 27–32 (2012). - PMC - PubMed
    1. Colak, R. et al. Distinct types of disorder in the human proteome: functional implications for alternative splicing. PLoS Comput. Biol.9, e1003030 (2013). - PMC - PubMed
    1. Jumper, J. et al. Highly accurate protein structure prediction with AlphaFold. Nature596, 583–589 (2021). - PMC - PubMed
    1. Alderson, T. R., Pritisanac, I., Kolaric, D., Moses, A. M. & Forman-Kay, J. D. Systematic identification of conditionally folded intrinsically disordered regions by AlphaFold2. Proc. Natl Acad. Sci. USA120, e2304302120 (2023). - PMC - PubMed
    1. Alberti, S. Phase separation in biology. Curr. Biol.27, R1097–R1102 (2017). - PubMed

Publication types

MeSH terms

Substances

LinkOut - more resources