. 2024 Sep 27;15(1):8379.
doi: 10.1038/s41467-024-52351-0.

Scar matrix drives Piezo1 mediated stromal inflammation leading to placenta accreta spectrum

Affiliations

Scar matrix drives Piezo1 mediated stromal inflammation leading to placenta accreta spectrum

Du Wenqiang et al. Nat Commun. .

Abstract

Scar tissue formation is a hallmark of wound repair in adults and can chronically affect tissue architecture and function. To understand the general phenomena, we sought to explore scar-driven imbalance in tissue homeostasis caused by a common, and standardized surgical procedure, the uterine scar due to cesarean surgery. Deep uterine scar is associated with a rapidly increasing condition in pregnant women, placenta accreta spectrum (PAS), characterized by aggressive trophoblast invasion into the uterus, frequently necessitating hysterectomy at parturition. We created a model of uterine scar, recapitulating PAS-like invasive phenotype, showing that scar matrix activates mechanosensitive ion channel, Piezo1, through glycolysis-fueled cellular contraction. Piezo1 activation increases intracellular calcium activity and Protein kinase C activation, leading to NF-κB nuclear translocation, and MafG stabilization. This inflammatory transformation of decidua leads to production of IL-8 and G-CSF, chemotactically recruiting invading trophoblasts towards scar, initiating PAS. Our study demonstrates aberrant mechanics of scar disturbs stroma-epithelia homeostasis in placentation, with implications in cancer dissemination.


Conflict of interest statement

The authors declare no competing interests.

Figures

Fig. 1
Fig. 1. In vitro model of PAS recapitulates the abnormally deep trophoblastic invasion.
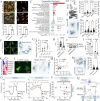
A Schematic showing abnormally deep invasion of extravillous trophoblasts (EVTs) in the decidual stroma proximal to scar. SCT: syncytiotrophoblast, CT: cytotrophoblast, dF: decidual fibroblast, Scar-dF: transformed dFs proximal to scar, Physio-dF: normal dFs distal to scar, V: placental villi, M: myometrium. B H&E and immunohistochemistry images of maternal-fetal interface tissue sections from PAS patients showing HLA-G+ EVT (green), and Vimentin labeled dFs (red); nuclei marked with DAPI (blue). n = 6 biological replicates. C Picrosirius red staining of tissue sections from regions proximal, and distal to pre-existent scar, with orientation distribution of collagen fibers from different PAS patients quantified in (D). n = 3 biological replicates. E Surface topography of Scar matrix imaged by atomic force microscopy (AFM) in PBS; F Photo and spatial rigidity characterization of normal endometrial tissue; Graph (bottom) shows mean rigidity of endometrial tissue, Physio, and Scar matrices. n = 8, 25, and 8 biologically independent experiments. p = 3 × 10−42. G Schematic showing workflow to establish in vitro Scar induced PAS model with distinct invasion assays. H, I Phase contrast image showing in-situ HTR8 spheroid invasion into ESFs decidualized on Physio; Graphs showing line integral convolution representation of HTR8 invasion into ESFs decidualized on Physio, or Scar matrices. I Normalized HTR8 invasion area (S/S0) as a function of invasion time. n = 10 biological replicates. J Fluorescent images of HTR8 (red) invasion into ESFs pre-decidualized on Physio, or Scar at time 0, and 24 h; Graph showing aerial invasion normalized to initial interface length; n = 8 interfaces; p = 0.005. K Apotome scanning of HTR8 spatial nuclear locations relative to dESF monolayers 72 h after invasion; L Quantification of individual HTR8 distance to dESF monolayer; n = 255 cells; p = 6 × 10−79. M Volcano plot showing differentially expressed genes in dESFs on Scar and Physio. N Ingenuity Pathway Analysis based prediction of activated transcription factors in dESFs on Scar and Physio; n = 3 biological replicates. Data in all bar graphs are showing as mean ± s.d.; statistical significance is determined by unpaired two-tailed t-test (**p < 0.01, ****p < 0.0001, and ns not significant). Source data are provided as a Source Data file. A, G created with BioRender.com released under a Creative Commons Attribution-NonCommercial-NoDerivs 4.0 International license (https://creativecommons.org/licenses/by-nc-nd/4.0/deed.en).
Fig. 2
Fig. 2. Scar transforms decidual fibroblasts into NF-κB mediated inflammatory state.
A Representative immunohistochemistry images of maternal-fetal interface (MFI) tissue sections from PAS patients showing EVTs present in decidual regions proximal, and distal to collagenous acellular scar regions; Quantification of EVT density in either region in right panel; n = 5 and 3 for regions proximal and distal to scar respectively; EVTs and dESFs are marked with HLA-G (red; arrow heads) and Vimentin (green), respectively. p = 0.005. B KEGG pathway enrichment analysis showing signaling pathways differentially enriched in dESFs on Scar and Physio; C Gene ontologies related to inflammation enriched in dESFs on Scar and Physio. D Representative immunofluorescence images showing RelA (p65) location in dESFs on Physio and Scar; Quantification showing percentage of dESF with nuclear RelA in lower panel. n = 4 and 5 fields of view for Physio and Scar, respectively. p = 5 × 10⁻⁸. E Immunoblot showing abundance of phosphorylated RelA (p-RelA) in dESFs on Physio and Scar. Experiments are repeated twice with similar results. F ANSIA based analysis of stromal invasion of primary EVTs into dESF compartment with scrambled, or gene silenced for NFKB1; n = 10 and 13 locations for scrambled and NFKB1KD, respectively. p = 0.005. G Representative immunohistochemistry images of MFI tissue sections from PAS patient showing RelA intracellular localization in decidual regions proximal, and distal to scar; H Quantification of percentage of decidual fibroblasts with nuclear RelA; n = 3 and 6 locations for distal and proximal, respectively. p = 0.0005. I Pearson correlation test shows Pearson coefficient (r) of EVT number per field of view, and ratio of decidual fibroblasts with nuclear and cytoplasmic RelA and total decidual fibroblasts in PAS MFI tissue sections; a two-tailed p-value for Pearson’s r is calculated; n = 8 field of views. Data in figures A, D, F, H are showing as mean ± s.d.; statistical significance is determined by unpaired two-tailed t-test (**p < 0.01, ***p < 0.001). Source data are provided as a Source Data file.
Fig. 3
Fig. 3. IL-8/G-CSF secreted by Scar transformed decidual fibroblasts chemotactically recruit EVTs.
A Heatmap showing significant differential ligand encoding genes expressed in dESFs on Scar and Physio matrices. B Representative IL-8 immunofluorescence images of dESFs treated with protein transport inhibitor GolgiStop for 6 h on Physio and Scar matrices, quantification shown in right panel; n = 49 and 53 cells for Physio and Scar, respectively. p = 5 × 10⁻¹¹. C, D ELISA based analysis of IL-8 and G-CSF concentration in supernatant of dESFs on Physio and Scar in 3D and 2D; n = 3 samples. p = 0.0007 in (C) and p = 0.04 and 2 × 10⁻⁵ in (D). E ELISA based measurement of IL-8 concentration in supernatant of dESFs treated overnight with DMSO, or 100 ng/ml TNFα; n = 3 samples. p = 0.0097. F Experimental workflow to test migration of HTR8 in medium conditioned from dESFs with gene silenced for IL-8 and G-CSF encoding genes, CXCL8 and CSF3, respectively. G Migration trajectories (initial location (x, y = 0,0)) of HTR8 conditioned with medium from dESFs silenced for CXCL8 and CSF3 genes, without or with addition of recombinant human (rh) IL-8 and G-CSF; Quantification of averaged velocities over 24 h shown in (H); p = 1×10⁻⁸, 8×10⁻⁷, 8×10⁻⁹, and 6 × 10⁻⁵; n listed below each condition. I 3D chemotaxis of primary EVTs in collagen gel towards IL-8 and G-CSF gradient; Shown is a representative image of EVTs in collagen gel (left); Trajectories of individually tracked EVTs from their initial location (0,0) (middle and right); Cell trajectory with mean displacement towards cytokine end are labeled red, and counted (n); p value showing Rayleigh test of cell trajectories: p < 0.05 is considered chemotaxis. J ANSIA-based stromal invasion analysis of HTR8 in monolayer of dESFs silenced for CXCL8 and CSF3 genes; Control refers to scrambled sgRNA. p = 0.003 and 0.005. Data in figures B–E, H and J are showing as mean ± s.d.; statistical significance is determined by unpaired two-tailed t-test (*p < 0.05, **p < 0.01, ***p < 0.001, and ****p < 0.0001). Source data are provided as a Source Data file. Figure 3F created with BioRender.com released under a Creative Commons Attribution-NonCommercial-NoDerivs 4.0 International license (https://creativecommons.org/licenses/by-nc-nd/4.0/deed.en).
Fig. 4
Fig. 4. Piezo1 dependent decidual mechanoregulation drives IL-8/G-CSF production.
A Immunohistochemistry images of RelA expression in decidual fibroblasts from PAS patient; Quantification showing distance from scar for dESFs classified according to RelA localization; n = 104 and 253 cells. p = 0.002. B Heatmap showing tpm values of genes encoding mechanosensitive ion channels in dESFs on Physio or Scar; n = 3 biological replicates. C ANSIA analysis of primary EVTs spheroids invasion into scrambled and PIEZO1KD dESFs; n = 10 and 13 spheroids. p = 0.0099. The scrambled control is shared with Fig. 2F since these conditions are studied in the same round of experiment. D Schematic showing HTR8 spheroids invasion into wildtype and gene edited dESFs embedded in Matrigel plugs in mouse. E Invasion area of EVT spheroids in Matrigel plugs containing scrambled and PIEZO1KD dESFs. n = 21 and 15 spheroids. p = 0.004. F Snapshot and calcium transients of dESFs transduced with GCamP6f on Physio and Scar. G Ca2+ peak/basal ratio and transient events (H) in dESFs on Physio and Scar. and n = 44 and 92 cells (G); n = 9 and 25 cells (H) p = 0.03 (G) and 0.002 (H). I Images of dESFs loaded with Fluo4-AM treated with DMSO or Yoda1; Graph showing Ca2+ peak/basal levels. n = 20 cells. J Ca2+ dynamics in scrambled and PIEZO1KD dESFs. n = 48 and 32 cells. K Immunoblots showing abundance of RelA, and phosphorylated RelA in dESFs treated with GsMTx-4, or Yoda1, and in PIEZO1KD dESFs. n = 2 biologically independent experiments. L ELISA measurement of IL-8 and G-CSF concentration in supernatant of dESFs treated with Yoda1 or GsMTx-4. n = 3 biological replicates. p = 4 × 10⁻⁶, 0.0005, 0.005, and 0.0009. M Concentration of IL-8 and G-CSF in supernatant of scrambled and PIEZO1KD dESFs. n = 3 biological replicates. p = 0.003 and 0.004. N Immunohistochemistry images and graph showing Piezo1 expression in decidual fibroblasts with cytoplasmic or nuclear RelA localization in PAS patients. n = 42 and 66. p = 2 × 10⁻⁷. Data in all bar graphs are showing as mean ± s.d.; statistical significance are determined by unpaired two-tailed t-test (*p < 0.05, **p < 0.01, ***p < 0.001, and ****p < 0.0001). Source data are provided as a Source Data file. Figure 4D created with BioRender.com released under a Creative Commons Attribution-NonCommercial-NoDerivs 4.0 International license (https://creativecommons.org/licenses/by-nc-nd/4.0/deed.en).
Fig. 5
Fig. 5. Scar activates Piezo1 through glycolysis fueled actomyosin contraction.
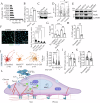
A Immunohistochemistry images of Yap localization in decidual sections proximal, or distal to scar from PAS patients; n = 3 sections; p = 0.005. B Immunofluorescence and graph showing Yap localization in dESFs on Physio and Scar; n = 3 biological replicates. p = 2 × 10⁻⁷. C RNAseq-based enrichment analysis of contractility ontologies in dESFs. D F-actin staining in dESFs on Physio, and Scar (left), n = 61 cells for each condition; p = 6 × 10⁻⁵. Graph showing length and intensity of F-actin bundles (right), n = 21 and 17 cells. p = 9 × 10⁻¹¹. E Traction force map of dESFs on Physio and Scar (left). Quantification of strain energy and energy density for each cell (right); n = 50 and 82 cells; p = 0.005 and 0.01. F Time-lapse images showing Ca2+ dynamics in three individual dESFs: C1, C2, and C3; heatmap showing corresponding traction force of each cell; G Correlation analysis of energy density with Ca2+ events frequency. r: Pearson correlation coefficient; n = 27 cells. H Ca2+ events and abundance of phosphorylated RelA (I) in dESFs treated with DMSO or Blebbistatin; n = 60 and 59 cells; p = 2 × 10⁻⁶. J Concentration of IL-8 and G-CSF in supernatant of dESFs treated DMSO or Blebbistatin by ELISA; n = 3 biological samples; p = 0.002 and 0.01. K Heatmap showing gene expression of PFKs and PFKFBs in dESFs. L Images of two dESF cells showing 2-NBDG uptake (left) and their co-measured traction force maps (right). n = 50 biological replicates. M Pearson correlation analysis of cellular energy density and mean 2-NBDG intensity in dESFs; n = 50 cells. N Traction force maps and strain energy of dESFs maintained in glucose and pyruvate withmatching C molarity; n = 164 and 94 cells; p = 0.006. O Energetics profiling of oxygen consumption rate (OCR), and extracellular acidification rate (ECAR) in dESFs at basal levels, coupled (oligomycin sensitive), and uncoupled (FCCP sensitive) respiration. n = 3 biological replicates. P dESFs on Scar show significant increase in glycolysis. n = 3 biological replicates; p = 0.03. Q Schematic showing Scar promoted cellular contractility is fueled by increased glycolysis. Data in bar graphs are showing as mean ± s.d.; statistical significance is determined by unpaired two-tailed t-test (*p < 0.05, **p < 0.01, and ****p < 0.0001; ns not significant). Source data are provided as a Source Data file. Q created with BioRender.com released under a Creative Commons Attribution-NonCommercial-NoDerivs 4.0 International license (https://creativecommons.org/licenses/by-nc-nd/4.0/deed.en).
Fig. 6
Fig. 6. Piezo1-mediated inflammatory transformation of dESFs depends on Protein kinase C (PKC) activation.
A Kinase enrichment analysis (KEA3) predicted top activated kinases in Scar vs Physio dESFs using Fisher’s Exact Tests (pval) on RNAseq data. B Substrate immunoblot of PKC activated targets in ESFs decidualized on Physio and Scar matrices, as well as (C) in dESFs on Scar treated with 4 µM GsMTx-4 and 2 µM PKC inhibitor Gö6983 for 4 h. D Immunoblot showing abundance of phosphorylated RelA (p65) in dESFs on Scar without, and after overnight treatment with 2 µM Gö6983, as well as (E) 10 nM PKC activator Phorbol 12-myristate 13-acetate (PMA), 5 µM Piezo1 activator Yoda1, and 3 µM Yoda1 plus 5 µM Gö6983; GAPDH is loading control in D, E. Experiments are one of the two biological replicates with similar results. F ELISA based measurement of IL-8 and G-CSF concentrations in supernatant of dESFs on Scar after overnight treatment with 2 µM Gö6983 and 10 nM PMA; n = 3 replicates; p = 0.01, 0.0003, 0.001, and 0.003. G ELISA-based measurement of IL-8 and G-CSF concentrations in supernatant of dESFs on Scar after treatment with 3 µM Yoda1, and 3 µM Yoda1 plus 5 µM Gö6983; n = 3 replicates; p = 0.02, 0.002, 9 × 10⁻⁶, and 8 × 10⁻⁶. Data in F and G are showing as mean ± s.d.; statistical significance is determined by unpaired two-tailed t-test (*p < 0.05, **p < 0.01, ***p < 0.001, and ****p < 0.0001; ns not significant). Source data are provided as a Source Data file.
Fig. 7
Fig. 7. MafG stabilization by Piezo1 mediates transcription of trophoblast recruiting cytokines.
A Prediction of upstream transcription factors on Scar vs Physio dESFs. B TPM values of MAFG on Physio and Scar; n = 3 replicates; p = 0.03. C Immunoblot showing MafG abundance in dESFs on Physio and Scar matrices. D MAFG scRNAseq expression levels in adherent and non-adherent PAS decidua, and in normal decidua (GEO accession number: GSE212505). n = 1836, 1595, and 1246 cells. p = 0.04 and 0.001. E Immunoblot showing abundance of MafG and Nrf2 in dESFs on Scar treated with GsMTx4, Yoda1, and Yoda1 plus Gö6983 for 1 h. n = 2 biological replicates. F Representative immunofluorescence image of dESFs treated with DMSO, or SCH772984; Graph showing quantification of MafG levels in dESFs treated with SCH772984 (SCH) (right). n = 599, 323, 384, and 331 cells for each condition; p = 4 × 10−298, 0, and 4 × 10−140. G IL-8 levels in supernatants from scrambled and MAFGKD dESFs treated with Yoda1 by ELISA; n = 3 replicates; p = 0.03, 0.002, and 0.004. H G-CSF levels in supernatants from scrambled and MAFGKD dESFs; n = 3 replicates; p = 40.003. I Migration trajectories and mean velocities of HTR8 conditioned with medium from scrambled and MAFGKD dESFs, without, or with addition of 300 ng/mL rh G-CSF. p = 1 × 10⁻⁶ and 0.03. J ANSIA-based analysis of primary EVTs invasion into scrambled and MAFGKD dESFs, without, or with addition of 300 ng/mL rh G-CSF; n = 10 spheroids for each condition; p = 0.03. The scrambled control is shared with Fig. 2F and Fig. 4C since these independent conditions are studied in the same round of experiment. K Invasion area of EVT spheroids in Matrigel plugs containing scrambled and MAFGKD dESFs. n = 16 and 21 spheroids, respectively. p = 0.0096. The scrambled control is shared with Fig. 4E since these conditions are studied in the same round of mouse injection. L Schematic showing the plausible mechanism driving inflammatory transformation of decidual fibroblasts and EVT recruitment proximal to existent uterine scar. Data in all bar graphs are shown as mean ± s.d.; Statistical significance is determined by unpaired two-tailed t-test (*p < 0.05, **p < 0.01, and ****p < 0.0001; ns not significant). Source data are provided as a Source Data file. L created with BioRender.com released under a Creative Commons Attribution-NonCommercial-NoDerivs 4.0 International license (https://creativecommons.org/licenses/by-nc-nd/4.0/deed.en).

References

    1. Gurtner, G. C., Werner, S., Barrandon, Y. & Longaker, M. T. Wound repair and regeneration. Nature453, 314–321 (2008). - PubMed
    1. Rodrigues, M., Kosaric, N., Bonham, C. A. & Gurtner, G. C. Wound healing: a cellular perspective. Physiol. Rev.99, 665–706 (2019). - PMC - PubMed
    1. Xue, M. & Jackson, C. J. Extracellular matrix reorganization during wound healing and its impact on abnormal scarring. Adv. Wound Care4, 119–136 (2015). - PMC - PubMed
    1. Moretti, L., Stalfort, J., Barker, T. H. & Abebayehu, D. The interplay of fibroblasts, the extracellular matrix, and inflammation in scar formation. J. Biol. Chem.298, 101530 (2022). - PMC - PubMed
    1. Eming, S. A., Martin, P. & Tomic-Canic, M. Wound repair and regeneration: mechanisms, signaling, and translation. Sci. Transl. Med.6, 265sr6–265sr6 (2014). - PMC - PubMed

Publication types

MeSH terms

Associated data

LinkOut - more resources