. 2024 Sep 27;15(1):8386.
doi: 10.1038/s41467-024-52427-x.

Towards geospatially-resolved public-health surveillance via wastewater sequencing

Affiliations

Towards geospatially-resolved public-health surveillance via wastewater sequencing

Braden T Tierney et al. Nat Commun. .

Abstract

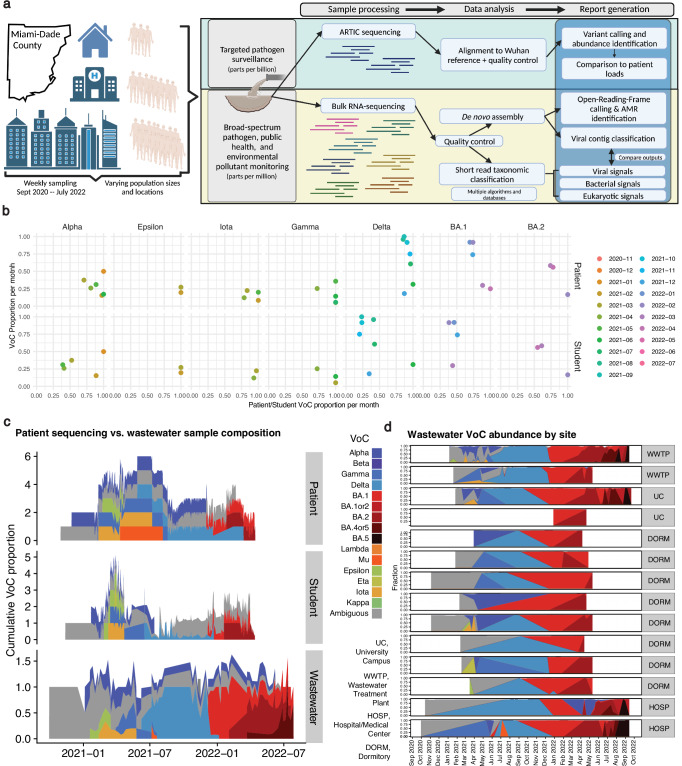
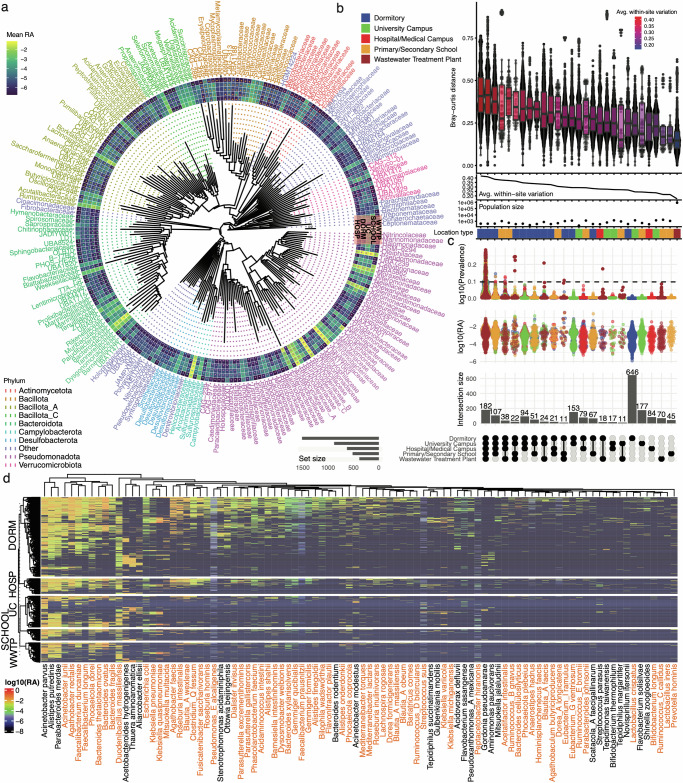
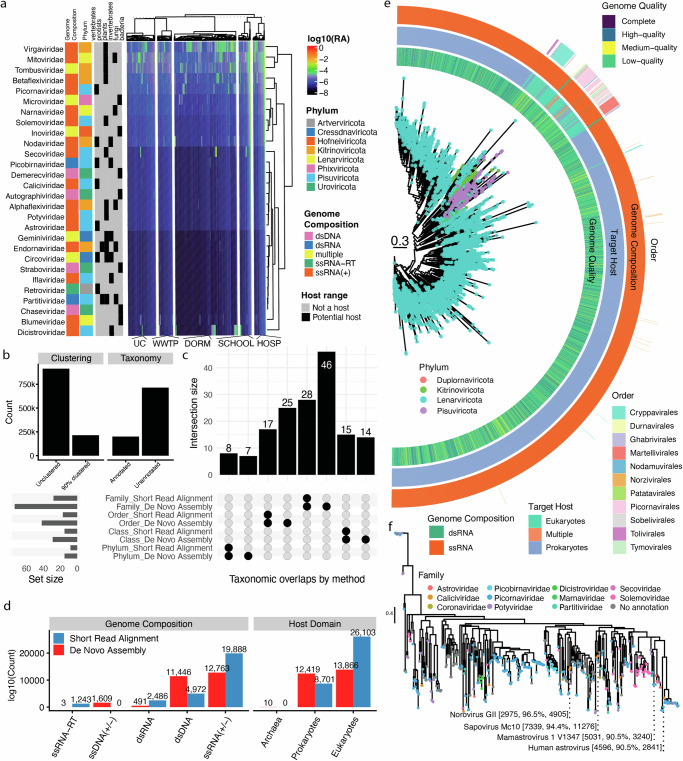
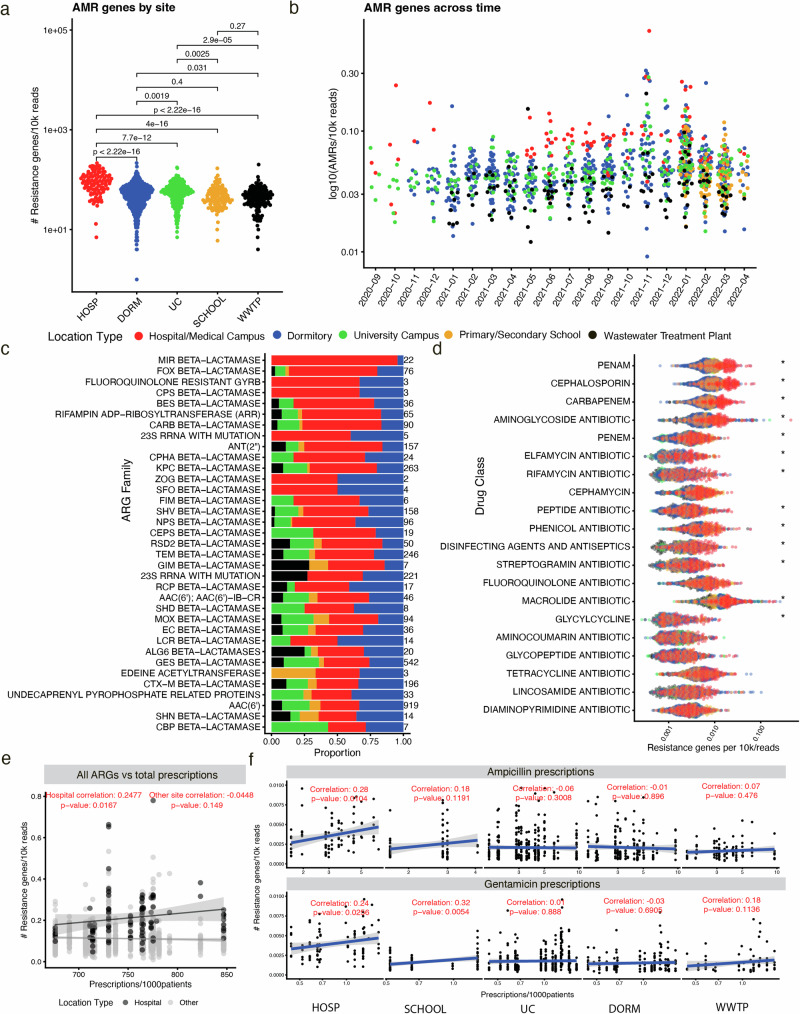
Wastewater is a geospatially- and temporally-linked microbial fingerprint of a given population, making it a potentially valuable tool for tracking public health across locales and time. Here, we integrate targeted and bulk RNA sequencing (N = 2238 samples) to track the viral, bacterial, and functional content over geospatially distinct areas within Miami Dade County, USA, from 2020-2022. We used targeted amplicon sequencing to track diverse SARS-CoV-2 variants across space and time, and we found a tight correspondence with positive PCR tests from University students and Miami-Dade hospital patients. Additionally, in bulk metatranscriptomic data, we demonstrate that the bacterial content of different wastewater sampling locations serving small population sizes can be used to detect putative, host-derived microorganisms that themselves have known associations with human health and diet. We also detect multiple enteric pathogens (e.g., Norovirus) and characterize viral diversity across sites. Moreover, we observed an enrichment of antimicrobial resistance genes (ARGs) in hospital wastewater; antibiotic-specific ARGs correlated to total prescriptions of those same antibiotics (e.g Ampicillin, Gentamicin). Overall, this effort lays the groundwork for systematic characterization of wastewater that can potentially influence public health decision-making.


Conflict of interest statement

B.T.T. is compensated for consulting with Seed Health on microbiome study design. C.E.M. is a co-founder of Onegevity and Biotia. No entity listed here was involved in funding or advising the contents of this study. G.M.C. lists competing interests at arep.med.harvard.edu/tech.html. The remaining authors declare no competing interests.

Figures

Fig. 1
Fig. 1. Overview of approach and targeted sequencing of SARS-CoV-2.
a Samples were taken at (on average) weekly intervals between 2020 and 2022 from 34 sites within Miami-Dade County. Samples were sequenced with targeted ARTIC sequencing to measure SARS-CoV-2 abundance and bulk RNA sequencing to ascertain the broader microbial community. A variety of algorithms and analytic approaches were employed to identify and compare the taxonomic and functional profiles of each site across time and space, with the end result being a systematically characterized dataset with comparisons to clinical data to provide information relevant to public health surveillance showing the evolution of variants over space and time. b The monthly VoC proportions across datasets. Point color corresponds to the month. X-axis is the proportion of samples annotated as a given VoC for patient or student samples (derived from individual tests). Y-axis is the average variant abundance in targeted wastewater sequencing. c An additional, density-plot-based, view of all variants in wastewater vs patient/student cohorts over time. Colors correspond to different variants as defined in the legend between (c) and (d); this legend is relevant to both panels. d The variation in wastewater VoCs across time in different sampling sites. Source data are provided as a Source Data file. a created with BioRender.com released under a CC-BY-NC-ND 4.0 International license.
Fig. 2
Fig. 2. Tracking Variants of Concern (VOCs) across time.
For every wastewater sample, fragments deriving from SARS-CoV-2 were analyzed for mutations corresponding to COVID variants of concern (VOC), and the Variant Allele Frequency (VAF) was estimated per mutation per sample. Unique mutations refer to point mutations that are unique to a given VOC, while recurrent mutations are present in more than one VOC. The annotation track on top reflects which VOC corresponds to which mutation (columns). This annotation track has unique colors in each line, and the colors are present only to assist in delineating between each subsequent row. Each cell in the dated rows represents the VAF for a given mutation for a given sample at a given time point, with dark red reflecting all RNA fragments having a given mutation, lighter red reflecting a mixture of presence and absence for a mutation, blue representing the presence of the wild type (i.e. not deriving from a given VOC), and gray representing no coverage of that genomic context in the sequence data. Source data are provided as a Source Data file.
Fig. 3
Fig. 3. Wastewater bacterial phylogenetics and diversity.
a The average relative abundance (RA) of all bacterial families represented in the metatranscriptomic data. Outer rings correspond to mean abundance within a family across the different location types extending from the WWTP wastewater treatment plant (outermost ring) to SCHOOL primary/secondary school, UC university campus, DORM dormitory, and HOSP hospital, (innermost ring). The color of the family name corresponds to its phylum. b The top panel is the beta diversity (Bray Curtis distance) between all samples within a given site. Each point in this panel represents a comparison between two different samples taken from the same location (e.g., two random samples from a given hospital). The line underneath the top panel corresponds to the average beta diversity at each associated site. The dots in the Population Size sub-panel correspond to the approximate population served by the site from which samples are being compared between. The colored blocks on the bottom are vertically aligned with the population size points and the beta diversity dotplots, and colors correspond to the different sampling location types indicated in the legend. Boxplots represent the median (center line), the 25th (lower bound of the box), and 75th (upper bound of the box) percentiles. The whiskers extend to the smallest and largest values within 1.5 times the interquartile range (IQR) from the lower and upper quartiles, respectively. c The intersections between different location types, with the bars indicating the intersection size and the black dots indicating the sites underneath being compared. These bars are vertically aligned with the middle and top panels, which show the relative abundance and prevalence, respectively, of all bacterial species represented by each bar. d The log10 RA of bacteria potentially associated with any location type in our Microbial Association Study (MAS). Bacteria occurring in at least three samples and with a BY-adjusted p-value of less than 0.1 are plotted. Orange names indicate gut commensals. Source data are provided as a Source Data file.
Fig. 4
Fig. 4. Wastewater viral phylogenetics and diversity through assembly vs. short-read alignment.
a The relative abundance (RA) of top viral families. Heatmap values are log10(RA) of a given viral family as estimated by short-read alignment. Annotation bars on the left-hand side correspond to the International Committee on Taxonomy of Viruses (ICTV) proposed genome composition, geNomad phylum, and ICTV host range for a given geNomad family-level annotation. Alignments were done to a database of 9 public databases comprising 6 million+ dereplicated, taxonomically annotated, and quality-controlled viral genomes (see “Methods” section). Columns and rows are hierarchically clustered. HOSP hospital, DORM dormitory, SCHOOL primary/secondary school, WWTP wastewater treatment plant, UC university campus. b Left side: The number of putative viral contigs detected by CheckV compared to the number remaining when clustered at 90% nucleic acid identity. Right side: The number of contigs with and without geNomad taxonomic annotations. c The overlap between taxa identified by de novo assembly vs. short-read alignment at different ranks. d The different genome compositions and target host information identified by de novo assembly and short-read alignment. e A maximum likelihood phylogeny of RNA viruses present in our de novo assembled data. Scale bar is indicated on the plot. f A second maximum likelihood phylogeny of RNA viruses present in de novo assembled data annotated as the family Pisuviricota. Species-level annotations derive from BLASTing viruses against the complete RefSeq viral genomes at the 90% identity level. The numbers following the species names indicate the genome length, percent identity to the named reference species, and the bitscore of the alignment. Source data are provided as a Source Data file.
Fig. 5
Fig. 5. The antimicrobial resistance landscape of wastewater across time and space.
a The total number of called Antimicrobial Resistance Genes (ARGs) across different sample types per 10 thousand reads, with p-values deriving from t-tests on log10 transformed ARG counts normalized by sequencing depth. HOSP hospital, DORM dormitory, SCHOOL primary/secondary school, WWTP wastewater treatment plant, UC university campus. b The total ARGs identified across time. c The top 25 most prevalent ARGs in hospital wastewater. Color scheme relates to the legend above. d The top specific ARGs for different drug classes across all sample types. Asterisks correspond to if a given ARG was enriched (in terms of log10 observations per 10k reads) in hospital wastewater when compared to all other sites according to the adjusted p-value on a t-test. P-values were adjusted by the Benjamini–Yekutieli procedure. For an asterisk to be present, an antibiotic class must have been enriched in all four comparisons (e.g., hospitals vs dormitories, hospitals vs the university campus, hospitals vs primary schools, and hospitals vs the wastewater treatment plant). e The Pearson correlation between the sum total of all sampled hospital antibiotic prescriptions and the total ARG counts per 10k for hospitals (black) and (all other sites). This color scheme only applies to this panel. Data are presented as a linear regression line (mean values) surrounded by 95% confidence intervals (area shaded in gray). f The same as (e), except the only genes considered in the correlation are those annotated as conferring resistance for the two antibiotics listed. The antibiotic data, similarly, is only for prescriptions of those two antibiotics. Data are presented as a linear regression line (mean values) surrounded by 95% confidence intervals (area shaded in gray). Source data are provided as a Source Data file, and all p-values reported stem from two-sided tests.

Update of

Similar articles

Cited by

References

    1. Ejeian, F. et al. Biosensors for wastewater monitoring: a review. Biosens. Bioelectron.118, 66–79 (2018). - PubMed
    1. Korajkic, A. et al. Viral and bacterial fecal indicators in untreated wastewater across the contiguous United States exhibit geospatial trends. Appl. Environ. Microbiol. 86, e02967–19 (2020). - PMC - PubMed
    1. O’Brien, J. W. et al. A National Wastewater Monitoring Program for a better understanding of public health: a case study using the Australian Census. Environ. Int.122, 400–411 (2019). - PubMed
    1. Leong, L. Y., Rigby, M. & Sakaji, R. H. Evaluation of the California wastewater reclamation criteria using enteric virus monitoring. Data26, 7–8 (1992).
    1. Akpor, O. B. & Muchie, B. Environmental and public health implications of wastewater quality. Afr. J. Biotechnol.10, 2379–2387 (2011).

Publication types

Associated data