. 2024 Sep 27;14(1):389.
doi: 10.1038/s41398-024-03097-2.

Magnitude and kinetics of a set of neuroanatomic volume and thickness together with white matter hyperintensity is definitive of cognitive status and brain age

Affiliations

Magnitude and kinetics of a set of neuroanatomic volume and thickness together with white matter hyperintensity is definitive of cognitive status and brain age

Neha Yadav et al. Transl Psychiatry. .

Abstract

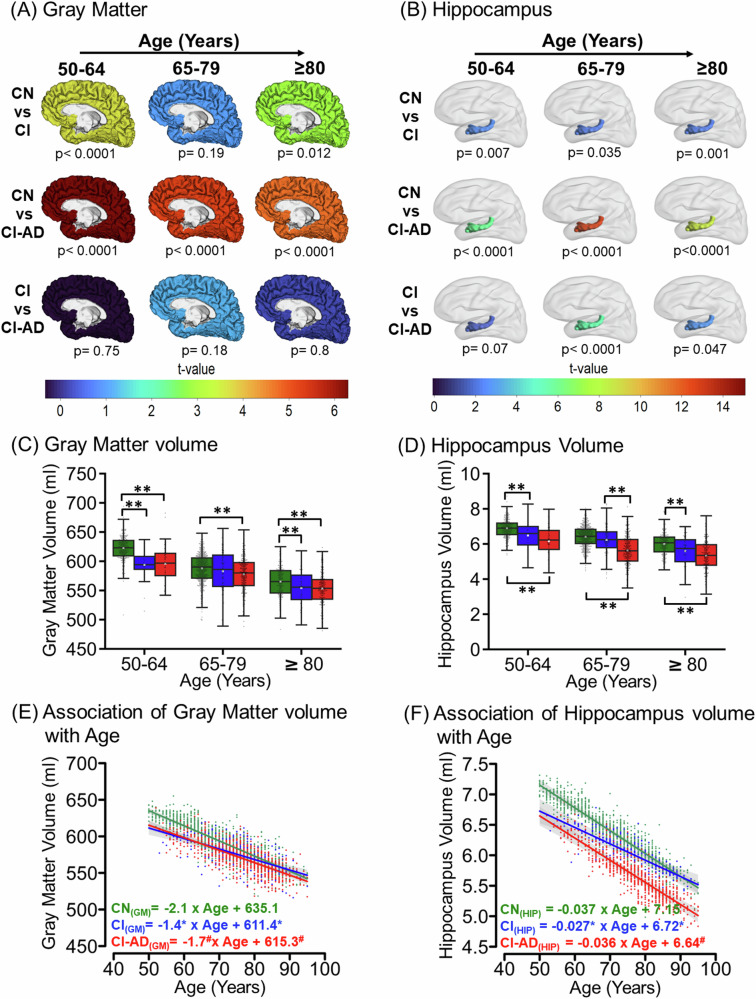
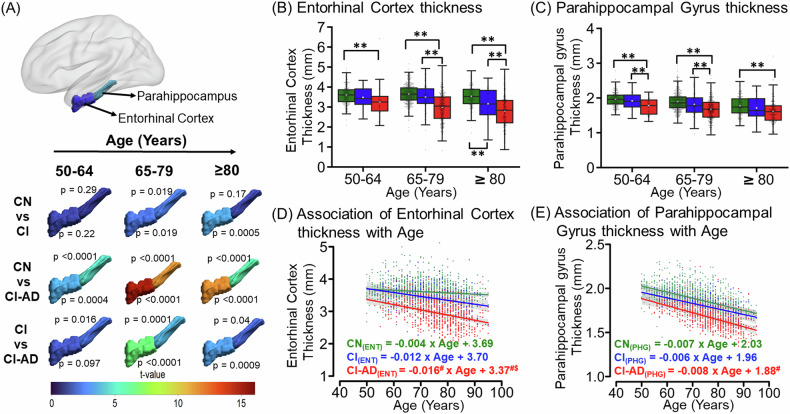
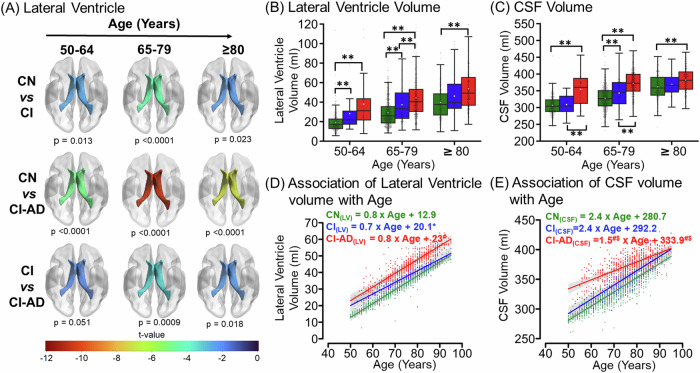
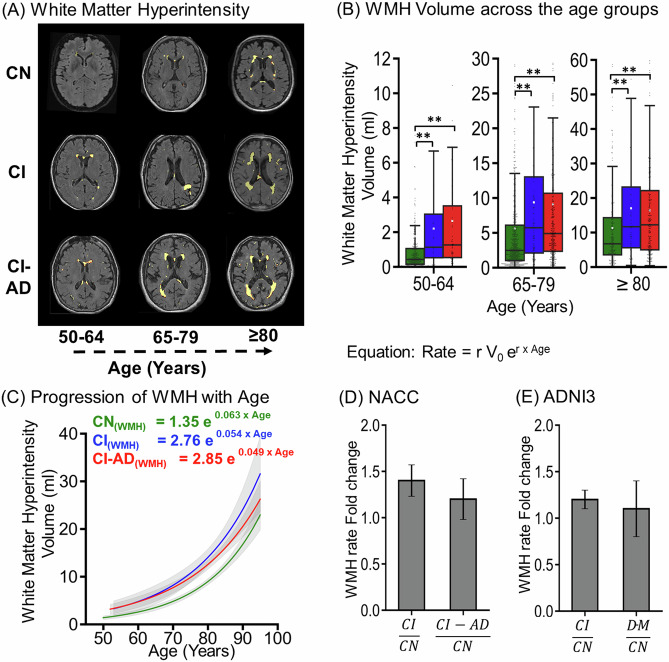
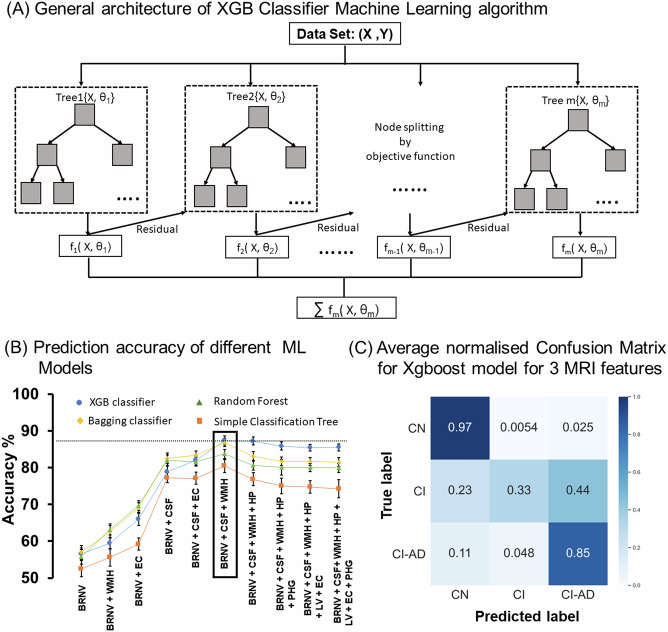
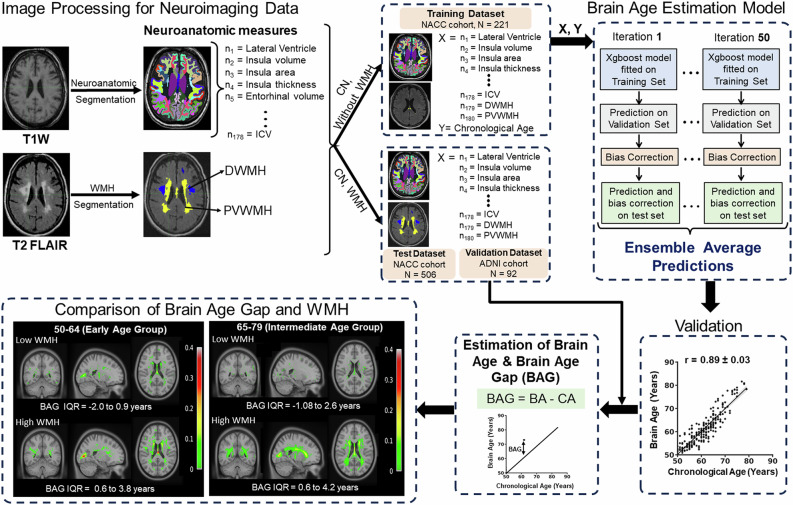
Even among the subjects classified as cognitively normal, there exists a subset of individuals at a given chronological age (CA) who harbor white matter hyperintensity (WMH) while another subset presents with low or undetectable WMH. Here, we conducted a comprehensive MRI segmentation of neuroanatomic structures along with WMH quantification in groups of cognitively normal (CN), cognitively impaired (CI) individuals, and individuals with an etiological diagnosis of cognitive impairment owing to Alzheimer's Disease (CI-AD) across the early (50-64 years), intermediate (65-79 years), and late (≥80 years) age groups from the NACC cohort. Neuroanatomic volumetry quantification revealed that thinning of the parahippocampal gyrus in the early (p = 0.016) and intermediate age groups (p = 0.0001) along with an increase in CSF (p = 0.0009) delineates between CI and CI-AD subjects. Although, a significant loss of ~5-10% in volume of gray matter (p(CN vs CI) < 0.0001, p(CN vs CI-AD) < 0.0001), white matter (p(CN vs CI) = 0.002, p(CN vs CI-AD) = 0.0003) and hippocampus (p(CN vs CI) = 0.007, p(CN vs CI-AD) < 0.0001) was evident at the early age groups in the CI and CI-AD compared to CN but it was not distinct between CI and CI-AD. Using the neuroanatomic and WMH volume, and the supervised decision tree-based ML modeling, we have established that a minimum set of Three brain quantities; Total brain (GM + WM), CSF, and WMH volume, provide the Optimal quantitative features discriminative of cognitive status as CN, CI, and CI-AD. Furthermore, using the volume/thickness of 178 neuroanatomic structures, periventricular and deep WMH volume quantification for the 819 CN subjects, we have developed a quantitative index as 'Brain Age' (BA) depictive of neuroanatomic health at a given CA. Subjects with elevated WMH load (5-10 ml) had increased BA ( + 0.6 to +4 years) than the CA. Increased BA in the subjects with elevated WMH is suggestive of WMH-induced vascular insult leading to accelerated and early structural loss than expected for a given CA. Henceforth, this study establishes that quantification of WMH together with an optimal number of neuroanatomic features is mandatory to delve into the biological underpinning of aging and aging-associated cognitive disorders.


Conflict of interest statement

The authors declare no competing interests.

Figures

Fig. 1
Fig. 1. Magnitude and kinetics of Gray matter and Hippocampus volume with age across CN, CI, and CI-AD subjects.
A Gray matter and B hippocampus volume of the CN, CI, and CI-AD quantified from the first MRI visit showing the differences between CN vs CI, CN vs CI-AD, and CI vs CI-AD subjects is depicted by the t-map across the three age groups: 50–64 (early) (CN = 300, CI = 29, and CI-AD = 58), 65–70 (intermediate) (CN = 560, CI = 107, and CI-AD = 314), and ≥80 (late) (CN = 222, CI = 61, and CI-AD = 216), wherein warmer color depicts the remarkable difference between the two cognitive groups at the given age range. The significance was set to p < 0.017 upon Bonferroni correction. The color bar depicts the t value. Boxplot presents the median and mean volume of C gray matter and D hippocampus quantified from the first visit of the CN, CI, and CI-AD subjects. The volume between the cognitive groups were compared using unpaired, two-tailed Welch’s t test followed by Bonferroni correction. The upper margin of the boxplot represents the Q3 (third quartile), and the lower margin of the box represents the Q1(first quartile). The height of the box represents the interquartile range (IQR); the median is represented by the black line inside the box and the white square in the middle represents the mean of the sample. Statistical significance for comparing the mean gray matter volume between the cognitive groups (CN, CI, and CI-AD) across the stratified age groups is depicted as *p < 0.017, **p < 0.001. Linear Mixed Effect (LME) regression model analysis of change in E gray matter and F hippocampus volume with age. The LME analysis was performed upon setting up the age intercept at 50 years of age for all three cognitive groups. Green, Blue, and Red represent CN, CI, and CI-AD, respectively. Statistical significance for the slope and intercept comparison between CN vs CI (*), CN vs CI-AD (#), and CI vs CI-AD ($) was set at p < 0.05.
Fig. 2
Fig. 2. Cortical thinning with age across CN, CI, and CI-AD subjects.
A The t-map depicting the difference of entorhinal cortex thickness and parahippocampal gyrus thickness between CN vs CI, CN vs CI-AD, and CI vs CI-AD across early (CN = 300, CI = 29, and CI-AD = 58), intermediate (CN = 560, CI = 107, and CI-AD = 314), and late (CN = 222, CI = 61, and CI-AD = 216) (CN = 222, CI = 61, and CI-AD = 216) age groups. The significance was set to p < 0.017 (Bonferroni corrected) and the color bar depicts the t value. Higher the t value greater the difference between the thickness of cognitive groups. B, C The Boxplot with median (solid line) and mean (white square) thickness of the entorhinal cortex and parahippocampal gyrus stratified across the early, intermediate, and late age groups for CN (green), CI (blue), and CI-AD (red) subjects. P values were calculated using the unpaired, two-tailed Welch’s t test followed by Bonferroni correction. Statistical significance for the mean entorhinal cortex and parahippocampal gyrus thickness comparison among cognitive groups (CN, CI, and CI-AD) across the age groups is depicted as *p < 0.017, **p < 0.001. D, E LME regression model analysis of entorhinal cortex and parahippocampal gyrus thickness with age upon setting up the intercept at 50 years. Statistical significance for the slope and intercept comparison between CN vs CI (*), CN vs CI-AD (#), and CI vs CI-AD ($) was set at p < 0.05.
Fig. 3
Fig. 3. Lateral Ventricular hypertrophy and CSF increase with age across CN, CI, and CI-AD subjects.
A The t-map illustrating the difference of Lateral ventricle volume between CN vs CI, CN vs CI-AD, and CI vs CI-AD across three age groups i.e., 50–64 (early) (CN = 300, CI = 29, and CI-AD = 58), 65–70 (intermediate) (CN = 560, CI = 107, and CI-AD = 314), and ≥80 (late) (CN = 222, CI = 61, and CI-AD = 216). The lower the t value, the higher the difference in the lateral ventricle volume between the cognitive groups. The t-value significance was set at p < 0.017 (Bonferroni corrected) and the color bar depicts the t value. Early enlargement of the ventricles was observed for CI and CI-AD groups compared to the CN. B, C Lateral Ventricle and CSF volume of CN, CI, and CI-AD subjects across early, intermediate, and late age groups respectively. P values were calculated with the unpaired, two-tailed Welch’s t test followed by Bonferroni correction. Statistical significance for comparing the mean lateral ventricle and CSF volume among cognitive groups (CN, CI, and CI-AD) across the stratified age groups was depicted as *p < 0.017, **p < 0.001. D, E LME model regression analysis of Lateral ventricle volume and CSF shows a progressive increase in the volume across three cognitive groups- CN (green), CI (blue), and CI-AD (red). The LME analysis was performed upon setting up the age intercept at 50 years. Statistical significance for the slope and intercept comparison between CN vs CI (*), CN vs CI-AD (#), and CI vs CI-AD ($) was set at p < 0.05.
Fig. 4
Fig. 4. White matter hyperintensity (WMH) loads across CN, CI, and CI-AD subjects.
A Segmentation mask of WMH load generated from T1w, and T2-FLAIR MRI for CN CI and CI-AD subjects across early, intermediate, and late age groups. B The Boxplot depicts the median (solid line) and the mean (white square) WMH volume across 50–64 (early) (CN = 300, CI = 29, and CI-AD = 58), 65–79 (intermediate) (CN = 560, CI = 107, and CI-AD = 314), and ≥80 (late) (CN = 222, CI = 61, and CI-AD = 216) subjects. p values were calculated with the Mann-Whitney U test followed by Bonferroni correction. Statistical significance for the WMH comparison among cognitive groups (CN, CI, and CI-AD) across the age groups was depicted as *p < 0.017, **p < 0.001. C The exponential increase of total WMH load with age across CN (green), CI (blue), and CI-AD (red) subjects. The equation represents the rate of change of WMH load where, r is the rate constant and V0 is the initial WMH volume at 50 years of age. D Bar plot depicting mean ± standard deviation WMH rate fold change for CI and CI-AD subjects with respect to cognitively normal (CN) subjects in NACC cohort. E Bar plot depicting Average WMH rate fold change in CI and Dementia (DM) subjects with respect to CN subjects in ADNI cohort.
Fig. 5
Fig. 5. Summary of the Machine learning algorithm performance in predicting the cognitive status of the participants based on the MRI-segmented brain volume and thickness and age.
A Schematics of XGB classifier ML model based on the gradient boosting technique. B Cognitive status prediction accuracy of different ML Models for combination of different MRI obtains neuroanatomic volumes and thicknesses. MRI features were added one by one with age and gender to check for the increase in average accuracy of XGB classifier (blue circle), Random Forest (green triangle), Bagging classifier (yellow diamond) and Simple Classification Tree (orange square) ML models. The result showed the mean accuracy ± SD (standard deviation). The highest accuracy for all ML models was obtained for the combination of three MRI features, i.e., total Brain volume, CSF, and WMH with age and gender, and out of the 4 ML models, the XGB classifier gave the highest accuracy. C Average normalized confusion matrix for XGB classifier ML machine models for predicting the cognitive status of the test data for the three optimized MRI features (total brain volume, CSF, and WMH) with age and gender, which gave the highest accuracy. *BRNV total brain volume, CSF cerebrospinal fluid, LV lateral ventricle, HP hippocampus, WMH white matter hyperintensity, EC entorhinal cortex and PHG parahippocampal gyrus.
Fig. 6
Fig. 6. Brain age (BA) model developed from 180 MRI-obtained neuroanatomical volumetry and white matter hyperintensity load.
Schematics illustrating the workflow of the Brain Age estimation model. The T1 and T2-FLAIR MR images from CN subjects were segmented to obtain 178 neuroanatomic measures, PVWMH, and DWMH. The subjects were then divided into training, test, and validation data sets. The neuroanatomic features, PVWM and DWMH of the subjects in the training data set were used as an input together with Chronological Age (CA) to develop the BA model. The model’s performance was validated using the average association between BA and CA, obtained from the average prediction for 50 iterations. BA and Brain Age Gap (BAG) were estimated using the BA model for test and validation data sets. A comparison of BAG and WMH was shown using voxel-wise probability maps, depicting the occurrence of total WMH load (PVWMH + DWMH) on the coronal, sagittal and axial slice for cognitively normal subjects in the early age group with no or low WMH (WMH < 1.5 ml, n = 95) and high WMH (WMH 5–10 ml, n = 32) and intermediate age group with no or low WMH (n = 35) and high WMH (n = 118) with the range of BAG.

Similar articles

References

    1. Stephan Y, Sutin AR, Luchetti M, Terracciano A. Subjective age and risk of incident dementia: evidence from the National Health and Aging Trends survey. J Psychiatr Res. 2018;100:1–4. - PMC - PubMed
    1. Dickerson BC, Stoub TR, Shah RC, Sperling RA, Killiany RJ, Albert MS, et al. Alzheimer-signature MRI biomarker predicts AD dementia in cognitively normal adults. Neurology. 2011;76:1395–402. - PMC - PubMed
    1. Kaye JA, Swihart T, Howieson D, Dame A, Moore MM, Karnos T, et al. Volume loss of the hippocampus and temporal lobe in healthy elderly persons destined to develop dementia. Neurology. 1997;48:1297–304. - PubMed
    1. Peters R. Ageing and the brain. Postgrad Med J. 2006;82:84–88. - PMC - PubMed
    1. Raz N. Selective aging of the human cerebral cortex observed in vivo: differential vulnerability of the prefrontal gray matter. Cereb Cortex. 1997;7:268–82. - PubMed

MeSH terms

LinkOut - more resources