. 2024 Sep 27;15(1):8390.
doi: 10.1038/s41467-024-52703-w.

Phosphoproteomics-directed manipulation reveals SEC22B as a hepatocellular signaling node governing metabolic actions of glucagon

Affiliations

Phosphoproteomics-directed manipulation reveals SEC22B as a hepatocellular signaling node governing metabolic actions of glucagon

Yuqin Wu et al. Nat Commun. .

Abstract

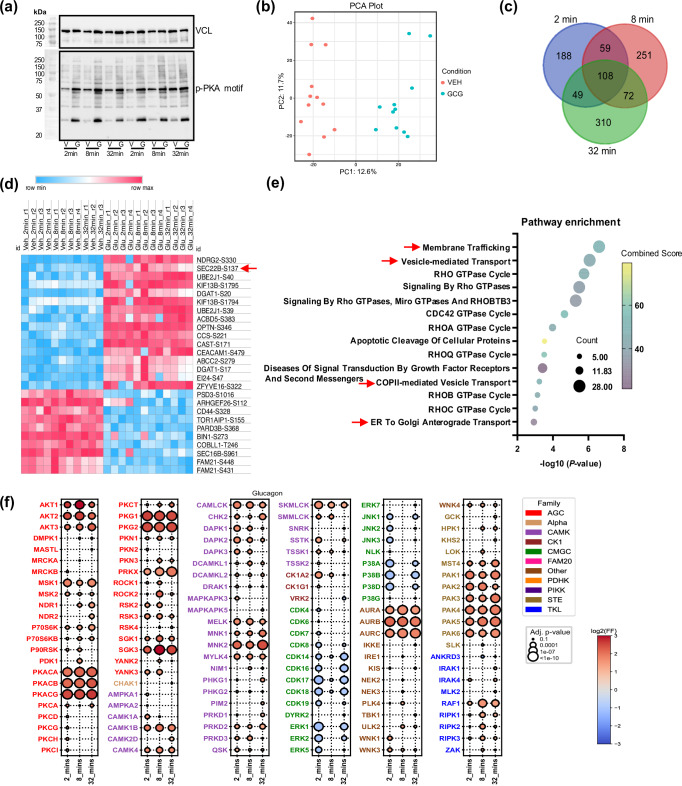
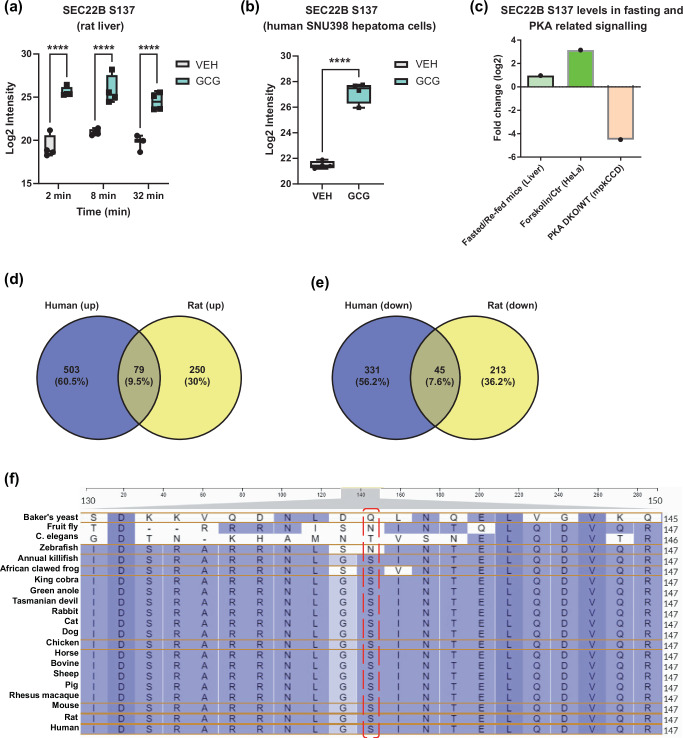
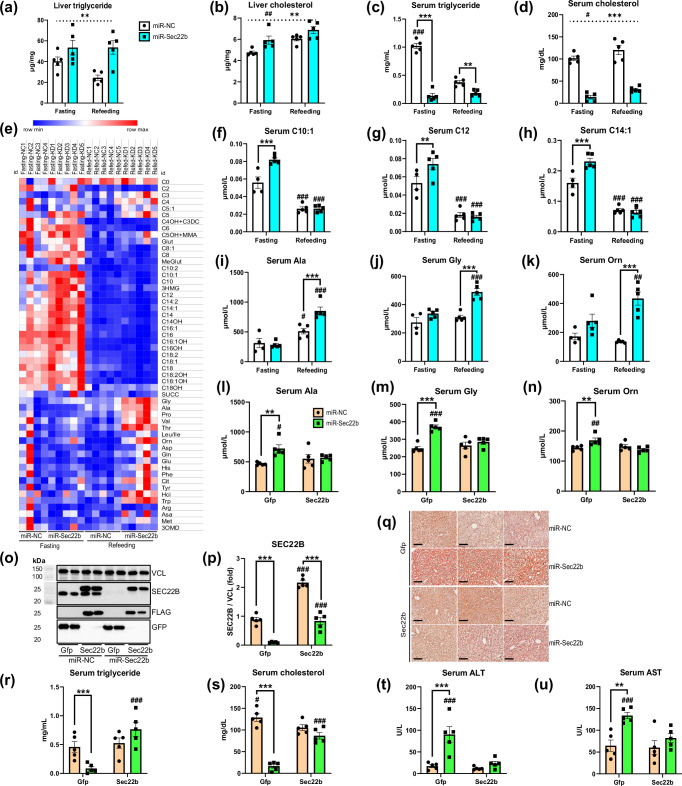
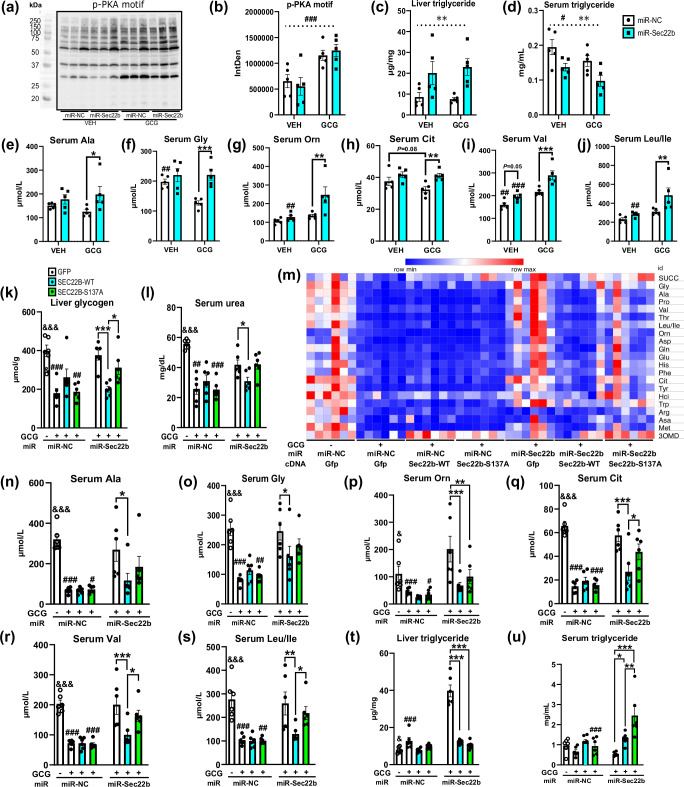
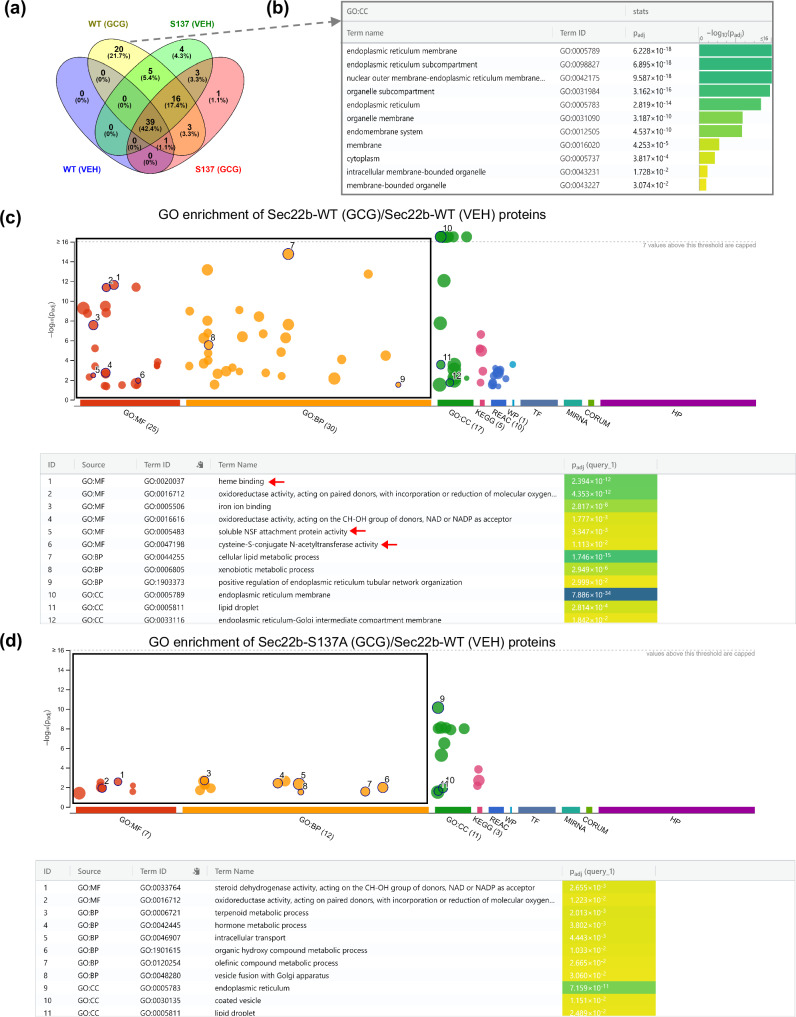
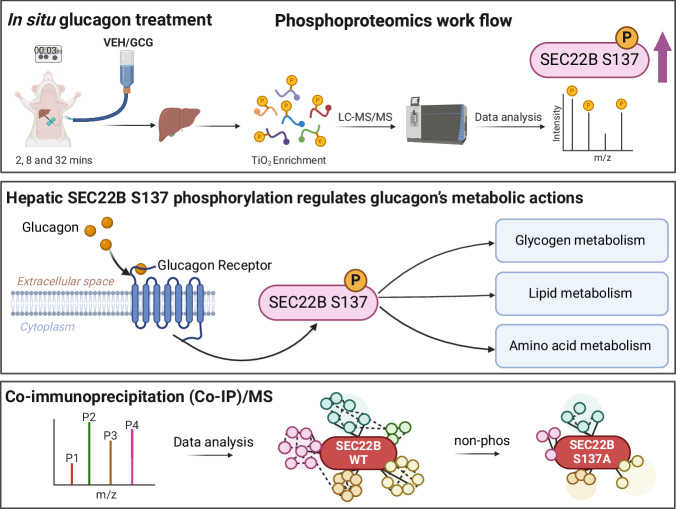
The peptide hormone glucagon is a fundamental metabolic regulator that is also being considered as a pharmacotherapeutic option for obesity and type 2 diabetes. Despite this, we know very little regarding how glucagon exerts its pleiotropic metabolic actions. Given that the liver is a chief site of action, we performed in situ time-resolved liver phosphoproteomics to reveal glucagon signaling nodes. Through pathway analysis of the thousands of phosphopeptides identified, we reveal "membrane trafficking" as a dominant signature with the vesicle trafficking protein SEC22 Homolog B (SEC22B) S137 phosphorylation being a top hit. Hepatocyte-specific loss- and gain-of-function experiments reveal that SEC22B was a key regulator of glycogen, lipid and amino acid metabolism, with SEC22B-S137 phosphorylation playing a major role in glucagon action. Mechanistically, we identify several protein binding partners of SEC22B affected by glucagon, some of which were differentially enriched with SEC22B-S137 phosphorylation. In summary, we demonstrate that phosphorylation of SEC22B is a hepatocellular signaling node mediating the metabolic actions of glucagon and provide a rich resource for future investigations on the biology of glucagon action.


Conflict of interest statement

A.J.R and P.M.R receive research support from Boehringer-Ingelheim, a pharmaceutical company, for an unrelated research project. L.C.C is a founder and member of the board of directors of Agios Pharmaceuticals and is a founder and receives research support from Petra Pharmaceuticals; is listed as an inventor on a patent (WO2019232403A1, Weill Cornell Medicine) for combination therapy for PI3K-associated disease or disorder, and the identification of therapeutic interventions to improve response to PI3K inhibitors for cancer treatment; is a co-founder and shareholder in Faeth Therapeutics; has equity in and consults for Cell Signaling Technologies, Volastra, Larkspur, Omega Funds and 1 Base Pharmaceuticals; and consults for Loxo-Lilly. T.M.Y. is a co-founder of DeStroke. J.L.J has received consulting fees from Scorpion Therapeutics and Volastra Therapeutics. All other authors declare no conflicts of interest.

Figures

Fig. 1
Fig. 1. Glucagon induces rapid and dynamic changes in the liver phosphoproteome.
a Male Sprague Dawley rats were treated with vehicle (V) or glucagon (G) (1.15 nM) for 2, 8 and 32 min (n = 4 rats per group) in situ. Western blot images of liver phospho-protein kinase A (pPKA) motif protein substrates and control vinculin (VCL) were performed. b Principal component analysis (PCA) analysis via the Phospho-Analyst platform from liver samples (using pooled VEH and GCG data sets, n = 11 for VEH and n = 12 for GCG). c VENN diagram of liver phosphoproteomics data from samples as in b (n = 4 rats per group except VEH, 32 min: n = 3). d Heatmap plot of up-regulated (log2 fold change > 4) and down-regulated (log2 fold change < −3) phosphopeptides across all time points from samples as in a (n = 4 rats per group except VEH, 32 min: n = 3). The red arrow indicates SEC22B-S137. Source data are provided as a Source Data file. e Pathway enrichment analysis using EnrichR (Reactome Pathway Database) via the Phospho-Analyst platform (using pooled VEH and GCG data sets, n = 11 for VEH and n = 12 for GCG). EnrichR using Fisher’s exact test and corrected with Benjamini–Hochberg multiple testing. The red arrow indicates the pathway in which SEC22B is involved. f Bubble plot of predicated kinase activation from phosphoproteomics data. Statistical significance was assessed using a one-sided Fisher’s exact test, with p-values adjusted by the Benjamini–Hochberg method. Detailed statistical analysis is provided in the “Phosphoproteomics-Based Kinase Prediction” section of the Methods.
Fig. 2
Fig. 2. Glucagon increases SEC22B S137 phosphorylation levels.
a SEC22B S137 phosphorylation levels of male Sprague Dawley rats treated with either vehicle (VEH) or glucagon (GCG) (1.15 nM) for 2, 8 and 32 min (n = 4 rats per group except VEH, 32 min: n = 3) in situ. Statistical tests used were two-way ANOVA with Holm-Sidak post-hoc tests. Difference in treatment: ****P < 0.001. b SEC22B S137 phosphorylation levels of SNU398-GCGR cells treated with either vehicle (VEH) or glucagon (GCG) (1 nM) for 30 min (n = 4 per group). Significance was determined using an unpaired two-tailed Student’s t-test. Difference in treatment: ****P < 0.001. c Data mining of liver SEC22B S137 levels from other phosphoproteomics studies via qPTM database. de Venn diagrams shows the overlap of up-regulated (log2 fold change > 1, P value < 0.05) and down-regulated (log2 fold change < −1, P value < 0.05) phospho-proteins (d-e) between rat and human cell lines. f Amino acid residue alignment of phospho-motif sequence SEC22B in different organisms. Source data are provided as a Source Data file. For box plots, data are displayed from the minimum to maximum values, with all individual points shown. The central line represents the median, the box spans the interquartile range (IQR) from the first to third quartile, and the whiskers extend to the smallest and largest values within 1.5 times the IQR from the quartiles (a, b).
Fig. 3
Fig. 3. Hepatic SEC22B silencing affects serum and liver metabolites in fasting and refeeding conditions.
a Liver triglyceride levels of male C57Bl/6 N mice administered with adeno-associated viruses expressing a microRNA to silence Sec22b (miR-Sec22b) or a negative control (miR-NC) and fasted for 16 h (fasting) or fasted and then refed for 5–6 h (refeeding). Data are mean ± s.e.m.; n = 5 mice per group. Statistical tests used were 2-way ANOVA with Holm-Sidak post-hoc tests. Dotted line shows the main effect. Difference between fasting and refeeding: #P < 0.05, ##P < 0.01, ###P < 0.001; Difference between miR-NC and miR-Sec22b: *P < 0.05, **P < 0.01, ***P < 0.001. b Liver cholesterol levels of mice as in a. c Serum triglyceride levels of mice as in a. d Serum cholesterol levels of mice as in a. e A heatmap of serum acyl-carnitine and amino acid species of mice (n = 5 mice per group except Fasting & miR-NC group: n = 4). Abbreviations for serum amino acids and acylcarnitines are provided in Supplementary Data 5. fh Select serum acyl-carnitine species levels of mice as in e. ik Select serum amino acid species levels of mice as in e. ln Select serum amino acid species levels of male C57Bl/6 N mice administered with adeno-associated viruses expressing a microRNA to silence Sec22b (miR-Sec22b) or a negative control (miR-NC), with Flag-tagged Sec22b cDNA (Sec22b) or a control (Gfp), these mice are fasted and then refed for 5–6 h. Data are mean ± s.e.m.; n = 5 mice per group. Statistical tests used were 2-way ANOVA with Holm-Sidak post-hoc tests. Difference between fasting and refeeding: #P < 0.05, ##P < 0.01, ###P < 0.001; Difference between miR-NC and miR-Sec22b: *P < 0.05, **P < 0.01, ***P < 0.001. o: Liver western blot images of SEC22B, FLAG, GFP and control VCL of mice as in l. p Western blot quantification of o. Samples were obtained from the same experiment, and blots were processed simultaneously. q Liver oil-red O stain images of mice as in l. Images are representative of three individual mice per group. Scale bar: 100 µm. r Serum triglyceride levels of mice as in l. s Serum cholesterol levels of mice as in l. t Serum ALT levels of mice as in l. u Serum AST levels of mice as in l. Source data are provided as a Source Data file. Exact P-values are provided in Supplementary Data 6.
Fig. 4
Fig. 4. Hepatic SEC22B-S137 phosphorylation modulates distinct metabolic actions of glucagon.
a Liver western blot images of liver phospho-protein kinase A (pPKA) motif protein substrates and control vinculin (VCL) from male C57Bl/6 N mice administered with adeno-associated viruses expressing a microRNA to silence Sec22b (miR-Sec22b) or a negative control (miR-NC) and fasted for 2 h acutely treated with saline (VEH) or acyl-glucagon (GCG). Images are of 3 individual mice per group. b Western blot quantification of liver phospho-PKA motif protein expression as in a. Samples were obtained from the same experiment, and blots were processed simultaneously. Data are mean ± s.e.m.; n = 5 mice per group. Statistical tests used were 2-way ANOVA with Holm-Sidak post-hoc tests. Dotted line indicates a main effect. Difference between vehicle and glucagon: #P < 0.05, ##P < 0.01, ###P < 0.001; Difference between miR-NC and miR-Sec22b: *P < 0.05, **P < 0.01, ***P < 0.001. c Liver triglyceride levels of mice as in b. d Serum triglyceride levels of mice as in b. ej Select serum amino acid levels of mice as in b. k Liver glycogen levels of male C57Bl/6 N mice administered with adeno-associated viruses expressing a microRNA to silence Sec22b (miR-Sec22b) or a negative control (miR-NC), and/or AAV-Sec22b wildype (WT) or S137A mutant (S137A) cDNA (Sec22b) or a control (GFP) and treated with either saline (VEH) or acyl-glucagon (GCG) chronically for 2 wk. Data are mean ± s.e.m.; n = 6 mice per group. Statistical tests used include unpaired two-tailed Student T-test (for miR-NC&GFP&VEH and miR-NC&GFP&GCG) and 2-way ANOVA (for all the glucagon treated groups) with Holm-Sidak post-hoc tests. Difference between vehicle and glucagon: &P<0.05, &&P < 0.01, &&&P < 0.001; Difference between miR-NC and miR-Sec22b: #P < 0.05, ##P < 0.01, ###P < 0.001; Difference in GFP, SEC22B-WT and SEC22B-S137A: *P < 0.05, **P < 0.01, ***P < 0.001. l Serum urea levels of mice as in k. m A heatmap of serum amino acid species of mice as in k. Abbreviations for serum amino acids are provided in Supplementary Data 5. ns Selected amino acid levels of mice as in k. t Liver triglyceride levels of mice as in k. u Serum triglyceride levels of mice as in k. Source data are provided as a Source Data file. Exact P-values are provided in Supplementary Data 6.
Fig. 5
Fig. 5. The glucagon-related hepatocyte SEC22B interactome is modulated by S137 phosphorylation.
a Male C57Bl/6 N mice administered with adeno-associated viruses expressing a microRNA to silence Sec22b (miR-Sec22b) with re-expressing of Sec22b cDNA (Sec22b-WT or Sec22b-S137A) or a AAV control (miR-NC & Gfp). The mice were acutely treated with either saline (VEH) or acyl-glucagon (GCG) (n = 3/group). Co-immunoprecipitation proteomics analysis of the liver lysates was then conducted. VENN diagram summarizes the amount of proteins interacting with SEC22B under the different conditions (enriched proteins: Log2 > 4, FDR < 0.05). b Functional enrichment analysis of 20 proteins which exclusively bounded with SEC22B (in Sec22b-WT + Glucagon group). c Gene ontology enrichment analysis of glucagon induced proteins bound with SEC22B-WT protein (Sec22b-WT + GCG/Sec22b-WT + VEH). d Gene ontology enrichment analysis of glucagon induced proteins bound with SEC22B-S137A mutant proteins (Sec22b-S137A + GCG/Sec22b-WT + VEH). For enrichment analysis, g:GOSt tool was used on the gProfiler web server to perform functional enrichment. g:GOSt utilizes Fisher’s one-tailed test and applies multiple testing correction by default.
Fig. 6
Fig. 6. A graphical summary of this study.
Top panel: rat liver perfusion experiments reveal the time resolved glucagon-regulated phosphoproteome to identify vesicle trafficking and SEC22B as potential players. Middle panel: molecular physiology experiments reveal that hepatic SEC22B and SEC22B-S137 phosphorylation are required for glucagon-regulated metabolism. Bottom panel: hepatic SEC22B interactome experiments unveil mechanisms by which SEC22B and S137 phosphorylation may regulate metabolism downstream of glucagon. Created in BioRender. Wu, Y. (2023) BioRender.com/j53f752.

References

    1. Kimball C. P. & Murlin J. R. Aqueous extracts of pancreas: III. Some precipitation reactions of insulin. J. Biol. Chem.58, (1923).
    1. Finan, B., Capozzi, M. E. & Campbell, J. E. Repositioning glucagon action in the physiology and pharmacology of diabetes. Diabetes69, 532–541 (2020). - PMC - PubMed
    1. Lee, Y. H., Wang, M. Y., Yu, X. X. & Unger, R. H. Glucagon is the key factor in the development of diabetes. Diabetologia59, 1372–1375 (2016). - PubMed
    1. Wewer Albrechtsen, N. J. Glucagon receptor signaling in metabolic diseases. Peptides100, 42–47 (2018). - PubMed
    1. Müller, T. D., Finan, B., Clemmensen, C., DiMarchi, R. D. & Tschöp, M. H. The new biology and pharmacology of glucagon. Physiol. Rev.97, 721–766 (2017). - PubMed

Publication types

LinkOut - more resources